Technical Analysis Of The Markets


Current Position of the Market
SPX: Long-term trend – There are no signs that the bull market is over.
Intermediate trend – Most likely near an intermediate top.
Analysis of the short-term trend is done on a daily basis with the help of hourly charts. It is an important adjunct to the analysis of daily and weekly charts which discusses the course of longer market trends.
Market Review
Point & Figure Overview of SPX
Long-term trend: The bull market which started in 03/09 shows no sign of having run its course. A rough count taken on the long-term Point & Figure chart gives us a potential target to as high as 4080. P&F does not predict time, only price. (no change)
Intermediate trend: A more recent re-accumulation phase on the 3X10 chart projects 3330 to end this short-to-intermediate trend.
Important Cycles
In February, three important cycles are scheduled to make their lows: The 2-yr cycle, the 20-wk cycle, and the 80-day cycle.
Market Analysis (All charts are courtesy of QChart)
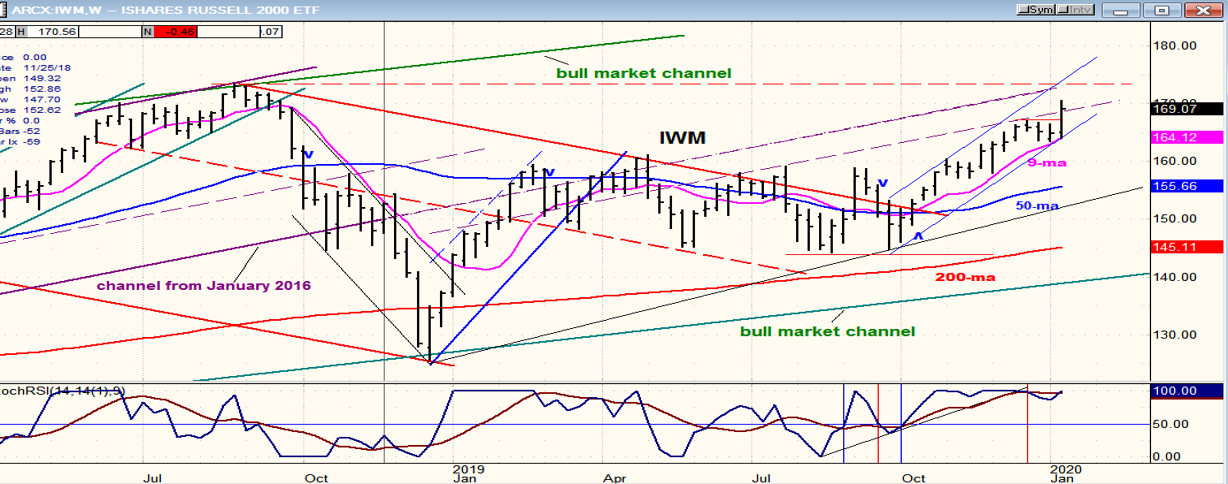
SPX-IWM weekly charts
Mighty market did not let a trivial matter like its long-term top channel line stop its advance, and last week it punched through and closed outside of it. Nevertheless, this is not a break-out! Instead it is likely to be the end of the phase which started at 2856. Cycles bottoming in February should see to that.
IWM (169.07) found support on its 9-ma and was caught up in the bullish frenzy, eliminating the relative weakness which was showing for the past two weeks. Although it is approaching it, it still remains below its August 2018 high (173.39).

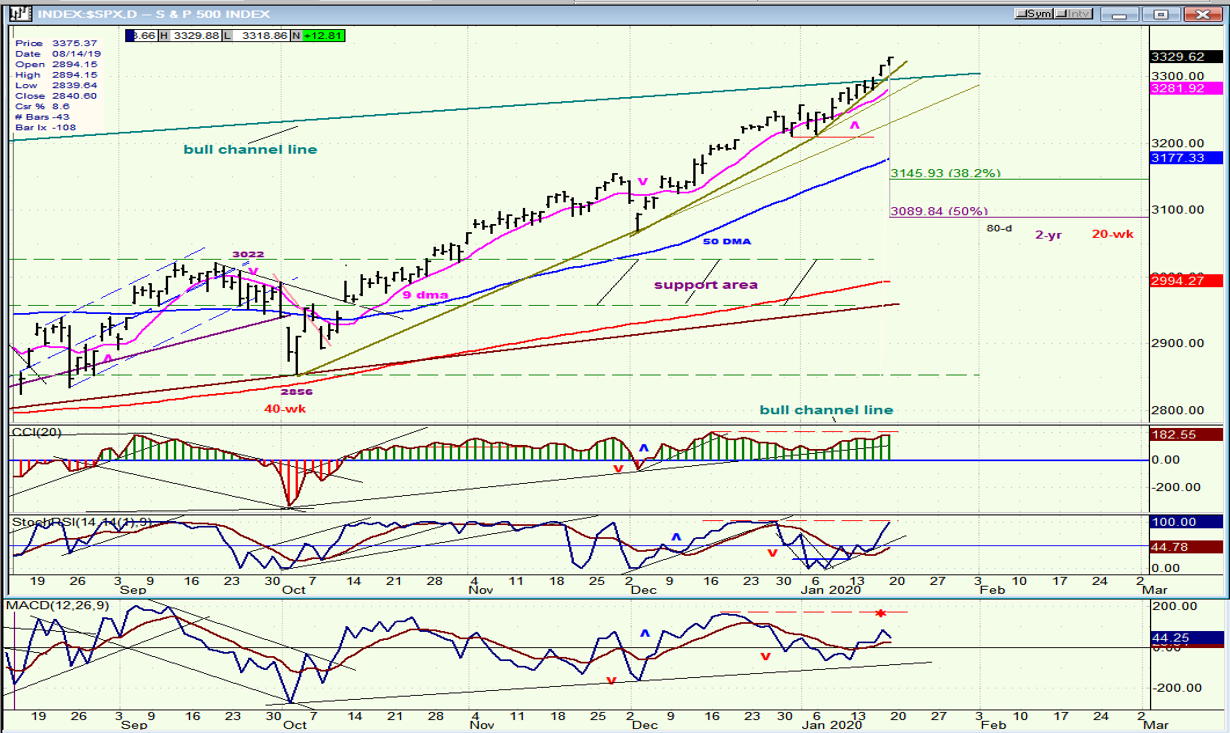
SPX daily chart
It appears that the uptrend from 2856 has gone exponential. Each subsequent phase has risen at a sharper angle than the previous one with the last one piercing outside of the bull market channel from 2009. Given that the next P&F projection target has been reached, and that important cycle lows lie directly ahead, a sharp price retracement is imminent.
Friday saw a record high of 3329.88 in the last 15 minutes of the session with a close near the high, but a minor cycle is likely to pull prices down into Tuesday or Wednesday. With the futures down six points after the close, we already have a hint that we should get a retracement when the market reopens. This could be followed by some hovering around 3330 for a little while before the February cycles take over and cause a very swift and sharp correction. I have posted the Fibonacci levels which are likely to mark the low of that correction. Even if the decline only retraces normally to the .382 level, this would amount to a 184-point drop which will take many by surprise given the steady march higher of the index with little consolidation along the way.
Because of the price pattern, the momentum indicators were not able to give much of a warning, but the A-D indicator (at the bottom) clearly showed declining breadth support for prices, including a downturn at Friday’s top.
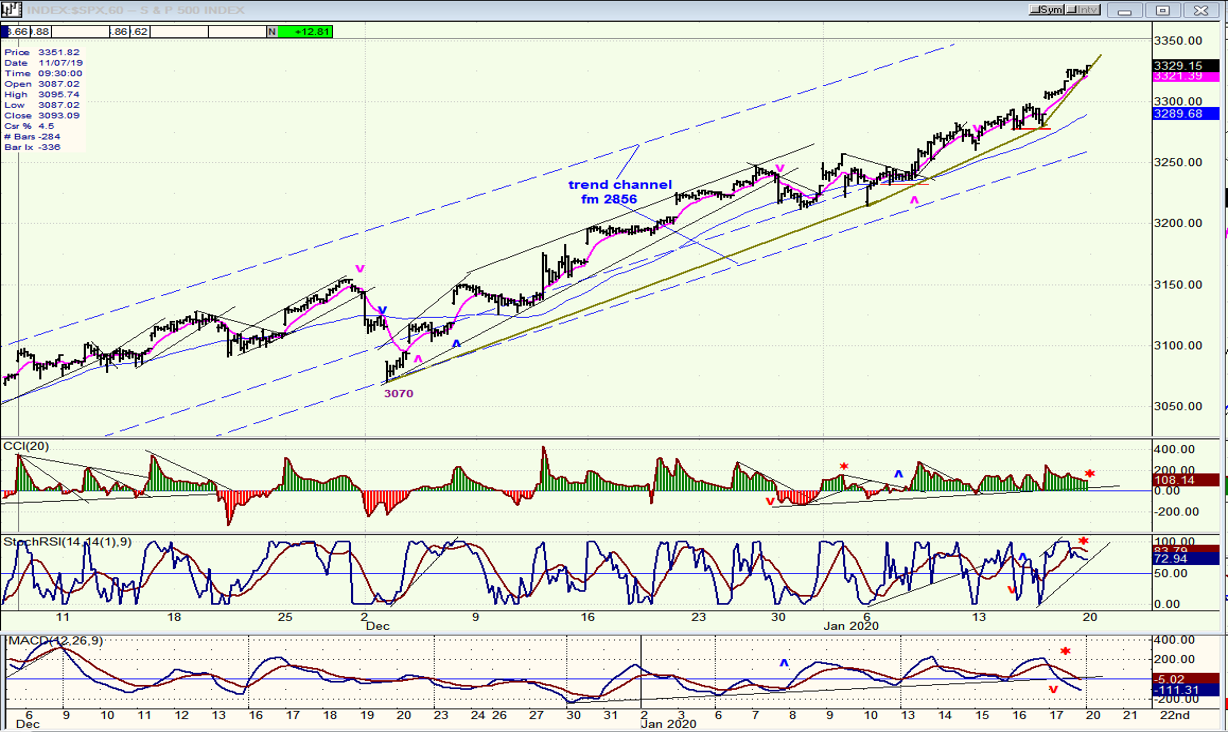
SPX hourly chart
The exponential move of the last phase is even more visible on the hourly chart with the last few days going nearly vertical, most likely as a result of news of the signing of the phase one trade agreement. A lot of folks disregarded the old adage “buy on the rumor and sell on the news” and they will probably live to regret it.
At the hourly level, the indicators did not fail to warn us that the end is near. In spite of the price strength going into Friday, the A-D oscillator went in the opposite direction and gave a sell signal. Even the momentum indicators showed negative divergence.
Everything considered, it is easy to understand why traders were already cautiously taking profits in the futures after Friday’s close.
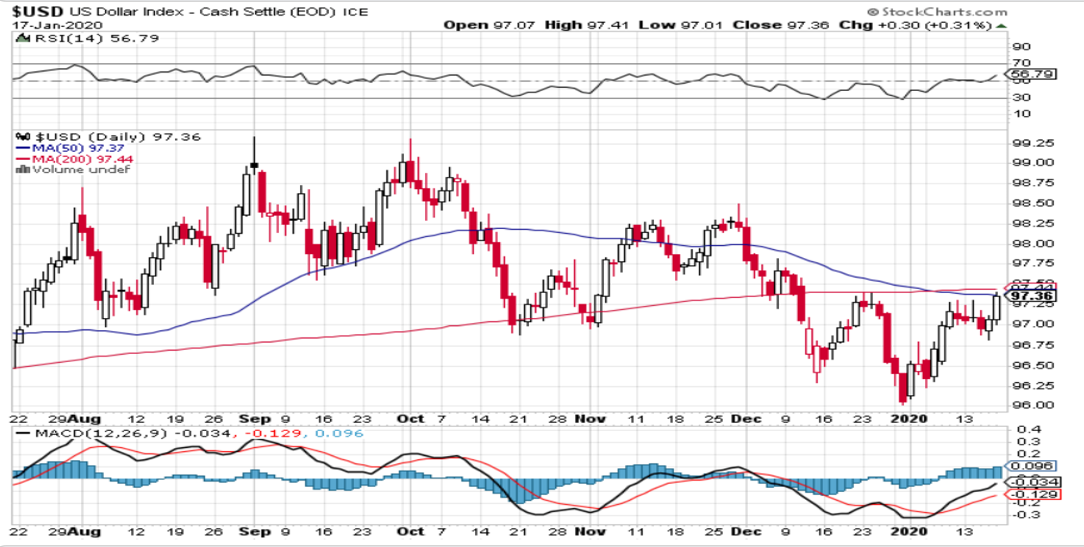
$USD daily (courtesy StockCharts)
USD moved higher into the resistance area created by the junction of two important MAs. This is likely to put a temporay halt to the move from 96.06, especially since it appears to be forming a 5th wave from that low. After stalling around its current price level, it should start a consolidation phase.
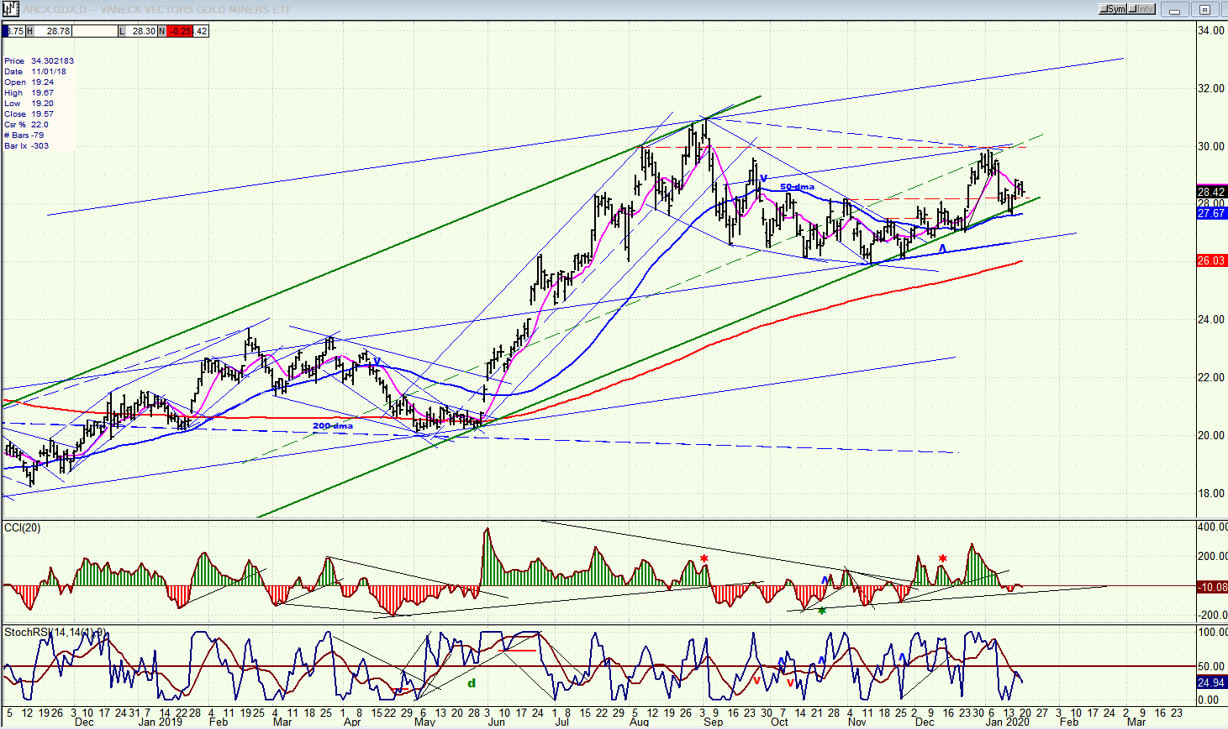
GDX (Gold miners ETF) daily
GDX is holding above its trend/channel line, and if it can manage to stay above it for a few more days, it may be in a position to challenge its recent short-term high near the 30 level. A break of the green channel line will extend the correction since that would also be a break of the 50-dma which, as you can see on the chart, has consistently affected the trend.
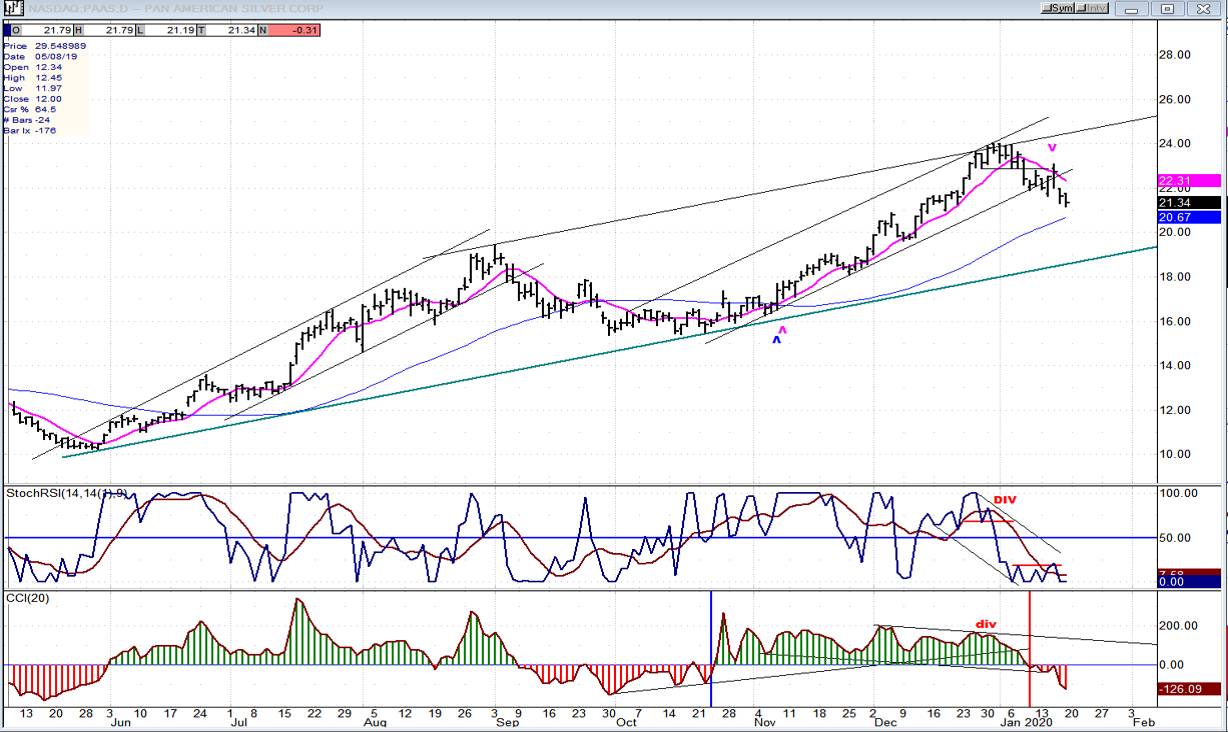
PASS (Pan American Silver Corp.) daily
PAAS is approaching its 50-dma. If it can hold above it, it could be in a position to resume its uptrend. It too would need to hold above the 50-dma which is less than a point below its Friday close.
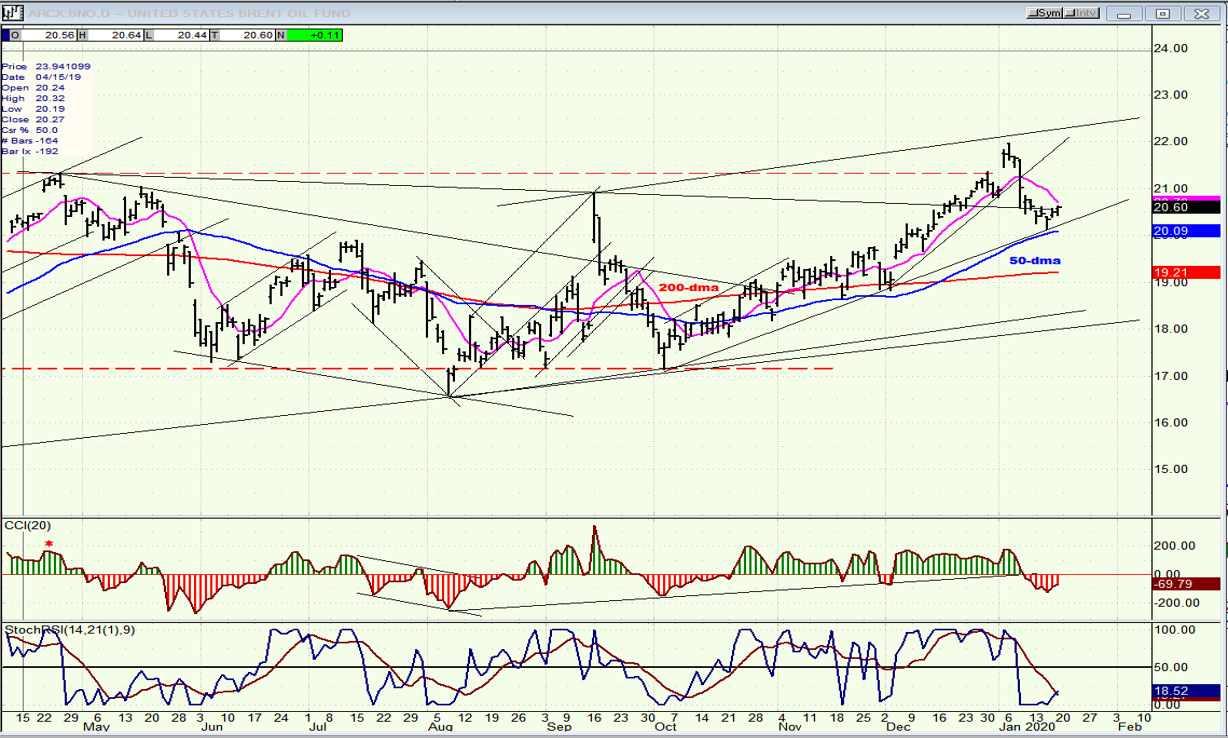
BNO (U.S. Brent oil fund) daily
Profit taking quickly occurred after BNO reached its 22 price projection. With the market ready for a sharp correction, BNO is likely to lose more valuation over the short term.
Summary
A final thrust to about 3300 is possible when the trade deal is signed next Wednesday. I was again too conservative in my price estimate, but probably not wrong in this being the final thrust for this bullish market phase from 2856. With the cycles discussed above due to make their lows in February, SPX and other benchmark indexes are likely ready for a sharp correction.
FREE TRIAL SUBSCRIPTON
With a trial subscription, you will have access to the same information that is given to paid subscribers, but for a limited time period. I think you will find that knowing how far a move can carry is one of the most useful benefits of this service, whether you are a trader or an investor -- especially when this price target is confirmed by reliable indicators which give advance warning of a market top or bottom. Furthermore, cycle analysis adds the all- important time element to the above price projections. For a FREE 4-week trial, further subscription options, payment plans, and for general information, I encourage you to visit my website at www.marketurningpoints.com.
The above comments about the financial markets are based purely on what I consider to be sound technical analysis principles. They represent my own opinion and are not meant to be construed as trading or investment advice, but are offered as an analytical point of view which might be of interest to those who follow stock market cycles and technical analysis.
********

When Andre Gratian was a stock broker years ago, a friend introduced him to technical analysis of the market. Consequently, it is not an exaggeration to say that Andre fell in love with this approach! Ever since then, it has become an increasingly important part of his professional life. Gratian has studied the works of Wyckoff, Edwards & Magee, Edward J. Dewey (cycles) and many others. However, one of my most profitable undertaking has probably been to study Point & Figure charting, which he finds invaluable in analyzing stocks and indices. If he were restricted to one methodology, this is the one that he would choose. This well-rounded background has given him what he feels to be a special insight into the stock market, facilitating the recognition of meaningful patterns and the ‘turning points’ in all trends, whether they be short or long term. Andre feels very comfortable discussing the stock market and passing on meaningful information to others. His subscribers include individuals and money managers throughout the world. Moreover, his Newsletters are currently published on several financial sites, here and abroad.


