Technical Analysis Of The Markets


Current Position of the Market
SPX Long-term trend: There is some good evidence that we are still in the bull market which started in 2009.
SPX Intermediate trend: New intermediate uptrend underway since 2234.
Analysis of the short-term trend is done daily with the help of hourly charts. They are important adjuncts to the analysis of daily and weekly charts which discuss longer market trends.
Short-term Decision Time
Cycles: Looking ahead! 90-yr cycle – last low: 1932. Next low: 2022
7-yr cycle – last low: 2016. Next low: 2023
Market Analysis (Charts courtesy of QCharts
SPX-IWM weekly charts
After its high of 8/18, IWM began to lag SPX significantly. Since 9/20 however, this has changed radically with IWM taking the lead in a dramatic display of relative strength which continued into last week. This has brought the latter into what could be a resistance area where some top channel lines converge. We’ll have to see if that stops its bullish advance, and for how long.

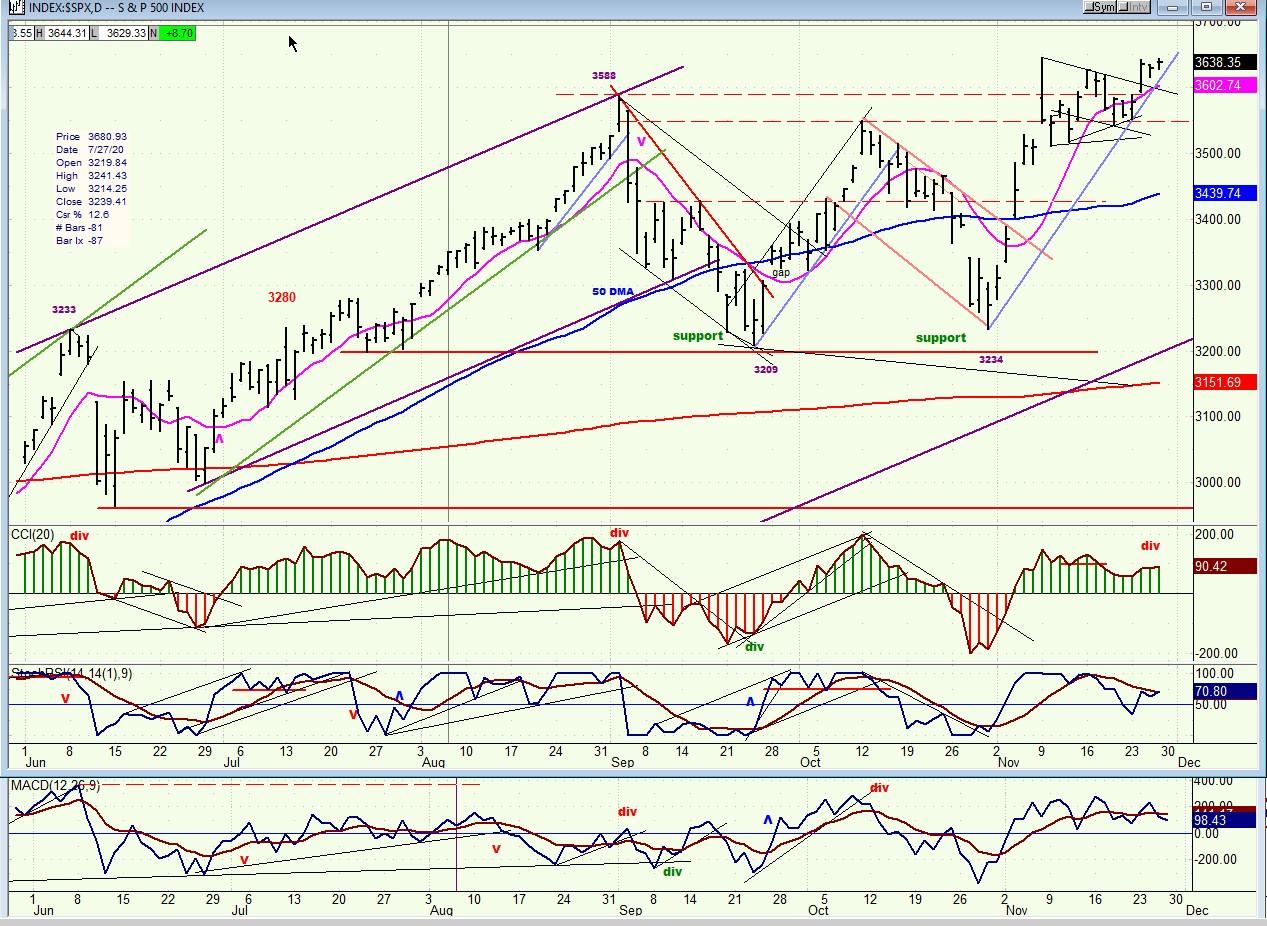
SPX daily chart
Last week had the markings of a potential correction; but instead, the index surged to close near its high with DJIA reaching 30,000 for the first time. The altered course of the market can easily be attributed to the announcement of a new vaccine which is purported to be as effective as the previous two, but which can be stored much more easily and which will cost very little. This has brought SPX to a technical point which will be discussed in more detail in the hourly chart section. While the trend remains bullish and the index looks close to making new all-time highs, the fly in the ointment is the behavior of the indicators which, so far, are not confirming. If these do not do so by early next week, we could be looking at the pull-back which was expected a week ago, and was simply delayed.
All three oscillators were still bullish at the end of the week, but they are not keeping up with the price index. This can always be a warning that a momentum shift is taking place and, if not rectified immediately, will lead to a correction.
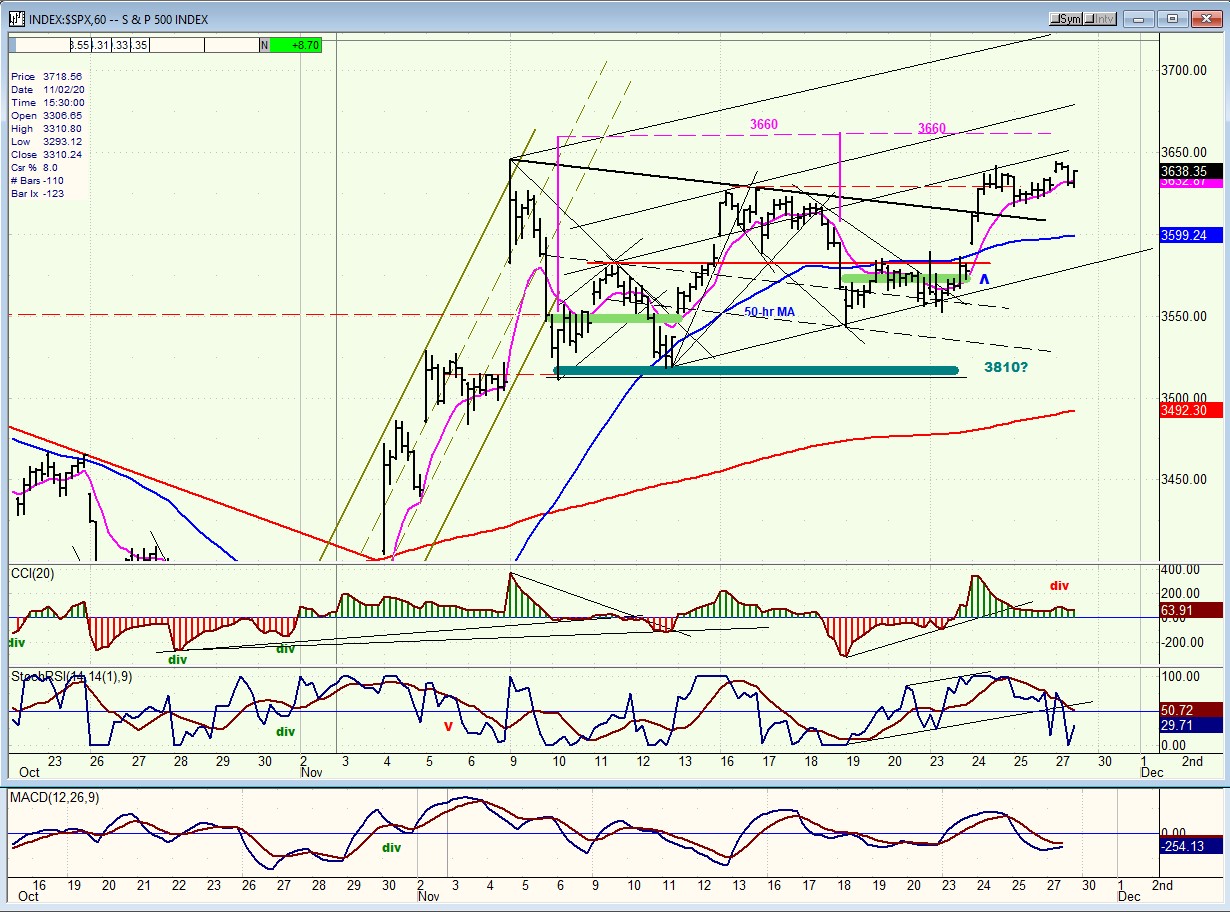
SPX hourly chart
There are two interpretations to this chart pattern which may not be all that different, except that one would lead to a minor pull-back and the other to something more substantial.
In the more bullish interpretation, the pattern since 11/10 can be construed to be one large re-accumulation base (blue-green span) which produces a count to 2810. On the other hand, if the second small base (light green) is only a confirmation of the first one, this rally can come to an end at about 3660, followed by a correction proportional to what the pattern really represents. Also, instead of being a re-accumulation phase, the entire pattern turns out to be distribution, then what could follow is what was expected last week: a potential .382 to .50 retracement of the rally from 3234. In structural terms, this could then be a wave 2 correction of the new uptrend before wave 3 kicks in.
As mentioned above, negative divergence is showing in the daily oscillators and, unless this improves quickly, it gives more credibility to the bearish interpretation of the pattern which the market is making. After Friday’s limited trading session, SPX looks on the verge of rolling over with negative divergence in the CCI, and the other two oscillators are already negative.
UUP (dollar ETF) ($USD chart not available from this data provider)
After reaching the 3-mo cycle low, which has been very regular and dependable, UUP had a small bounce which quickly ended and was followed by continued selling to a slightly new low. This is bearish action which suggests that, after a brief respite, UUP may now be ready to continue the downtrend which started at 28.90. This is not yet assured but would be if the weakness continues below the dashed red line.

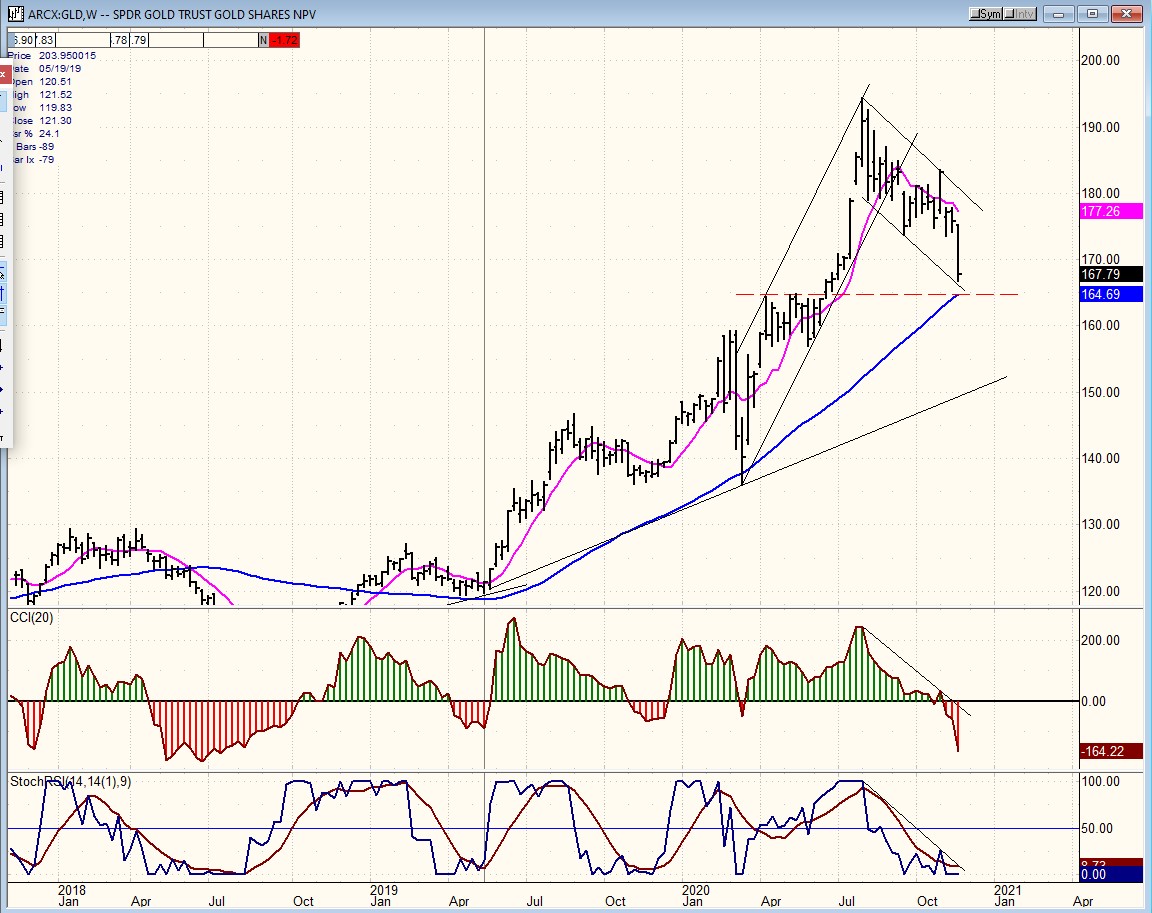
GLD (gold-wkly), GDX (gold miners-dly)
Last week GLD sold off sharply to the bottom of its corrective channel demonstrating – unless this is a climactic sell announcing the end of the correction – that it is not ready to resume its uptrend and could still drop a little lower to an area of support provided by a former consolidation pattern and its blue 50-MA.
GDX followed GLD with a sharp drop of its own, barely holding in the support band and breaking below its 200-dma -- which could be a problem if it does not get back above it soon. It had a minor bounce over the past two days but will have to do better and show that it is ready to hold at this level and climb back to higher ground.

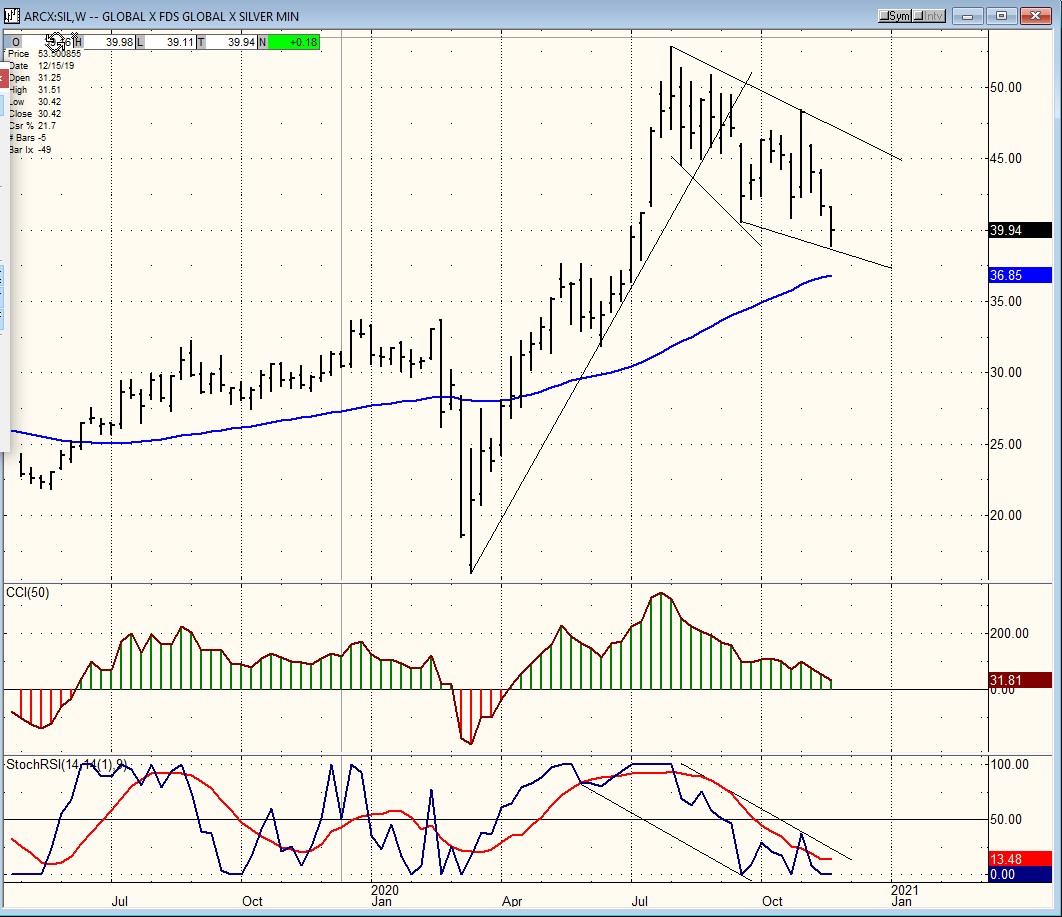
SIL (silver-wkly), PAAS (Pan American Silver Corp-dly)
SIL corrected along with GLD, but did not give up quite as much ground, retaining the RS which it acquired after the March low. Unless a sudden wave of buying in silver occurs, the correction can last a little longer before the index is in a position to reverse its downtrend.
PAAS
PAAS is finding support on its 200-dma and, with some positive divergence appearing in is CCI, may soon attempt to reverse its trend.

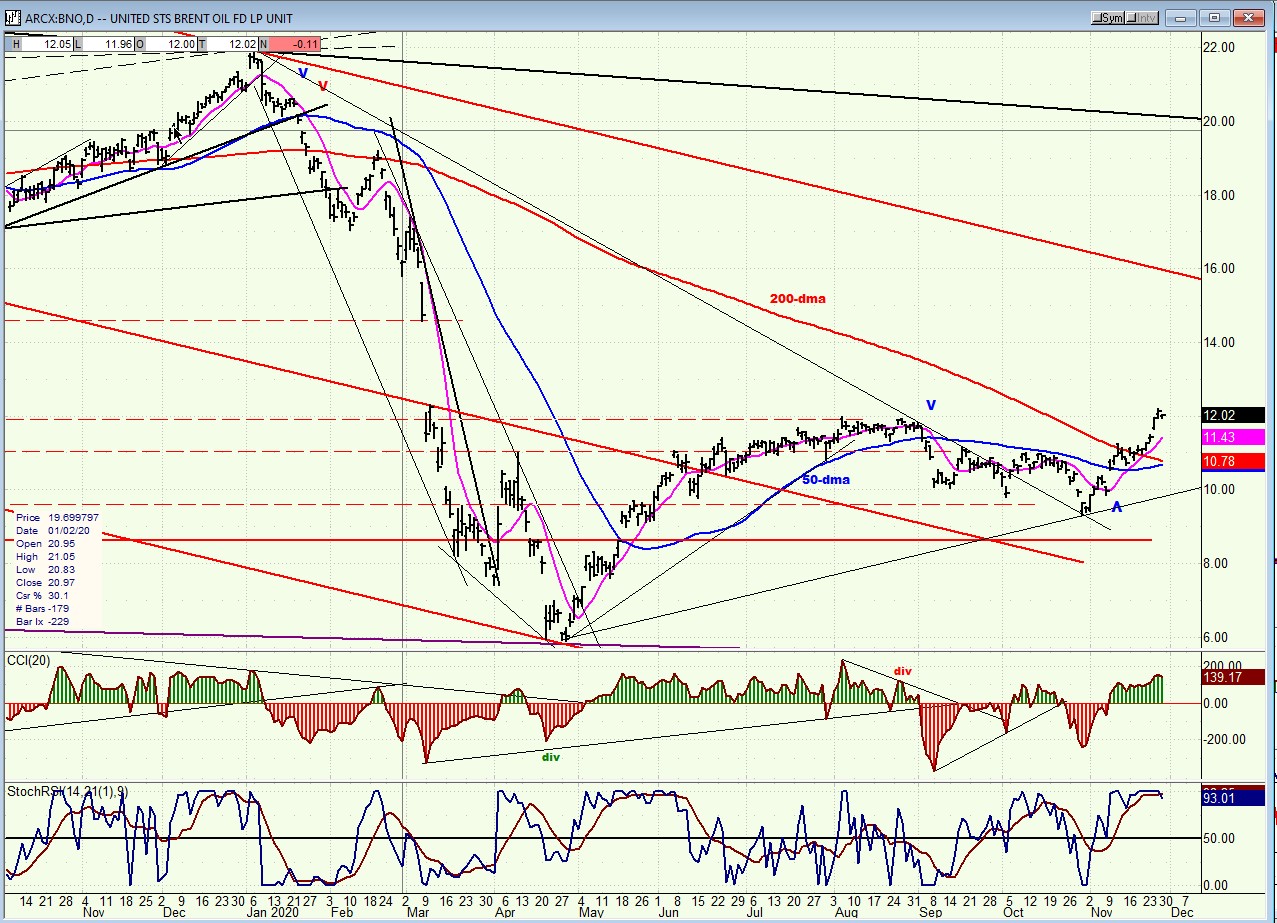
BNO (U.S. Brent Oil fund)
BNO has made a clean break-out above its moving averages and base but is ready for a consolidation after completing a five-wave uptrend.
SUMMARY
SPX started a new intermediate uptrend which was followed by a period of consolidation which has now lasted several weeks. It can either continue its uptrend from here or pull back before being ready for the next buy phase. We could know its decision by next week.
You may view our website at https://marketurningpoints.com
Free trial subscription
With a trial subscription, you will have access to the same information that is given to paid subscribers, but for a limited time-period. Over the years, I have developed an expertise in P&F charting (price projection), cycles (timing), EWT (structure), and general technical analysis which enables me to warn subscribers of pending reversals in market trends and how far that trend can potentially carry. For a FREE 2-week trial, subscription options and payment plans, I encourage you to visit my website at https://marketurningpoints.com
The above comments and those made in the daily updates and the Market Summary about the financial markets are based purely on what I consider to be sound technical analysis principles. They represent my own opinion and are not meant to be construed as trading or investment advice but are offered as an analytical point of view which might be of interest to those who follow stock market cycles and technical analysis.
********

When Andre Gratian was a stock broker years ago, a friend introduced him to technical analysis of the market. Consequently, it is not an exaggeration to say that Andre fell in love with this approach! Ever since then, it has become an increasingly important part of his professional life. Gratian has studied the works of Wyckoff, Edwards & Magee, Edward J. Dewey (cycles) and many others. However, one of my most profitable undertaking has probably been to study Point & Figure charting, which he finds invaluable in analyzing stocks and indices. If he were restricted to one methodology, this is the one that he would choose. This well-rounded background has given him what he feels to be a special insight into the stock market, facilitating the recognition of meaningful patterns and the ‘turning points’ in all trends, whether they be short or long term. Andre feels very comfortable discussing the stock market and passing on meaningful information to others. His subscribers include individuals and money managers throughout the world. Moreover, his Newsletters are currently published on several financial sites, here and abroad.


