Technical Analysis Of The Markets


Current Position of the Market
SPX Long-term trend: There is some good evidence that we are still in the bull market which started in 2009 and which could continue into the first quarter of 2021 before coming to an end.
SPX Intermediate trend: May continue until SPX recaches 4150 in February.
Analysis of the short-term trend is done daily with the help of hourly charts. They are important adjuncts to the analysis of daily and weekly charts which determine longer market trends.
Short-term Correction Underway
Cycles: Looking ahead! 90-yr cycle – last low: 1932. Next low: 2022
7-yr cycle – last low: 2016. Next low: 2023
Short-term low: 1/18-1/20
Market Analysis (Charts courtesy of QCharts
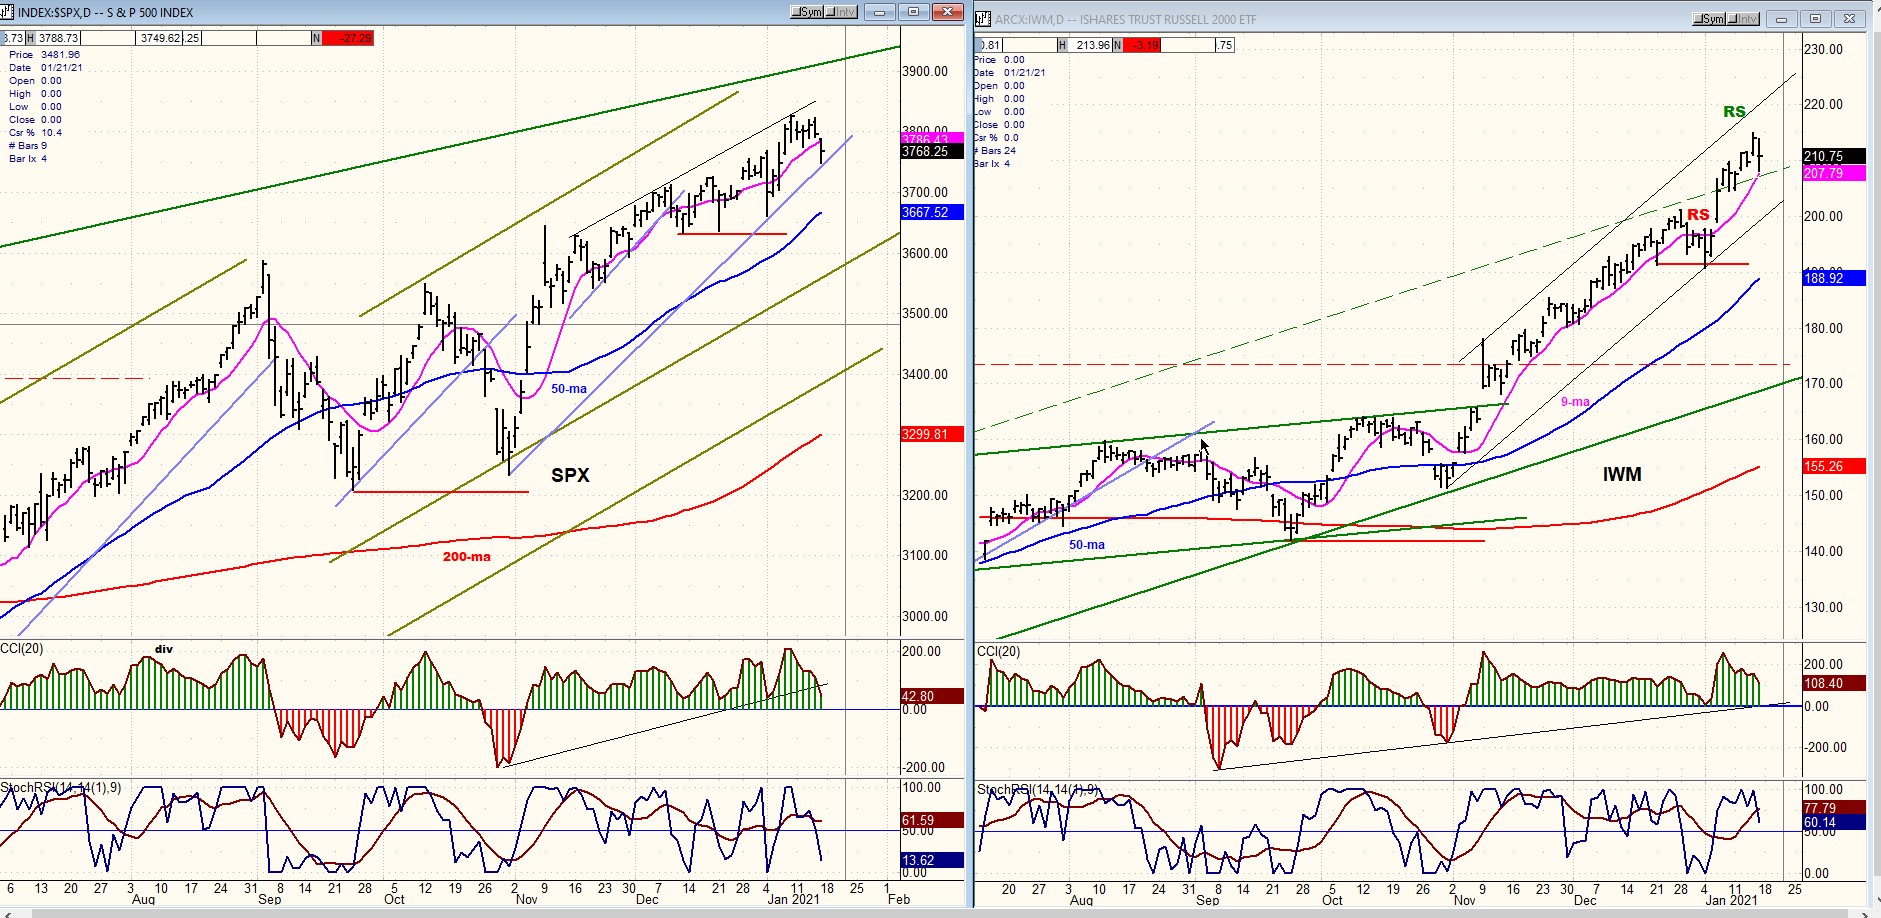
SPX-IWM daily charts
IWM did not give warning ahead of the ongoing correction which would suggest that it will only be a short-term affair.
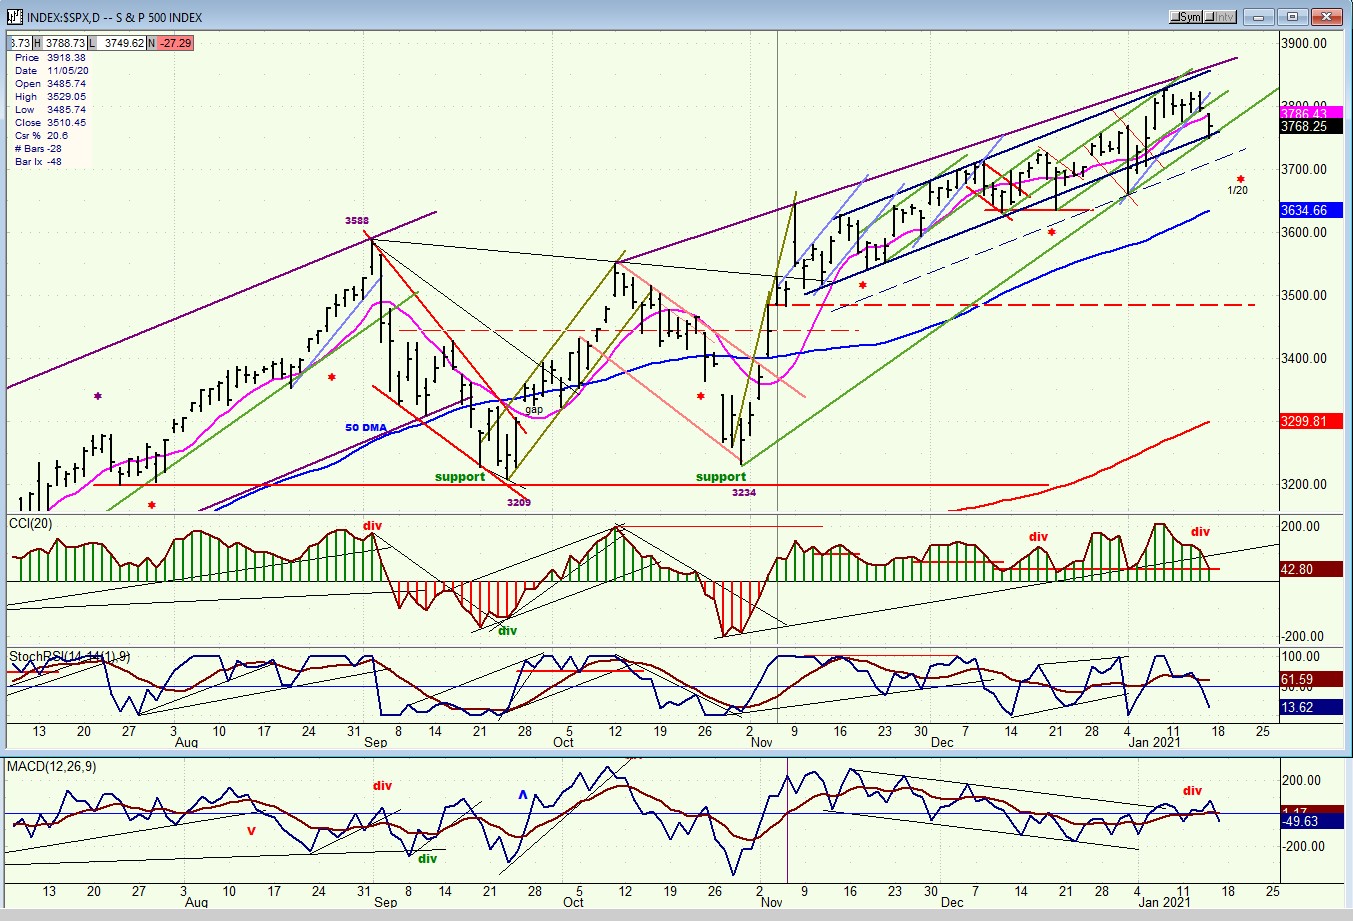
SPX daily chart
The SPX traded in a narrow range for six days after touching the top of its channel. This has created a congestion pattern twice that broad on the P&F chart, pointing to a potential short-term correction down to the 3690 level. This could come in two phases, both of which determined by the bottoming of two short-term cycles. The first is due to make its low on Tuesday or Wednesday of next week and may only take the index down to about 3730. After a short rebound, the index could then continue its correction into the end of the month when the next short-term cycle is due, reaching its full count of ~3690. If this projection is reached right away, we would probably see lower correction levels by the end of the month.
The short-term correction which got underway on Thursday has already retraced down to 3766 and, with the futures already leading the way after Friday’s close, should continue the decline to its initial objective of at least 3730.
The two lower oscillators have already become negative but the CCI -- always the laggard -- remains positive. If this were going to be a deep correction, it would become sharply negative, but this is not expected and, after retracing into the end of the month, the index is expected to turn up and lead the index to a new high.
The next short-term correction could come in mid-February.
SPX hourly chart
The short-term correction started by the index found initial support on a trend line and previous peak and bounced. But there should be more to it, at least into early next week when it is expected to drop to the bottom of the trading channel marked by one of the lower dashed lines as its next support. This would also put it in the vicinity of the 200-dma and achieve a partial downside projection which may complete in two separate phases with the second phase pushing into the end of the month. Currently, the P&F chart provides a count to 3690. If this is reached right away, it would mean that more congestion could form to send the index lower into the end of the month.
The hourly oscillators reached an oversold level on the first decline and bounced without giving a buy signal. By the time the next low takes place we could see positive divergence appear ahead of the first rally. This would not be expected to create a conclusive buy signal, with another pull-back to a lower level expected to take place after 1/25.

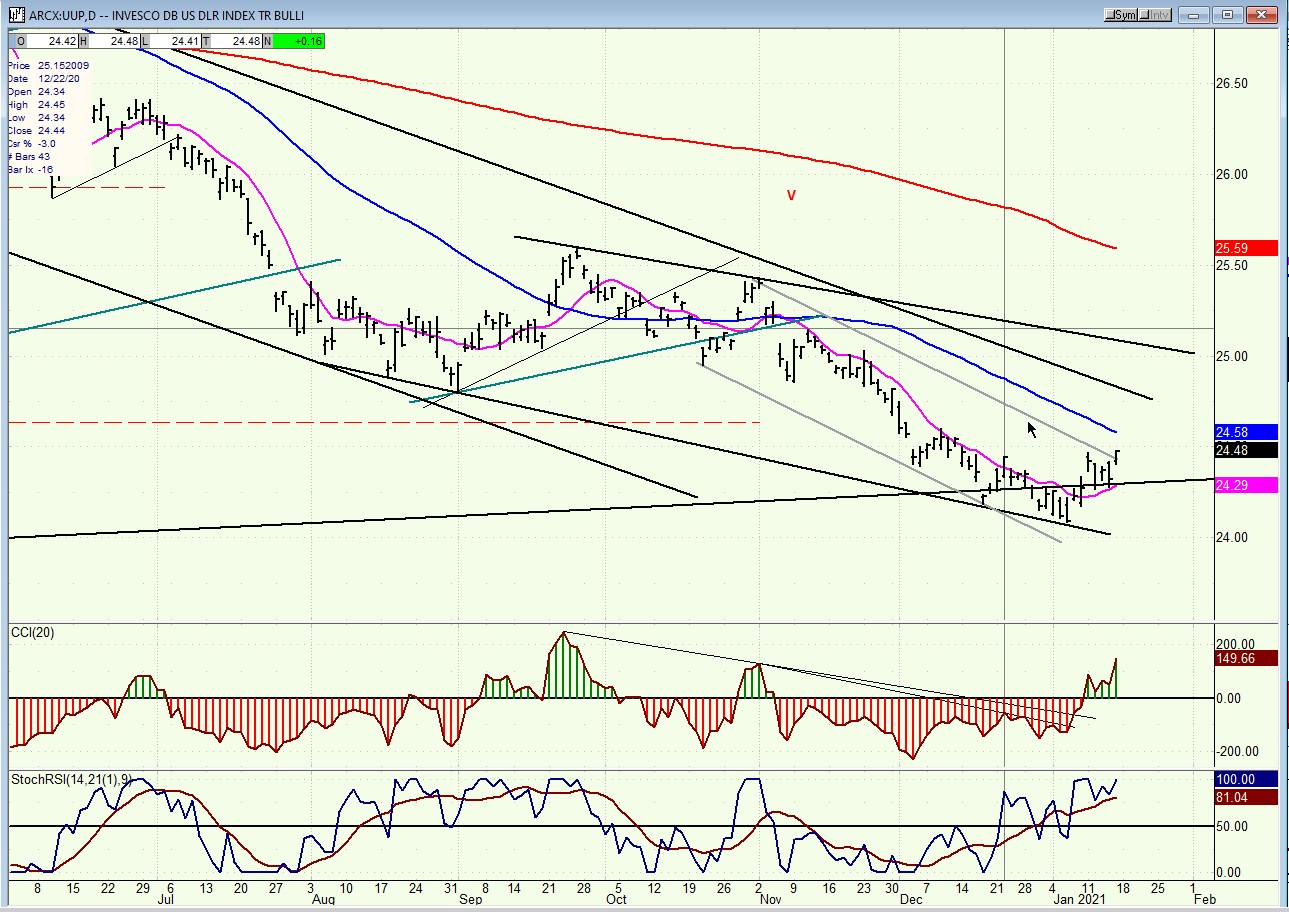
UUP (dollar ETF) WKLY ($USD chart not available from this data provider)
UUP continues to rally from its low, aiming first for the 50-dma which it should surpass, and then on to the top of the newly created channel which shows intermediate deceleration in the price.
GLD (gold)-WKLY
GLD is undergoing a correction after an attempt at breaking out of its corrective channel. It should find support at or near its 50-wk MA.

GDX (gold miners)-DLY
GDX has broken below the lower channel line and may continue to find sellers until it reaches 32.50-33.50 before completing its correction and being posed to resume its uptrend.

SIL (silver)-WKLY
I have been pointing to SIL’s relative strength to GLD for several weeks, but the former is now becoming more in gear with the latter and is expected to continue to correct until it finds support in the proximity of the two dashed lines.

PAAS (Pan American Silver Corp-DLY)
PAAS is also undergoing a sharp corrective retracement which should take it another point or two lower before it finds support and prepares for its next uptrend.

BNO (U.S. Brent Oil fund)
BNO has reached its 14.00 projection and is beginning to pull back. It should now undergo some additional consolidation before resuming its uptrend toward 16.00.

SUMMARY
SPX is undergoing a short-term correction most likely consisting of two phases with the first one ending Tuesday or Wednesday around 3730, although it may push down to 3690 right away. This should be followed by a rebound and another decline into the end of the month.
Free trial subscription
With a trial subscription, you will have access to the same information that is given to paid subscribers, but for a limited time-period. Over the years, I have developed an expertise in P&F charting (price projection), cycles (timing), EWT (structure), and general technical analysis which enables me to warn subscribers of pending reversals in market trends and how far that trend can potentially carry. For a FREE 2-week trial, subscription options and payment plans, I encourage you to visit my website at www.marketurningpoints.com.
The above comments and those made in the daily updates and the Market Summary about the financial markets are based purely on what I consider to be sound technical analysis principles. They represent my own opinion and are not meant to be construed as trading or investment advice but are offered as an analytical point of view which might be of interest to those who follow stock market cycles and technical analysis.
********

When Andre Gratian was a stock broker years ago, a friend introduced him to technical analysis of the market. Consequently, it is not an exaggeration to say that Andre fell in love with this approach! Ever since then, it has become an increasingly important part of his professional life. Gratian has studied the works of Wyckoff, Edwards & Magee, Edward J. Dewey (cycles) and many others. However, one of my most profitable undertaking has probably been to study Point & Figure charting, which he finds invaluable in analyzing stocks and indices. If he were restricted to one methodology, this is the one that he would choose. This well-rounded background has given him what he feels to be a special insight into the stock market, facilitating the recognition of meaningful patterns and the ‘turning points’ in all trends, whether they be short or long term. Andre feels very comfortable discussing the stock market and passing on meaningful information to others. His subscribers include individuals and money managers throughout the world. Moreover, his Newsletters are currently published on several financial sites, here and abroad.


