Technical Analysis Of The Markets


Gold
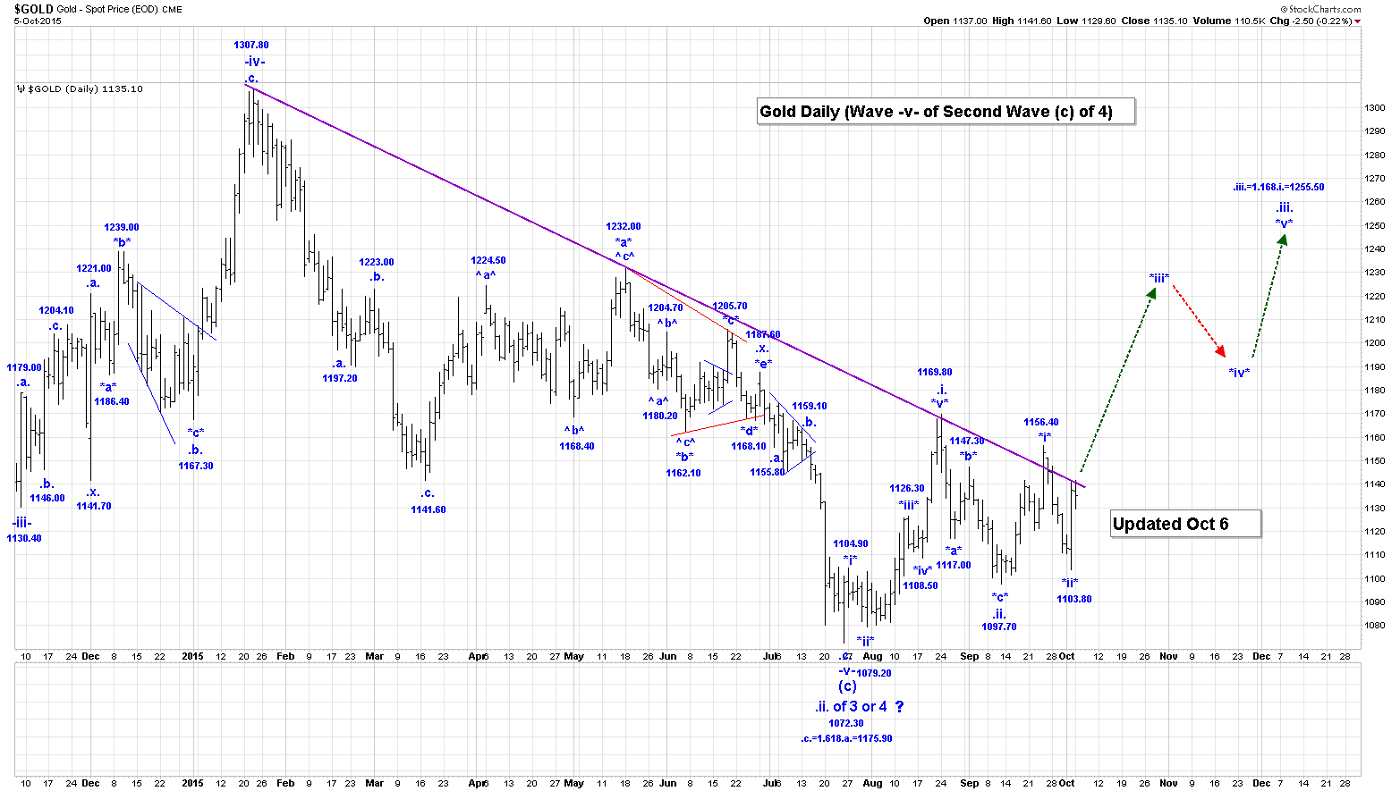
Gold was stable in the overnight session, being range bound between 1141.60 and 1129.60. Our current thinking remains unchanged with wave ^i^ of *iii* ending at 1141.50, and the current trading being wave ^ii^.
If we are correcting in wave ^ii^, then our expected retracements are:
50% = 1122.70
61.8% = 1118.20.
Note that markets do not need to retrace to the levels that we suggest for waves ^ii^ and ^iv^ It is possible that all of wave ^ii^ ended at 1129.60, but that would be little short of our 50% retracement level.
A clear break above our purple downtrend line will see gold rally sharply and a significant break of the 1141.50 high now would suggest to us that wave ^ii^ is likely over at the 1129.60 low!
Our current count for all of wave .iii. is:
*i* = 1156.40;
*ii* = 1103.80;
*iii*:
^i^ = 1141.50;
^ii^ is underway.
Projections for the end of wave *iii* are:
*iii* = 1.618*i* = 1198.80;
*iii* = 2.618*i* = 1257.50
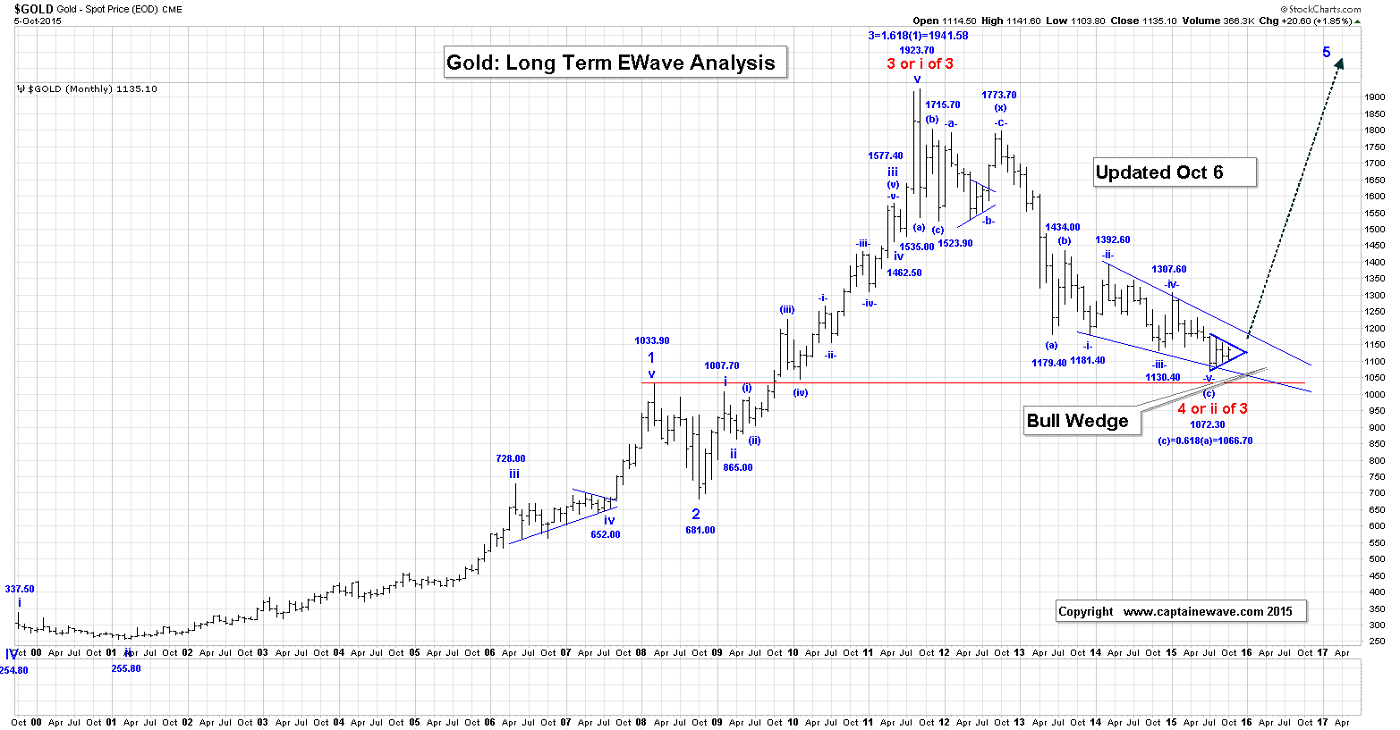
Gold has begun to rise up within its truly majestic bull wedge pattern. This wedge, and some as yet unknown fundamental event appear poised to launch our glorious C wave, to new highs for gold!
We are long 20 positions, risking to 1197!
CRUDE OIL
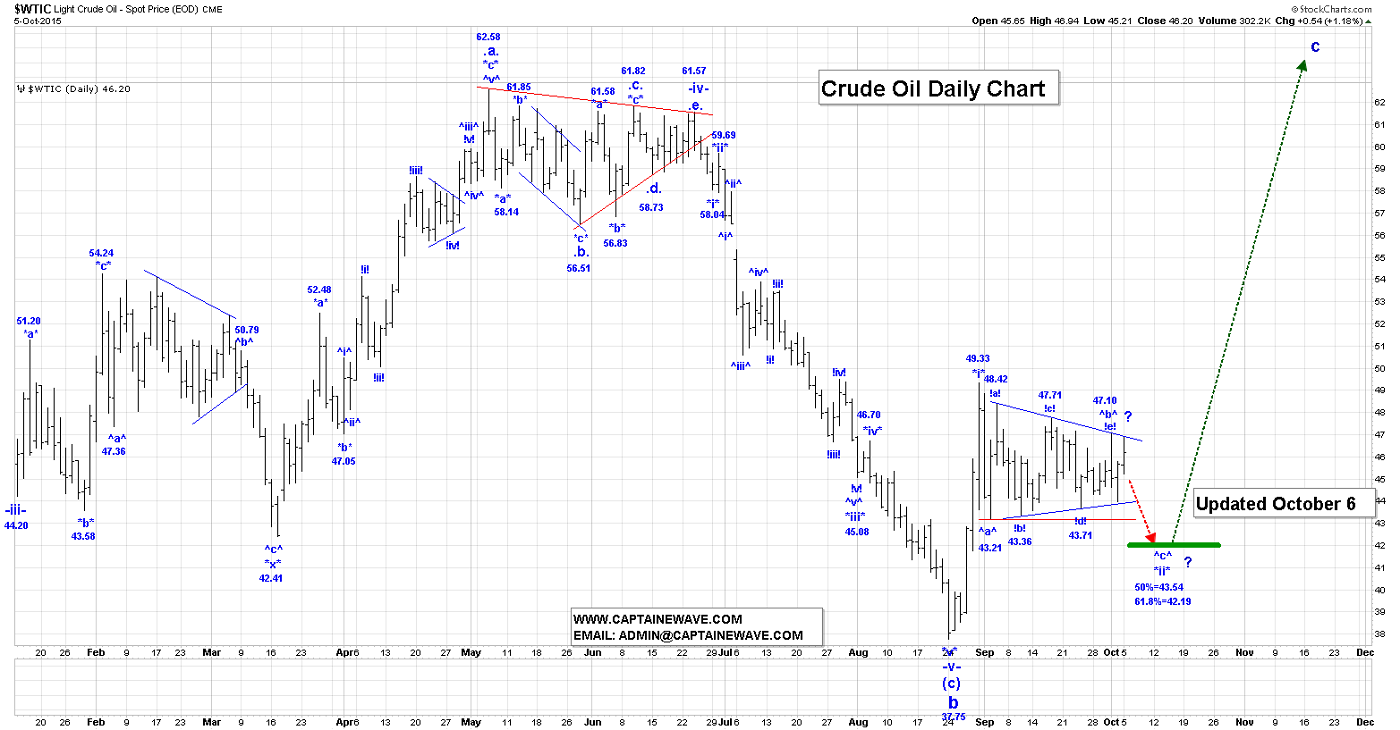
Crude was pretty quiet, in the overnight session. If we are working on a wave !e! triangle, then it looks like:
$a$ = 47.08;
$b$ = 44.00
$c$ = 46.91, if complete and we cannot trade above the 47.08 high for this triangle formation to remain valid.
$d$ drop is next
$e$ rally to go, to complete all of wave !e!.
Our preferred current wave *ii* count has now become the one that includes the wave !e! triangle option as follows:
^a^ = 43.21;
^b^ triangle:
!a! = 48.42;
!b! = 43.36;
!c! = 47.71;
!d! = 43.73;
!e! triangle is still underway.
As we have seen many times, the above wave ^b^ triangle count can extend further, if we continue to rally now above the 47.71 high.
We expect the end of wave ^c^ and all of wave *ii* would end within the following retracement levels:
50% = 43.54;
61.8% = 42.19.
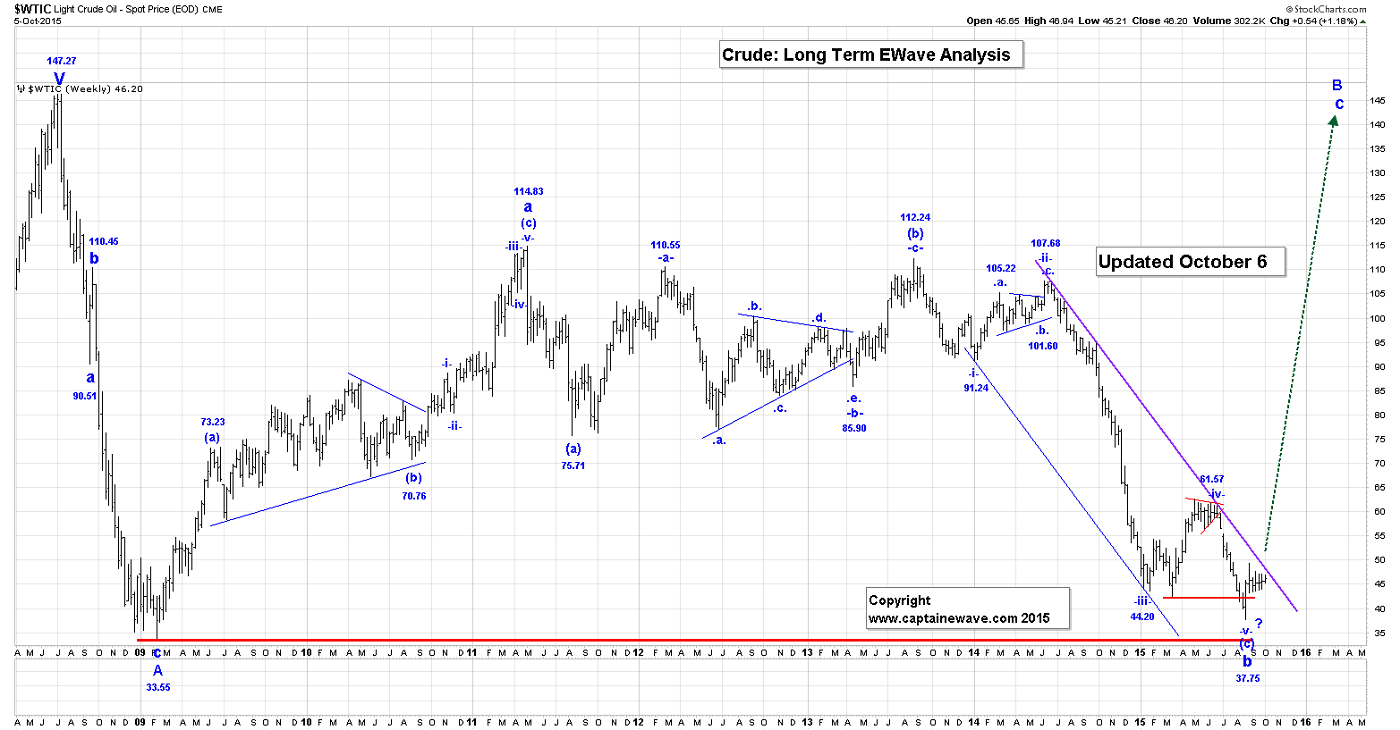
That’s a longer term crude chart. We are working on the assumption that wave b ended at 37.75, and that the current rally is the start of a multi-year wave c.
With that assumption in mind we have wave *i* ending at 49.33 and we are now working on wave *ii*.
If crude was to thrust higher out of this triangle then we would have 3 wave rally from the 37.75, which would suggest that the 37.75 low is NOT the end of wave b. We will provide more details on this, if it happens. The bottom line:
We plan to go long 8 positions at 43.20, and buy 42.00 puts, as stops!
SP500
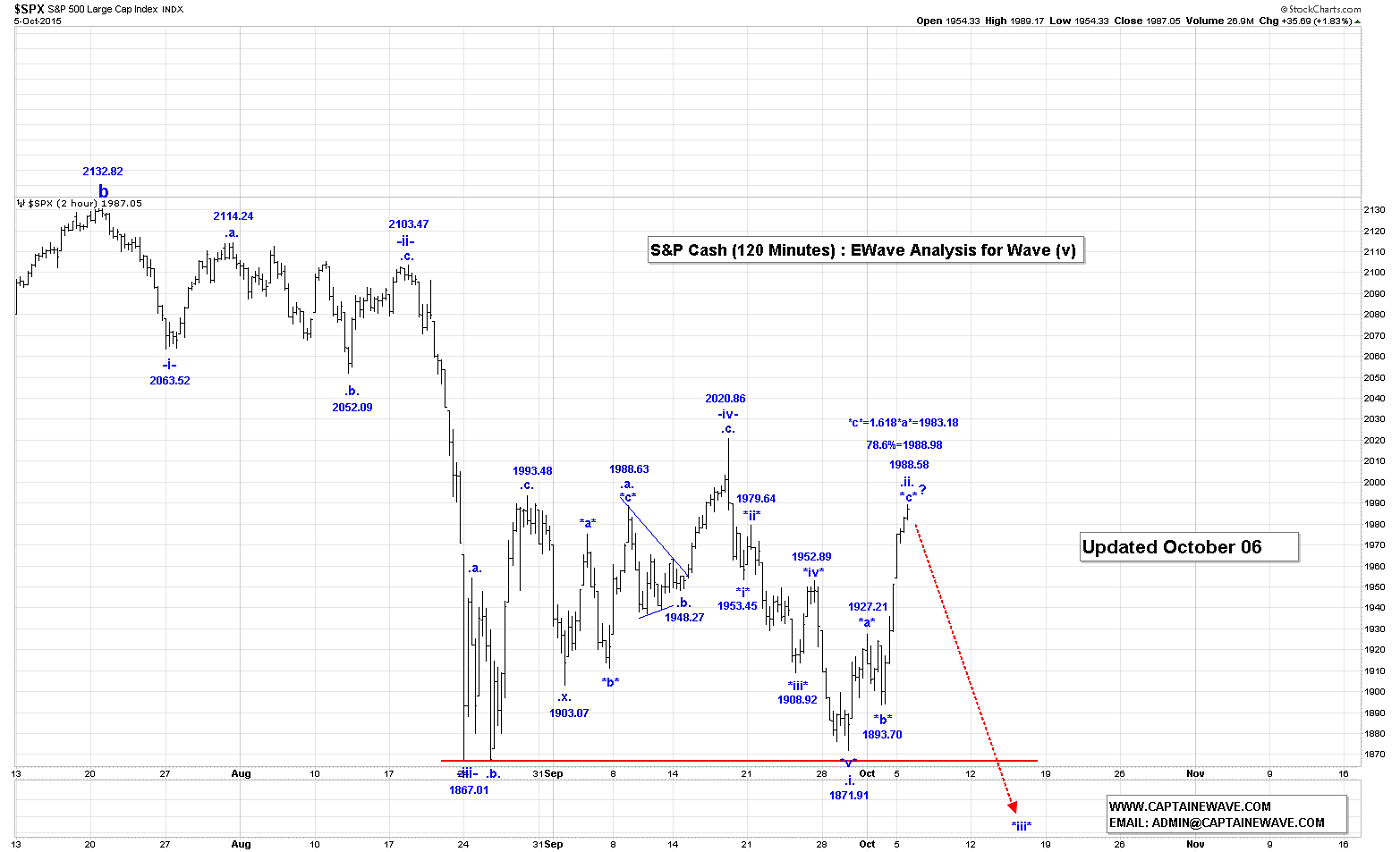
We believe that have completed all or most of wave .ii. of -v-, as the attached 120 Min Chart indicates. We traded above our 61.8% retracement zone, and have now reached our 78.6% retracement zone which is 1988.98.
We would not want to S&P to trade much higher, for our current analysis to remain valid.
The other option we need to consider now for wave -iv- is that it did NOT end at 2020.86 and is becoming instead a triangle which would look like:
*a* = 2020.86;
*b* = 1871.91;
*c* = 1988.58, if complete
*d* and *e* leg to go to complete all of the wave -iv- triangle.
Our preferred count for wave .i. and wave .ii. is follows:
.i.:
*i* = 1953.45;
*ii* = 1979.64;
*iii* = 1908.92;
*iv* = 1952.89;
*v* = 1871.91 to complete all of wave .i..
.ii.:
*a* = 1952.89;
*b* = 1893.70;
*c* = 1988.58, if complete to complete all of wave .ii.
.iii. drop is next.
We will provide updated projections for the end of wave .iii., once we have confirmed the location of wave .ii.
If wave -iv- becomes a triangle then our very bearish case will be eliminated, as we cannot have a triangle on its own in the wave .ii position.
We are short 15 positions with 1975 calls!
USDX
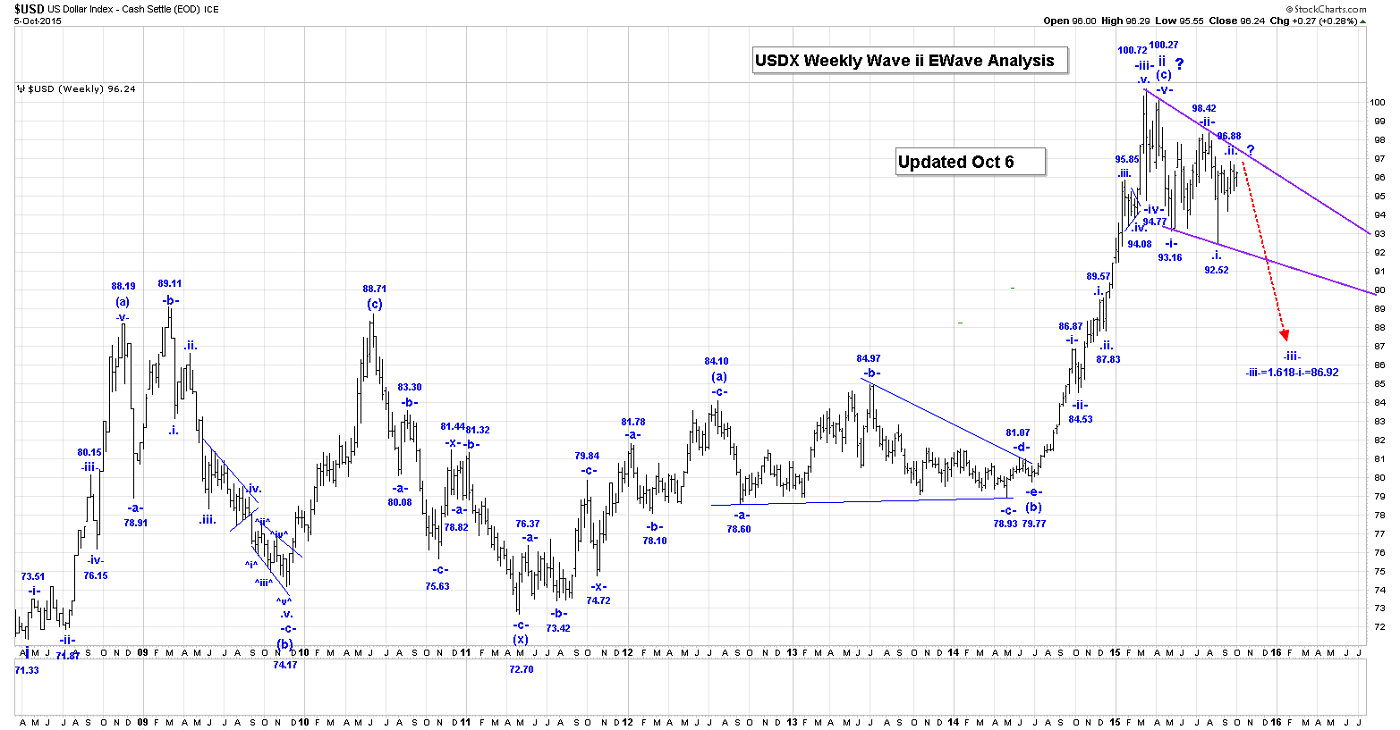
On the Intraday Chart, we have a clear 3 wave rally from 95.58 to 96.29.
This is bearish and suggests that as a minimum the USDX is heading back to the 95.58 low.
We are still working on the assumption that wave .ii. ended at 96.88, but the choppy state of this market does not give us the confidence to trade it, at the moment.
Our current preferred count remains unchanged as follows:
-i- = 93.16;
-ii- = 98.42;
-iii-:
.i. = 92.52;
.ii. = 96.88, if complete to complete all of wave .ii.
.iii. drop will be next.
Unfortunately we have another option in the above bearish count that we cannot discount and it looks like this:
-i- = 93.16;
-ii-:
.a. = 97.88;
.b. = 93.30;
.c. = 98.42;
.x. = 92.52;
.a. = 96.64;
.b. = 94.19;
.c rally is now to at least the 98.42 high to complete all of wave -ii-.
The bullish count is that wave -iv- ended at 92.52 and we are now rallying in wave -v- to at least the wave -iii- high of 100.72 to complete all of wave ii.
We are flat, with no USDX positions!
NATGAS
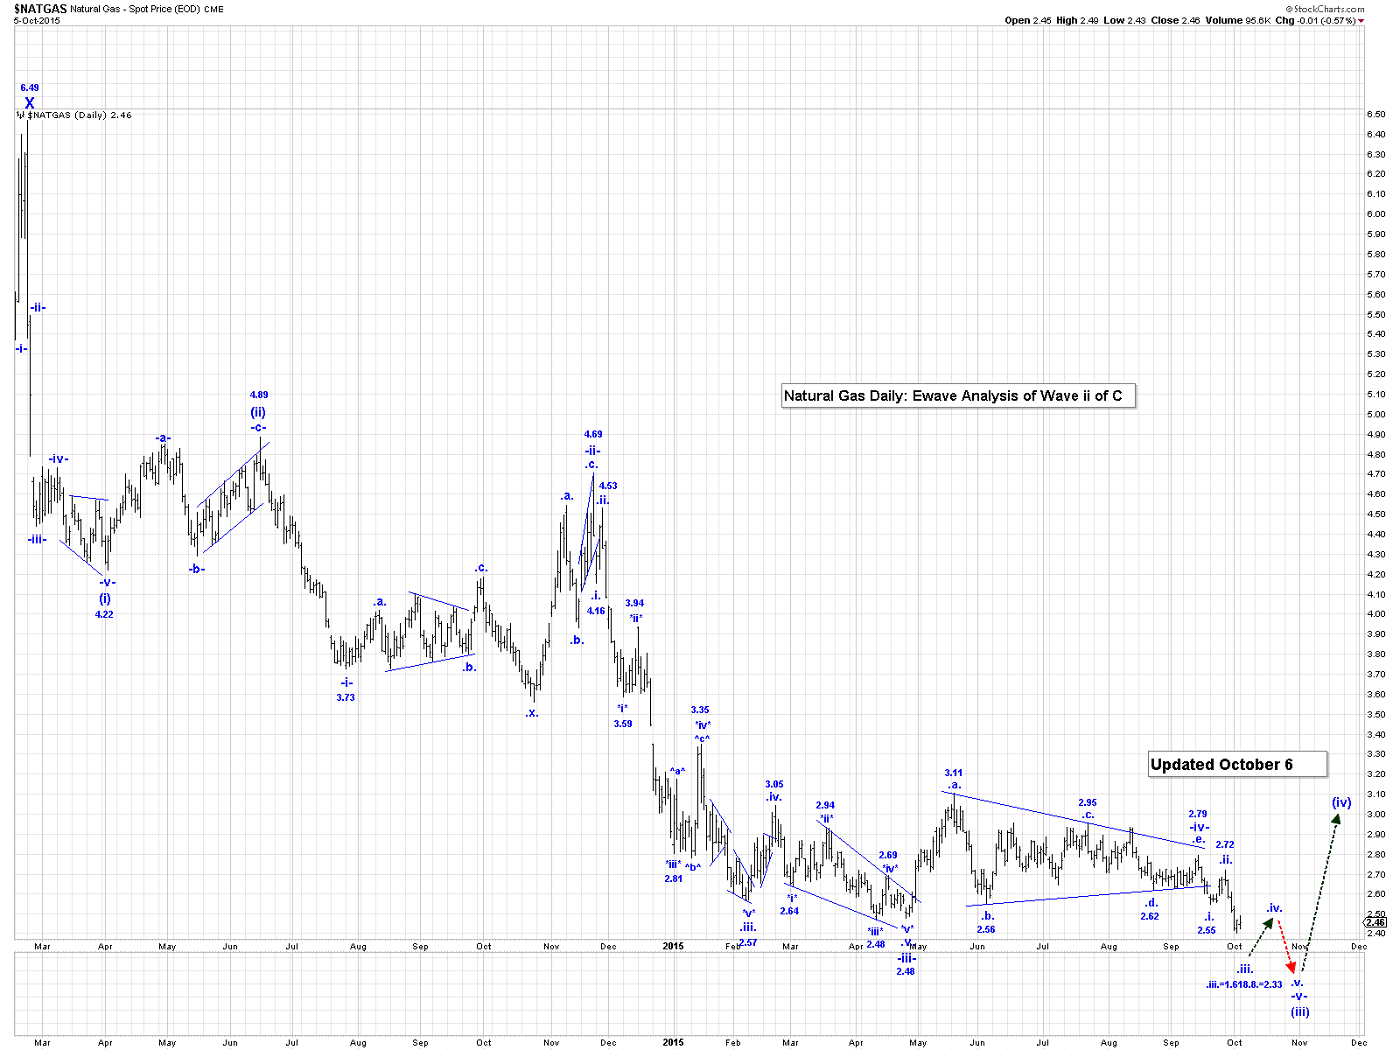
The small rally from 2.403 to 2.491 looks corrective, on the Intraday Chart, which suggests that we are going to drop back to the 2.401 low, when this correction ends. In the overnight session NG was stable like gold and crude.
We are also flat this market, although we will note that our longer term analysis suggests the approaching winter season could bring a significant rally!
HUI/GDX/XAU

A breakout in gold bullion above the purple down trend line we highlighted in our first chart should see the GDX rally sharply.
Remember that this is a vastly oversold market and we should not be surprised to see many gold stocks double in triple in value over the next couple of weeks.
Next target for this market is 16.16.
Our current count is :
-i- = 14.71;
-ii- = 13.19;
-iii- is now underway with the following projections:
-iii- = 1.618-i- = 16.57
-iii- = 2.618-i- = 18.66.
It is still not too late to add to existing gold stock and/or index positions on the long side!
Since the GDX is so undervalued next to gold we think that wave .iii. in the GDX could reach the 22.08 to 26.29 levels.
We are long GDX, ABX, KGC, NEM, CRJ, and TSX:XGD… with no stops!
********
Email: [email protected]
Website: www.captainewave.com
Risk: CAPTAINEWAVE.COM IS AN IMPERSONAL ADVISORY SERVICE. AND THEREFORE, NO CONSIDERATION CAN OR IS MADE TOWARD YOUR FINANCIAL CIRCUMSTANCES. ALL MATERIAL PRESENTED WITHIN CAPTAINEWAVE.COM IS NOT TO BE REGARDED AS INVESTMENT ADVICE, BUT FOR GENERAL INFORMATIONAL PURPOSES ONLY. TRADING STOCKS DOES INVOLVE RISK, SO CAUTION MUST ALWAYS BE UTILIZED. WE CANNOT GUARANTEE PROFITS OR FREEDOM FROM LOSS. YOU ASSUME THE ENTIRE COST AND RISK OF ANY TRADING YOU CHOOSE TO UNDERTAKE. YOU ALSO AGREE TO BEAR COMPLETE RESPONSIBILITY FOR YOUR INVESTMENT RESEARCH AND DECISIONS AND ACKNOWLEDGE THAT CAPTAINEWAVE.COM HAS NOT AND WILL NOT MAKE ANY SPECIFIC RECOMMENDATIONS OR GIVE ADVICE TO YOU OR ANY OF ITS CLIENTS UPON WHICH THEY SHOULD RELY. CAPTAINEWAVE.COM SUGGESTS THAT THE CLIENT/MEMBER TEST ALL INFORMATION AND TRADING METHODOLOGIES PROVIDED AT OUR SITE THROUGH PAPER TRADING OR SOME OTHER FORM OF TESTING. CAPTAINEWAVE.COM, ITS OWNERS, OR ITS REPRESENTATIVES ARE NOT REGISTERED AS SECURITIES BROKER-DEALERS OR INVESTMENT ADVISORS EITHER WITH THE U.S. SECURITIES AND EXCHANGE COMMISSION OR WITH ANY STATE SECURITIES REGULATORY AUTHORITY. WE RECOMMEND CONSULTING WITH A REGISTERED INVESTMENT ADVISOR, BROKER-DEALER, AND/OR FINANCIAL ADVISOR. IF YOU CHOOSE TO INVEST WITH OR WITHOUT SEEKING ADVICE FROM SUCH AN ADVISOR OR ENTITY, THEN ANY CONSEQUENCES RESULTING FROM YOUR INVESTMENTS ARE YOUR SOLE RESPONSIBILITY.
ALL INFORMATION POSTED IS BELIEVED TO COME FROM RELIABLE SOURCES. CAPTAINEWAVE.COM DOES NOT WARRANT THE ACCURACY, CORRECTNESS, OR COMPLETENESS OF INFORMATION AVAILABLE FROM ITS SERVICE AND THEREFORE WILL NOT BE LIABLE FOR ANY LOSS INCURRED. DUE TO THE ELECTRONIC NATURE OF THE INTERNET, THE CAPTAINEWAVE.COM WEBSITE, ITS E-MAIL & DISTRIBUTION SERVICES AND ANY OTHER SUCH "ALERTS" COULD FAIL AT ANY GIVEN TIME. CAPTAINEWAVE.COM WILL NOT BE RESPONSIBLE FOR UNAVAILABILITY OF USE OF ITS WEBSITE, NOR UNDELIVERED E-MAILS, OR "ALERTS" DUE TO INTERNET BANDWIDTH PROBLEMS, EQUIPMENT FAILURE, OR ACTS OF GOD. CAPTAINEWAVE.COM DOES NOT WARRANT THAT THE TRANSMISSION OF E-MAILS, OR ANY "ALERT" WILL BE UNINTERRUPTED OR ERROR-FREE. CAPTAINEWAVE.COM WILL NOT BE LIABLE FOR THE ACTS OR OMISSIONS OF ANY THIRD PARTY WITH REGARDS TO CAPTAINEWAVE.COM DELAY OR NON-DELIVERY OF THE CAPTAINEWAVE.COM NIGHTLY EMAILS OR "ALERTS". FURTHER, WE DO NOT RECEIVE ANY FORM OF PAYMENT OR OTHER COMPENSATION FOR PUBLISHING INFORMATION, NEWS, RESEARCH OR ANY OTHER MATERIAL CONCERNING ANY SECURITIES ON OUR SITE OR PUBLISH ANY INFORMATION ON OUR SITE THAT IS INTENDED TO AFFECT OR INFLUENCE THE VALUE OF SECURITIES.
THERE IS NO GUARANTEE PAST PERFORMANCE WILL BE INDICATIVE OF FUTURE RESULTS. NO ASSURANCE CAN BE GIVEN THAT THE RECOMMENDATIONS OF CAPTAINEWAVE.COM WILL BE PROFITABLE OR WILL NOT BE SUBJECT TO LOSSES. ALL CLIENTS SHOULD UNDERSTAND THAT THE RESULTS OF A PARTICULAR PERIOD WILL NOT NECESSARILY BE INDICATIVE OF RESULTS IN FUTURE PERIODS. THE RESULTS LISTED AT THIS WEBSITE ARE BASED ON HYPOTHETICAL TRADES. PLAINLY SPEAKING, THESE TRADES WERE NOT ACTUALLY EXECUTED. HYPOTHETICAL OR SIMULATED PERFORMANCE RESULTS HAVE CERTAIN INHERENT LIMITATIONS. UNLIKE AN ACTUAL PERFORMANCE RECORD, SIMULATED TRADES DO NOT REPRESENT ACTUAL TRADING. ALSO, SINCE THE TRADES HAVE NOT ACTUALLY BEEN EXECUTED, THE RESULTS MAY HAVE OVER OR UNDER COMPENSATED FOR THE IMPACT, IF ANY, OF CERTAIN MARKET FACTORS SUCH AS LACK OF LIQUIDITY. YOU MAY HAVE DONE BETTER OR WORSE THAN THE RESULTS PORTRAYED. NO REPRESENTATION IS BEING MADE THAT ANY ACCOUNT WILL OR IS LIKELY TO ACHIEVE PROFITS OR LOSSES SIMILAR TO THOSE SHOWN. NO INDEPENDENT PARTY HAS AUDITED THE HYPOTHETICAL PERFORMANCE CONTAINED AT THIS WEBSITE, NOR HAS ANY INDEPENDENT PARTY UNDERTAKEN TO CONFIRM THAT THEY REFLECT THE TRADING METHOD UNDER THE ASSUMPTIONS OR CONDITIONS SPECIFIED HEREAFTER. WHILE THE RESULTS PRESENTED AT THIS WEBSITE ARE BASED UPON CERTAIN ASSUMPTIONS BELIEVED TO REFLECT ACTUAL TRADING CONDITIONS, THESE ASSUMPTIONS MAY NOT INCLUDE ALL VARIABLES THAT WILL AFFECT, OR HAVE IN THE PAST AFFECTED, THE EXECUTION OF TRADES INDICATED BY CAPTAINEWAVE.COM. THE HYPOTHETICAL RESULTS ON THIS WEBSITE ARE BASED ON THE ASSUMPTION THAT THE CLIENT BUY AND SELLS THE POSITIONS AT THE OPEN PRICE OF THE STOCK. THE SIMULATION ASSUMES PURCHASE AND SALE PRICES BELIEVED TO BE ATTAINABLE. IN ACTUAL TRADING, PRICES RECEIVED MAY OR MAY NOT BE THE SAME AS THE ASSUMED ORDER PRICES.


