Technical Analysis Of The Markets


Gold
Short-Term Update
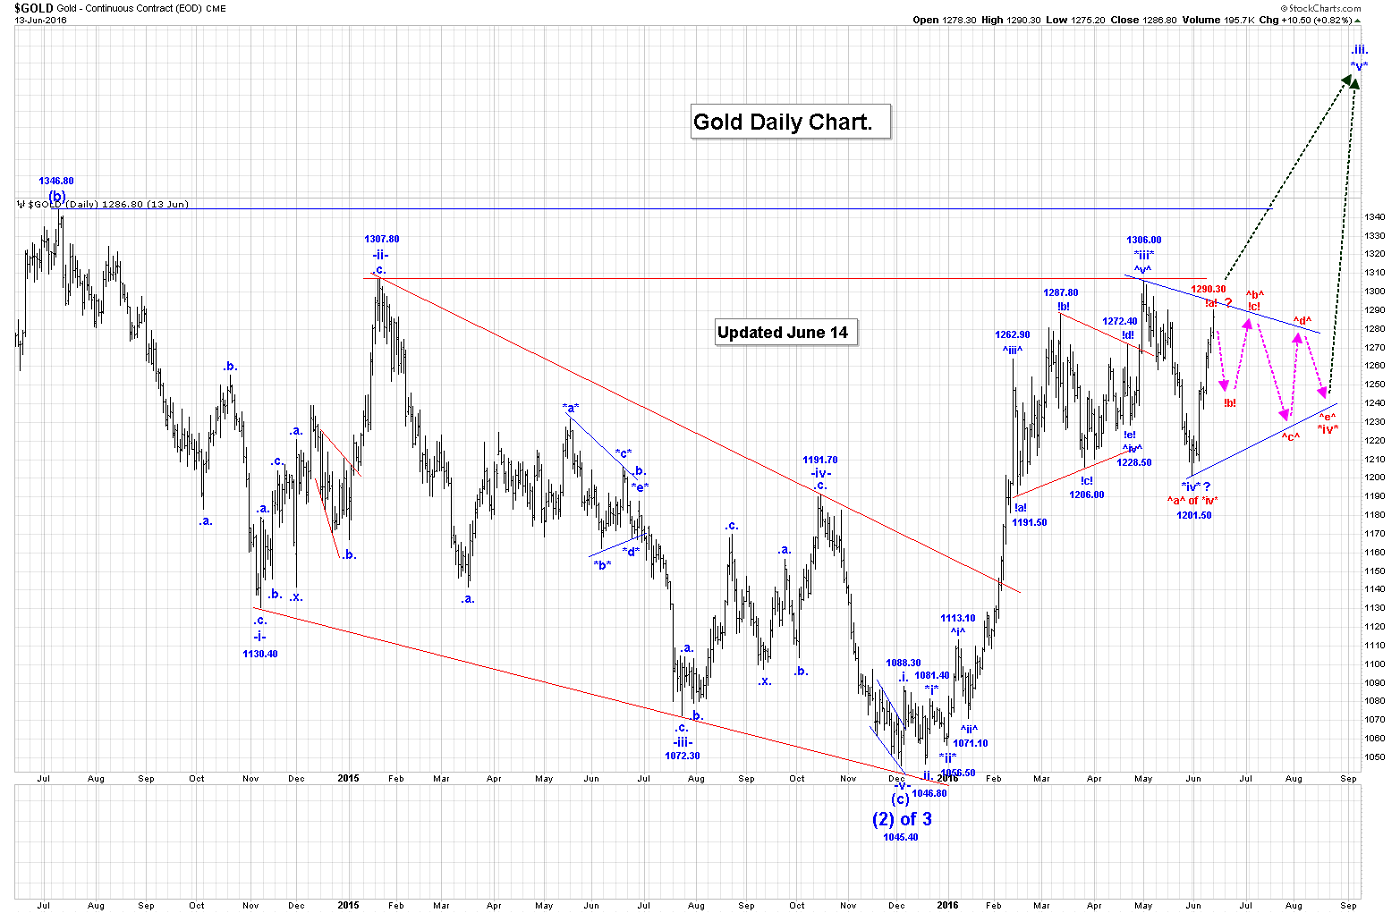
Gold reached a low of 1279 in the overnight session, but then recovered to the 1286 level (when time this post was being written).
We are due for a small correction.
On the Intraday Chart the drop from 1290 to the current low of 1279 does look corrective, so we should challenge the 1290 high again.
We suspect after that happens, a small correction might transpire.
Either all of wave *iv* is complete at the 1201.80 low, or wave *iv* is becoming a bullish triangle. These options are shown on the Daily Gold Chart. If wave *iv* is complete at the 1201.80 low then we are now rallying in wave *v*, which has the following count:
^i^ = 1290.10, if complete;
^ii^ correction is next which should retrace between 50 to 61.8% of the wave ^i^ rally. We will provide those retracement levels when we are sure that wave ^i^ is complete.
^iii^ is next after wave ^ii^ ends.
In the case of the bullish wave *iv* triangle option, out count would be:
^a^ = 1201.80;
^b^:
!a! = 1290.10;
!b! drop is next, after wave !a! ends;
!c! rally to complete all of wave ^b^. In this case of wave ^b^ can rally above the current wave *iii* high of 1306.00. This triangle will likely take a month or so to develop. Wave ^b^ will have at least one 3 wave pattern within its structure. We have shown the potential path for this wave *iv* triangle with the pink arrows on the Daily Gold Chart.
Longer-Term Update
Based on the current count, gold is still working on its first impulsive sequence out of its wave (2) of 3 low, and we still have a little way to before this sequence is complete.
We are thinking that all of wave .iii. in our current gold count is going to end at the red trend line shown in our previously attached Long Term Gold Chart.
The location of that intersection is looking like it could be in the $1340/$1360 area, depending on long it takes for gold to get there.
Active Trading Positions: Long 20 positions, with protective put options at 1250.00!
Crude
Short-Term Update

Crude reached a new low for its current correction reaching 48.02 in the overnight session, at the time that this Post was being written. We continue to work on our expected wave ^iv^ correction.
As a minimum we are expecting wave ^iv^ to have a 3 wave structure, but it could also become a bullish triangle. If wave ^iv^ is becoming a 3 wave correction, then we are likely getting close to the completion of wave !a! of ^iv^.
Upon completion of wave !a!, we expect a wave !b! rally that should retrace between 50 to 61.% of the entire wave !a! drop.
Upon completion of wave !b! we would expect a final drop in wave !c! to complete all of wave ^iv^.
We have shown our expected path for our possible 3 wave correction on the Daily Crude Chart. Wave ^iv^ could also become more complex than just a simple 3 wave pattern, however.
Wave ^iv^ may take a couple of weeks to unfold, especially if it becomes a bullish triangle. Our retracement levels for all of wave ^iv^ are:
23.6% = 48.68;
38.2% = 46.83.
Our current count, from the wave b low of 26.05 is:
^i^ = 43.69;
^ii^ = 39.00;
^iii^:
!i! = 46.78;
!ii! = 43.04;
!iii! = 49.56;
!iv! =49.12;
!v! = 51.67, to complete all of wave ^iii^;
^iv^:
!a! = 48.16, if complete;
!b! rally is likely underway now.
Our first projection for the end of wave *iii* is:
*iii* = 1.618*i* = 61.84.
Long-Term Update
We are now working on the assumption that a major low in wave b of B was reached at the 26.05 low. If this assumption is correct, then crude is now heading sharply higher, at least back to the all-time high of 147.27.
Active Trading Positions: We will go long Suncor stock at 23.75.
S&P500
Short-Term Update
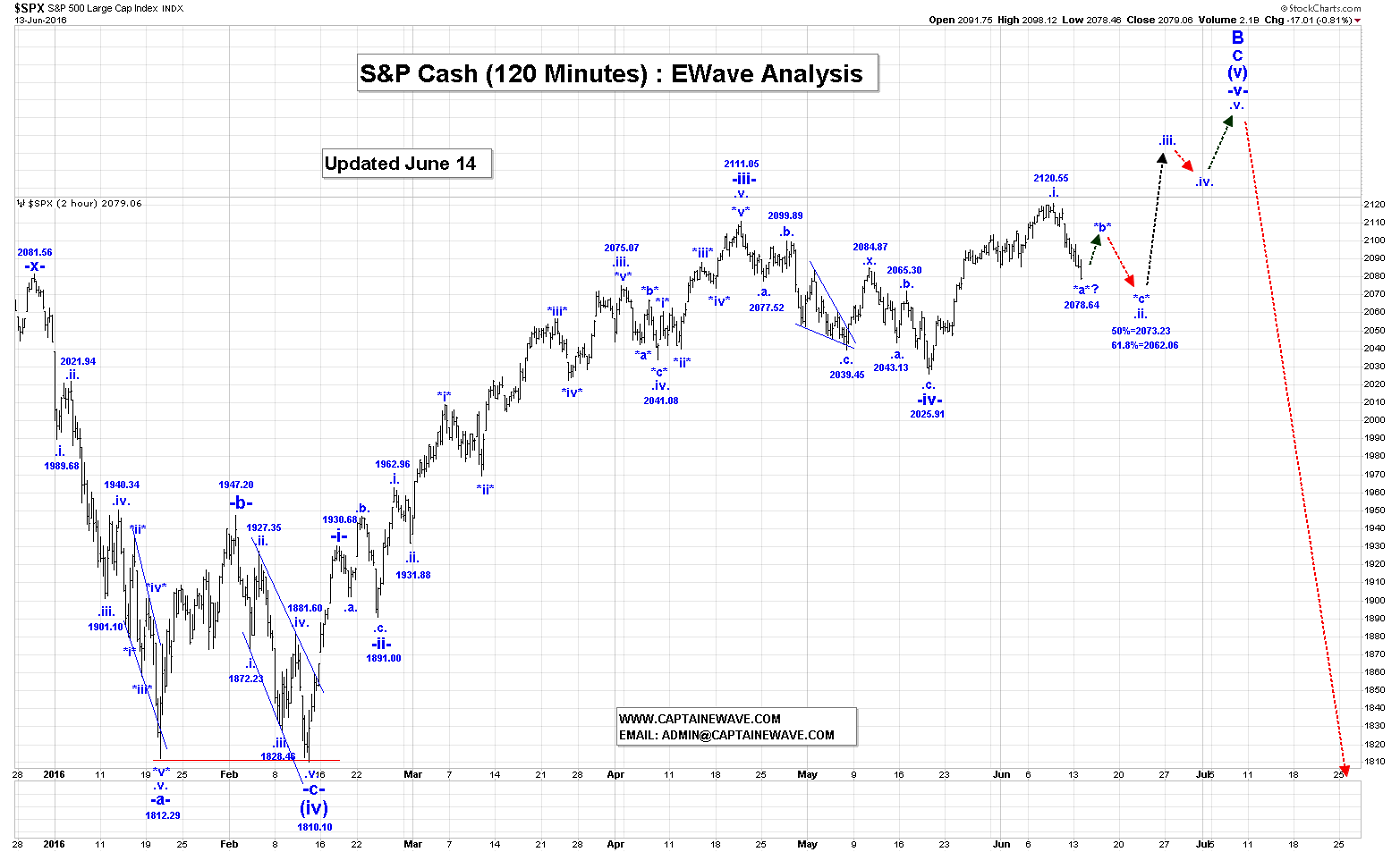
In the overnight session the S&P Futures are down about 6 points, ta the time that this Post was being written.
We should have either completed all or most of wave *a* at the 2078.64 low, and we should therefore expect a wave *b* rally as the next big event as shown on the attached 120 Min S&P Chart.
We are waiting for confirmation that all of wave *a* is complete at the 2078.64 low. Upon completion of wave *b* we expect another drop in wave *c* to complete all of wave .ii. We expect wave .ii. to end within our 50 to 61.8% retracement zone. Those retracements are:
50% = 2073.23;
61.8% = 2062.06.
We may consider going long at 2068.00 also so that we can capture all of our expected wave .iii. rally higher.
Long-Term Update
Wave -i- of (v) is complete at the 1946.70 high; wave -ii- at 1891.00, and wave -iii- at 2111.05. Wave -iv- is now complete at the 2025.91 low and we have started our wave -v- rally to all time new highs. Our minimum target for the end of wave (v) is the all-time high of 2134.72. From there we expect some churning, and then a horrific plunge to below the 2008 crisis lows.
Active Trading Positions: Short and will take profits at 2068.00, with 2120 calls as stops!
USDX
Short-Term Update

The USDX was higher in the overnight session. reaching 94.87, at the time that this Post was being written. We should still be working on our wave $ii$ corrective rally. We are getting close to our 61.8% retracement for all of wave $ii$, so if our current analysis is correct then this wave !ii! rally should be ending soon.
As you can see on the Daily USDX Chart we have now entered our 50 to 61.8% retracement zone, which is:
50% = 94.66;
61.8% = 94.96.
Upon completion of wave $ii$ we expect a very sharp drop in wave $iii$ to be the next big event in this market.
Long-Term Trading Update
Our expected sharp drop in wave !iii! has begun, which should see this market move below the 91.00 level.
Active Trading Positions: We are short at 95.85, and have added to shorts at 94.80, risking all to 96.00!
HUI/GDX and Selected Gold Stocks
Short-Term Update
We are now waiting for confirmation that the GDX, ABX and KGC markets have reached temporary short term tops and are starting small corrections, within our next impulsive leg higher.
These markets could continue higher, if gold keeps moving higher as this first impulsive leg could extend.
GDX
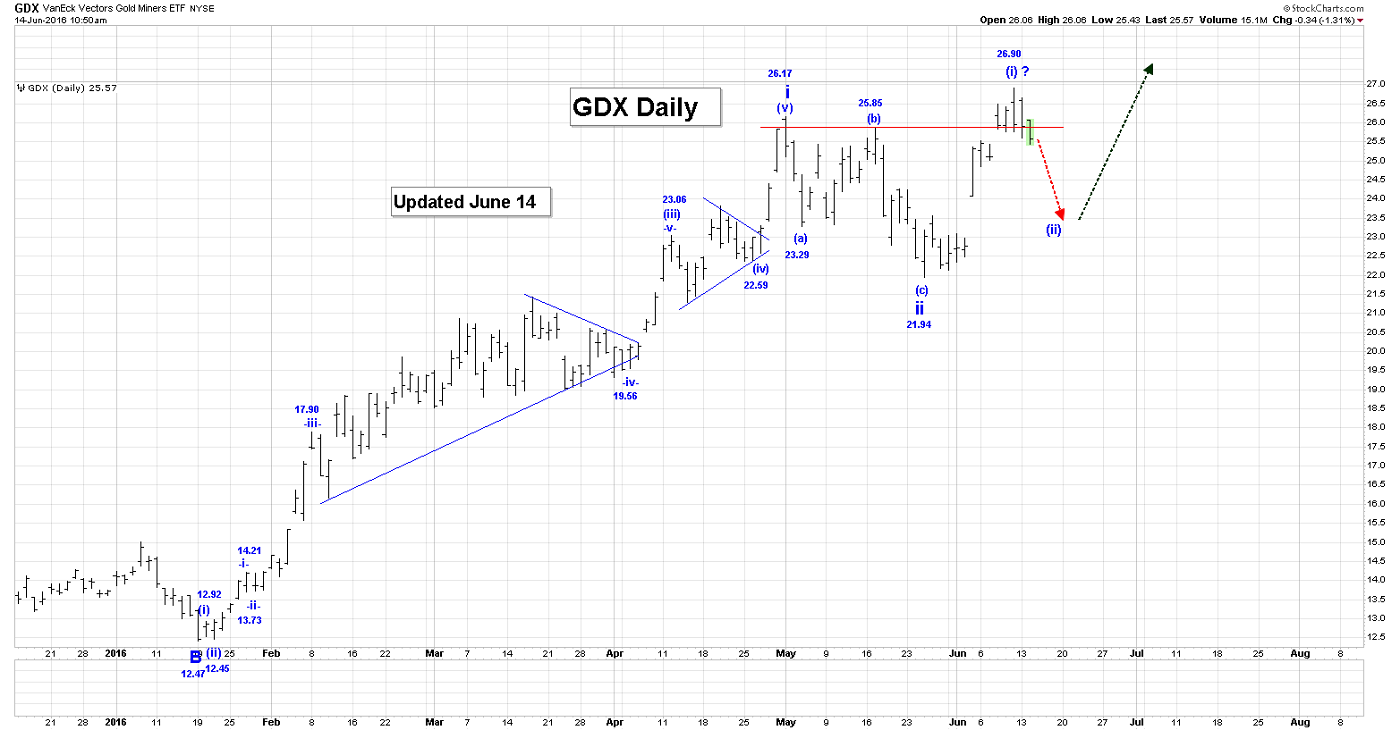
As you can see on the Daily GDX Chart, we have completed all of wave ii at 21.94. We should now be moving higher in wave (i) of iii, which may have ended at the 26.90 high.
Upon completion of wave (i) we expect a wave (ii) correction that should retrace between 50 to 61.8% of the entire wave (i) rally. Our current count for all of wave iii is:
(i) = 26.90, if complete;
(i) drop is next after the completion of wave (i).
SSO (Silver Standard)

As you can see on the Daily SSO Chart, we continue to rally in wave *v* of (i), as we reached a high of 15.01. We need to be on guard for the end of wave *v* and all of wave (i).
The end of wave *v* will mark the end of a 5 wave sequence that started at 5.28. Upon completion of wave (i) we expect a wave (ii) correction that should retrace between 50 to 61.8% of the entire wave (i) rally.
In terms of SSO, we should be getting close to the end of a larger 5 wave impulsive sequence that started at the 5.28 low. In this stock the upcoming correction will be much larger than the one we are expecting in the GDX, ABX and KGC markets.
ABX

As you can see on the Daily ABX Chart, all of wave (ii) is complete at the 16.22 low. We are going to be moving sharply higher in wave (iii) of iii as the next big event.
We do need to be on guard for end of wave .i. of (iii)., which has likely occurred at the 20.47 high. Upon completion of wave .i., we expect a wave .ii. correction that should retrace between 50 to 61.8% of the entire wave .ii. rally. Our current count for wave (iii) is;
.i. = 20.47, if complete;
KGC
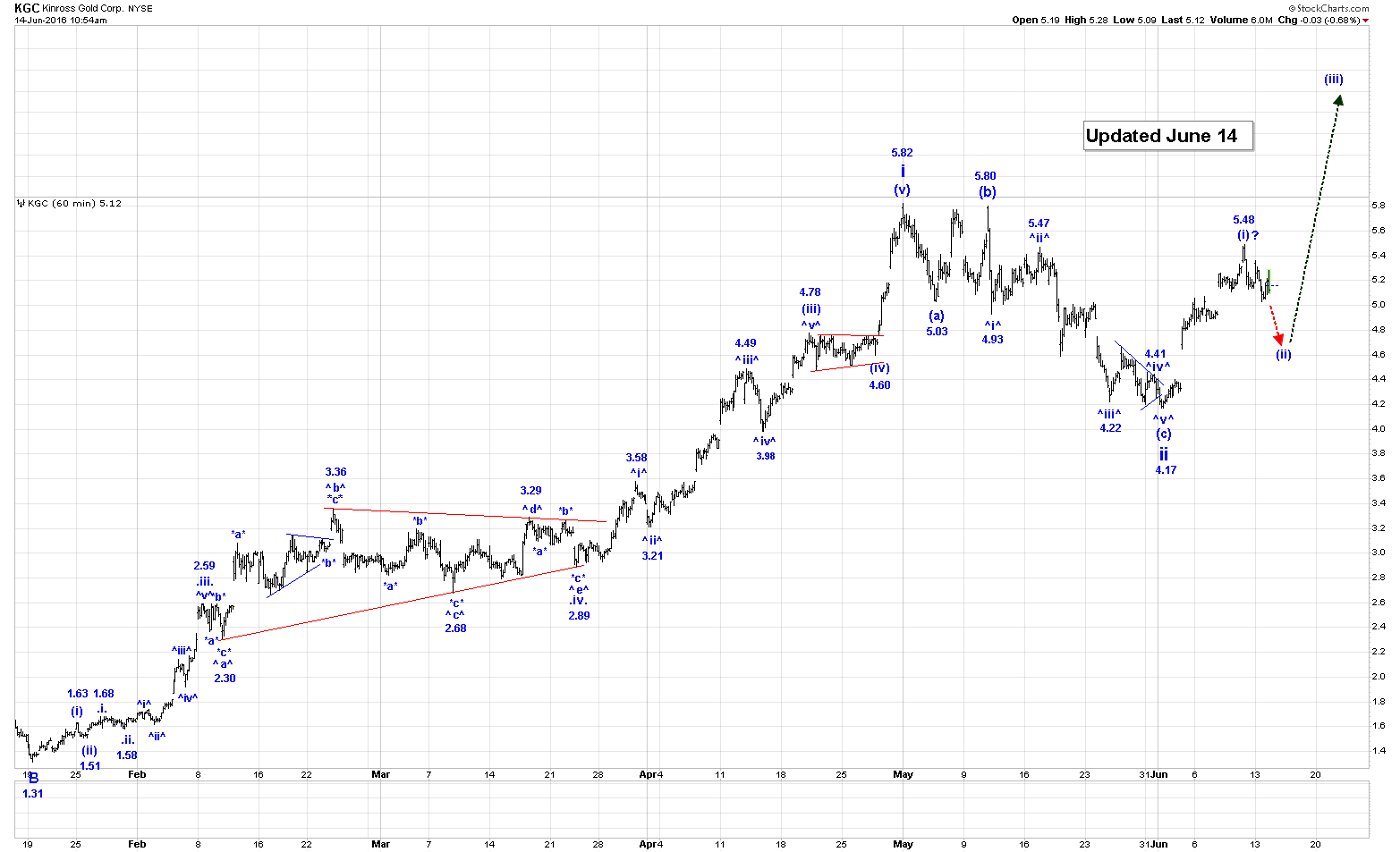
As you can see on the 60 Min KGC Chart, we have a completed wave ii at 4.17, and we are now rallying in wave (i) of iii. Wave (i) of iii is likely complete at the 5.48 high, and if that is the case, then we should expect a wave (ii) correction that retraces between 50 to 61.8% of the entire wave (i) rally.
Long-Term Update
Our first impulsive sequence out of wave B lows of the GDX and our selected gold stocks, is likely now complete at the current highs and we are correcting in wave ii, except in ABX, which will be correcting in wave (ii) of iii.
Active Trading Positions: We are long the GDX, ABX, KGC, NEM, CRJ, and TSX:XGD with no stops, and are now adding.
********
Free Trades Offer For Gold-Eagle Readers Send me an email to [email protected] and I’ll send you my next couple short term ewave trades for free!
********
Email: [email protected]
Website: www.captainewave.com
Risk: CAPTAINEWAVE.COM IS AN IMPERSONAL ADVISORY SERVICE. AND THEREFORE, NO CONSIDERATION CAN OR IS MADE TOWARD YOUR FINANCIAL CIRCUMSTANCES. ALL MATERIAL PRESENTED WITHIN CAPTAINEWAVE.COM IS NOT TO BE REGARDED AS INVESTMENT ADVICE, BUT FOR GENERAL INFORMATIONAL PURPOSES ONLY. TRADING STOCKS DOES INVOLVE RISK, SO CAUTION MUST ALWAYS BE UTILIZED. WE CANNOT GUARANTEE PROFITS OR FREEDOM FROM LOSS. YOU ASSUME THE ENTIRE COST AND RISK OF ANY TRADING YOU CHOOSE TO UNDERTAKE. YOU ALSO AGREE TO BEAR COMPLETE RESPONSIBILITY FOR YOUR INVESTMENT RESEARCH AND DECISIONS AND ACKNOWLEDGE THAT CAPTAINEWAVE.COM HAS NOT AND WILL NOT MAKE ANY SPECIFIC RECOMMENDATIONS OR GIVE ADVICE TO YOU OR ANY OF ITS CLIENTS UPON WHICH THEY SHOULD RELY. CAPTAINEWAVE.COM SUGGESTS THAT THE CLIENT/MEMBER TEST ALL INFORMATION AND TRADING METHODOLOGIES PROVIDED AT OUR SITE THROUGH PAPER TRADING OR SOME OTHER FORM OF TESTING. CAPTAINEWAVE.COM, ITS OWNERS, OR ITS REPRESENTATIVES ARE NOT REGISTERED AS SECURITIES BROKER-DEALERS OR INVESTMENT ADVISORS EITHER WITH THE U.S. SECURITIES AND EXCHANGE COMMISSION OR WITH ANY STATE SECURITIES REGULATORY AUTHORITY. WE RECOMMEND CONSULTING WITH A REGISTERED INVESTMENT ADVISOR, BROKER-DEALER, AND/OR FINANCIAL ADVISOR. IF YOU CHOOSE TO INVEST WITH OR WITHOUT SEEKING ADVICE FROM SUCH AN ADVISOR OR ENTITY, THEN ANY CONSEQUENCES RESULTING FROM YOUR INVESTMENTS ARE YOUR SOLE RESPONSIBILITY.
ALL INFORMATION POSTED IS BELIEVED TO COME FROM RELIABLE SOURCES. CAPTAINEWAVE.COM DOES NOT WARRANT THE ACCURACY, CORRECTNESS, OR COMPLETENESS OF INFORMATION AVAILABLE FROM ITS SERVICE AND THEREFORE WILL NOT BE LIABLE FOR ANY LOSS INCURRED. DUE TO THE ELECTRONIC NATURE OF THE INTERNET, THE CAPTAINEWAVE.COM WEBSITE, ITS E-MAIL & DISTRIBUTION SERVICES AND ANY OTHER SUCH "ALERTS" COULD FAIL AT ANY GIVEN TIME. CAPTAINEWAVE.COM WILL NOT BE RESPONSIBLE FOR UNAVAILABILITY OF USE OF ITS WEBSITE, NOR UNDELIVERED E-MAILS, OR "ALERTS" DUE TO INTERNET BANDWIDTH PROBLEMS, EQUIPMENT FAILURE, OR ACTS OF GOD. CAPTAINEWAVE.COM DOES NOT WARRANT THAT THE TRANSMISSION OF E-MAILS, OR ANY "ALERT" WILL BE UNINTERRUPTED OR ERROR-FREE. CAPTAINEWAVE.COM WILL NOT BE LIABLE FOR THE ACTS OR OMISSIONS OF ANY THIRD PARTY WITH REGARDS TO CAPTAINEWAVE.COM DELAY OR NON-DELIVERY OF THE CAPTAINEWAVE.COM NIGHTLY EMAILS OR "ALERTS". FURTHER, WE DO NOT RECEIVE ANY FORM OF PAYMENT OR OTHER COMPENSATION FOR PUBLISHING INFORMATION, NEWS, RESEARCH OR ANY OTHER MATERIAL CONCERNING ANY SECURITIES ON OUR SITE OR PUBLISH ANY INFORMATION ON OUR SITE THAT IS INTENDED TO AFFECT OR INFLUENCE THE VALUE OF SECURITIES.
THERE IS NO GUARANTEE PAST PERFORMANCE WILL BE INDICATIVE OF FUTURE RESULTS. NO ASSURANCE CAN BE GIVEN THAT THE RECOMMENDATIONS OF CAPTAINEWAVE.COM WILL BE PROFITABLE OR WILL NOT BE SUBJECT TO LOSSES. ALL CLIENTS SHOULD UNDERSTAND THAT THE RESULTS OF A PARTICULAR PERIOD WILL NOT NECESSARILY BE INDICATIVE OF RESULTS IN FUTURE PERIODS. THE RESULTS LISTED AT THIS WEBSITE ARE BASED ON HYPOTHETICAL TRADES. PLAINLY SPEAKING, THESE TRADES WERE NOT ACTUALLY EXECUTED. HYPOTHETICAL OR SIMULATED PERFORMANCE RESULTS HAVE CERTAIN INHERENT LIMITATIONS. UNLIKE AN ACTUAL PERFORMANCE RECORD, SIMULATED TRADES DO NOT REPRESENT ACTUAL TRADING. ALSO, SINCE THE TRADES HAVE NOT ACTUALLY BEEN EXECUTED, THE RESULTS MAY HAVE OVER OR UNDER COMPENSATED FOR THE IMPACT, IF ANY, OF CERTAIN MARKET FACTORS SUCH AS LACK OF LIQUIDITY. YOU MAY HAVE DONE BETTER OR WORSE THAN THE RESULTS PORTRAYED. NO REPRESENTATION IS BEING MADE THAT ANY ACCOUNT WILL OR IS LIKELY TO ACHIEVE PROFITS OR LOSSES SIMILAR TO THOSE SHOWN. NO INDEPENDENT PARTY HAS AUDITED THE HYPOTHETICAL PERFORMANCE CONTAINED AT THIS WEBSITE, NOR HAS ANY INDEPENDENT PARTY UNDERTAKEN TO CONFIRM THAT THEY REFLECT THE TRADING METHOD UNDER THE ASSUMPTIONS OR CONDITIONS SPECIFIED HEREAFTER. WHILE THE RESULTS PRESENTED AT THIS WEBSITE ARE BASED UPON CERTAIN ASSUMPTIONS BELIEVED TO REFLECT ACTUAL TRADING CONDITIONS, THESE ASSUMPTIONS MAY NOT INCLUDE ALL VARIABLES THAT WILL AFFECT, OR HAVE IN THE PAST AFFECTED, THE EXECUTION OF TRADES INDICATED BY CAPTAINEWAVE.COM. THE HYPOTHETICAL RESULTS ON THIS WEBSITE ARE BASED ON THE ASSUMPTION THAT THE CLIENT BUY AND SELLS THE POSITIONS AT THE OPEN PRICE OF THE STOCK. THE SIMULATION ASSUMES PURCHASE AND SALE PRICES BELIEVED TO BE ATTAINABLE. IN ACTUAL TRADING, PRICES RECEIVED MAY OR MAY NOT BE THE SAME AS THE ASSUMED ORDER PRICES.
More from Gold-Eagle


