Technical Analysis Of The Markets


Current Position of the Market
SPX Long-term trend: A lengthy correction is most likely underway!
SPX Intermediate trend: More time is needed to evaluate the nature of this rally.
Analysis of the short-term trend is done on a daily basis with the help of hourly charts. It is an important adjunct to the analysis of daily and weekly charts which discuss longer market trends
A PERPLEXING MARKET
Market Overview
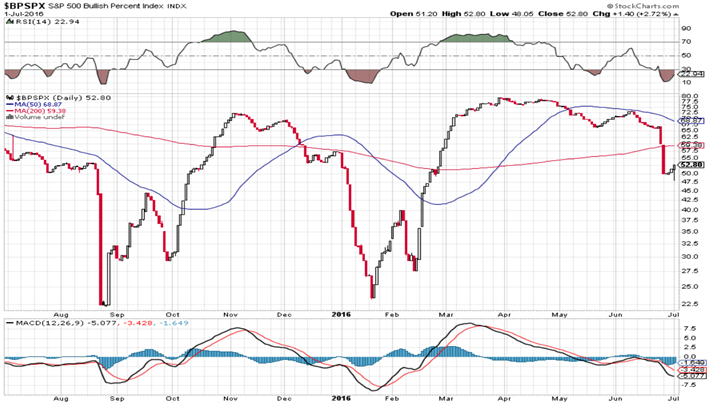
After Brexit was announced, the SPX dropped a quick 120 points in two days. This had all the earmarks of another decline of intermediate proportion but, instead of moving lower, the index did something totally unexpected and rebounded 116 points over the next four days! By Friday, there were ample signs that the rally was losing steam and was preparing for a correction, but what kind? Will it be short, followed by another wave of buying which will take us to a new high? Or will this rally turn out to be another futile attempt at penetrating the strong overhead supply band that has turned back every attempt at penetration for the past year? The technical suggestion that we have arrived at a short-term top is boosted by a projection to this approximate level by the base which quickly formed after last week’s decline. There is, however, a projection to 2240 derived from the larger base established after the index dropped to 1810, which remains valid, so a new high made at that level would not be surprising. Except that the behavior of certain key indexes and indicators during last week’s rally do not really support such a move. Let’s look at the chart of BPSPX (courtesy of StockCharts.com). It represents the percentage of stocks on Point & Figure buy signals in the SPX.
If you look at the two previous intermediate downtrends in that index, this indicator declined along with prices, showed positive divergence at the second bottom which came a few weeks after the first, and then rallied strongly with the index as it started a new uptrend. If we measure the degree of strength of last week’s rally by this indicator, it’s practically nil! We’ll have to watch it closely over the near term to see if it makes a late recovery. Perhaps there has not been enough time! If it does not, the chances of the SPX going on to make a new high are not very good! Incidentally, the Bullish Percent Index for the DJIA, NYA, and NDX all look the same. This is puzzling!
Later on, we’ll examine the relative rally performance of the other leading and confirming indexes that we follow regularly.
SPX Chart Analysis (This chart and others below, are courtesy of QCharts.com.)
Daily chart
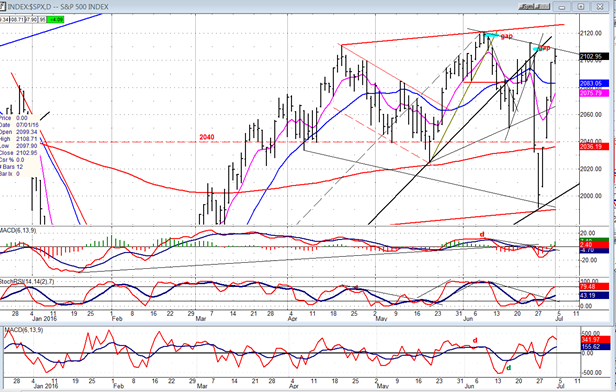
By Friday, the rally from 1991 had reached the Brexit opening gap and had almost filled it entirely before some profit taking turned the index back down. The selling was well-contained and SPX still managed to close up four points for the day. The advance stopped at the downtrend line drawn across the last two tops, a logical place to stop, especially since it also filled the base projection with the index in an overbought condition. By comparison to the previous three days of advance, Friday’s had a much smaller range, an indication that SPX was losing its momentum and was preparing to consolidate.
The gap that was partially filled was the second one of the decline which started at 2120. Will we go on to challenge the higher one after a short-consolidation? It’s a good possibility which will become apparent when we look at the hourly chart. If we do, we would be breaking above the downtrend line which stopped us this time, but there will be another challenge ahead: the broken trend channel line from 1810 which has already repeatedly proven itself as resistance after it was broken.
The lack of real follow through on Friday is also reflected in the oscillators. The MACD and SRSI started to angle over and the A/D oscillator reversed. Until all three turn down completely, there is still a possibility that this rally will continue its upside push. If it does, it will be a question of by how much!
Hourly Chart
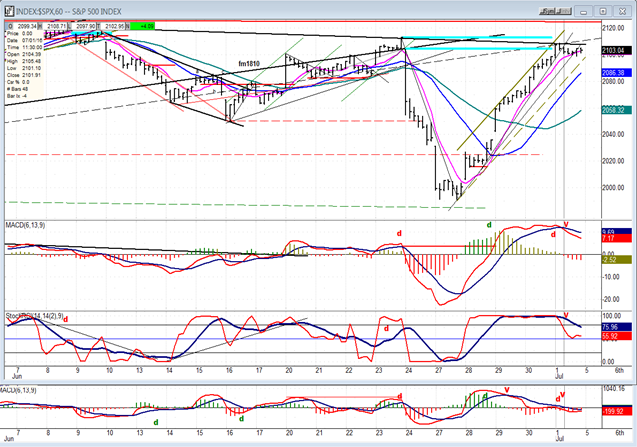
Friday’s loss of momentum is much easier to see on this chart. During the first hour, the index hit the trend line and could go no farther. For the rest of the day it traded in a small range, supported by the pink MA. The two light blue lines represent the parameters of the gap which was created at the opening on the twenty-fourth, the day after the result of the referendum was announced. We can see that the rally did not quite close the gap entirely before pulling-back.
The last hour traded completely outside of the trend line from the low, so we could see a lower opening on Tuesday morning. We also note that all three oscillators gave a preliminary sell signal and started to decline, but the MACD will have to become negative before we have a confirmed reversal. Before that happens, it’s possible that after a brief consolidation, the SPX will make a new high ahead of starting a more prolonged correction. The rally may have failed to get above the former high of 2112 on this move, but it did bring some positive divergence to the MACD, and this indicator may have to display negative divergence before we find a short-term top.
As long as the index remains above 2043, there will be a chance that it can make a new high. However, a drop below that level is likely to result in a new low.
SPX et al… (Daily)
BPSPX is not the only indicator which did not keep up during the recent rally. XBD also underperformed by a wide margin. The other indexes had oversold rallies comparable to the SPX (not shown here) and DJIA, but from much lower levels, which clearly indicate their longer-term relative weakness.
Also worthy of note is that in the DJIA, the volume level during the rally was much lower when compared to that of the decline.

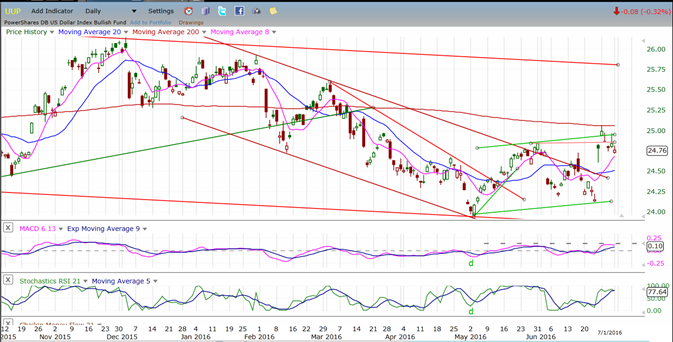
UUP (Dollar ETF)
UUP has now completely broken out of its intermediate corrective channel, but it has immediately come up against resistance provided by some minor channel lines and the 200-dma. It will have to work its way through that level if it is to challenge its longer-term top channel line.
GDX (Gold Miners ETF)
GDX may be at a critical juncture! If, after Friday’s strong advance, it cannot immediately make further headway, but instead starts to trade in a narrow range, it will validate the projection target of about 29.50 that was derived from the July-to-January base from which it broke out, and which provided the fuel that propelled it to its current level. If that source of fuel is about to be exhausted -- as suggested by filling the count from that base -- then Friday’s strength is only the last gasp of the move which started at 12.40, on 1/19. P&F counts are often exact, but sometimes they are only approximate. Therefore, we must give GDX a little time to show us what it intends to do at this level.
The last re-accumulation pattern between 22 and 25, gives it a confirming count to about 30.50, so this is another possibility. Also, at Friday’s level, the index may only be completing wave 3 of 5 from 22, in which case, GDX could spend some time in this area before beginning to retrace. The weekly indicators show some clear negative divergence. But the daily and hourly indicators are only overbought as a result of Friday’s move. The index will need time to implemnent the distribution process which will eventually bring all the indicators to a sell position. We are not there yet!

USO (US Oil Trust)
USO found resistance at 12.30 when it filled an important gap. 12.30 also filled the base count which could conceivably be extended to 13.5-14.00 before a more severe retracement takes place. If USO breaks below the trend line which is currently providing support, the odds of moving higher before undertaking a base building process will diminish.

Summary
The rapid Brexit-induced 120-point decline was short-lived, giving way to a four-day rally which retraced it almost completely.
By Friday, the rally started to show signs of exhaustion as it filled a base projection to the 2106-2112 level. It is possible that SPX could start retracing its steps right away, but more likely that it will undergo a phase of consolidation from which it could attempt to rally even higher, perhaps to a new high. There is an unfilled projection to the 2240 level which could still dominate the short-term trend, but the lack of confirmation by some of the indicators and indexes discussed above calls such a move into question, and will require concrete proof that SPX can make a new high -- something that it has failed to do in several attempts over the past year.
********
FREE TRIAL SUBSCRIPTON
Market Turning Points is an uncommonly dependable, reasonably priced service providing intra-day market updates, a daily Market Summary, and detailed weekend reports. It is ideally suited to traders, but it can also be valuable to investors since highly accurate longer-term price projections are provided using Point & Figure analysis and Fibonacci projections. Best-time reversal estimates are obtained from cycle analysis.
For a FREE 4-week trial, send an email toFor further subscription options, payment plans, weekly newsletters, and for general information, I encourage you to visit my website at www.marketurningpoints.com. By clicking on "Free Newsletter" you can get a preview of the latest newsletter which is normally posted on Sunday afternoon (unless it happens to be a 3-day weekend in which case it could be posted on Monday).
The above comments and those made in the daily updates and the Market Summary about the financial markets are based purely on what I consider to be sound technical analysis principles. They represent my own opinion and are not meant to be construed as trading or investment advice, but are offered as an analytical point f view which might be of interest to those who follow stock market cycles and technical analysis.

When Andre Gratian was a stock broker years ago, a friend introduced him to technical analysis of the market. Consequently, it is not an exaggeration to say that Andre fell in love with this approach! Ever since then, it has become an increasingly important part of his professional life. Gratian has studied the works of Wyckoff, Edwards & Magee, Edward J. Dewey (cycles) and many others. However, one of my most profitable undertaking has probably been to study Point & Figure charting, which he finds invaluable in analyzing stocks and indices. If he were restricted to one methodology, this is the one that he would choose. This well-rounded background has given him what he feels to be a special insight into the stock market, facilitating the recognition of meaningful patterns and the ‘turning points’ in all trends, whether they be short or long term. Andre feels very comfortable discussing the stock market and passing on meaningful information to others. His subscribers include individuals and money managers throughout the world. Moreover, his Newsletters are currently published on several financial sites, here and abroad.


