Technical Analysis Of The Markets


Current Position of the Market
SPX Long-t\Term Trend: If the market strength persists, the long-term trend may need to be re-evaluated.
SPX Intermediate-Trend: SPX intermediate P&F count to 2300 has been reached. A reversal should now occur.
Analysis of the short-term trend is done on a daily-basis with the help of hourly charts. It is an important adjunct to the analysis of daily and weekly charts which discuss longer market trends.
Testing The High
Market Overview
Last week I mentioned that when it reached 2300. Effectively, SPX had reached its most likely projection taken at the 1810 base. I also mentioned that it would be normal for a distribution pattern to form before a correction got under way. I believe that this is what the index is currently doing, along with re-testing the high. If, in the process, we should surpass it by a few points, that too would be normal. And finally, if we are in a super strong bull market, we could simply consolidate in a broad price range before moving higher, and If we are not able to retrace below 2230, this is most likely what we are doing.
That is not the preferred scenario. The favored trend over the next few weeks would be a retracement of at least 100 points, and perhaps more. This would be consistent with the market’s historical patterns. Even the staunchest bulls would concede that, considering the market’s long-term overbought condition, such a correction would not be unusual, and perhaps even healthy. Nevertheless, until a correction does take place, there is no certainty that it will.
The cyclical structure does favor such a scenario. Intermediate cycles are projecting a low in April/May. But, according to Erik Hadik, long-term cycles have been laying the groundwork for a more substantial decline than just a hundred points. We’ll see!
Analysis (This chart and others below, are courtesy of QCharts.com.)
Daily Chart
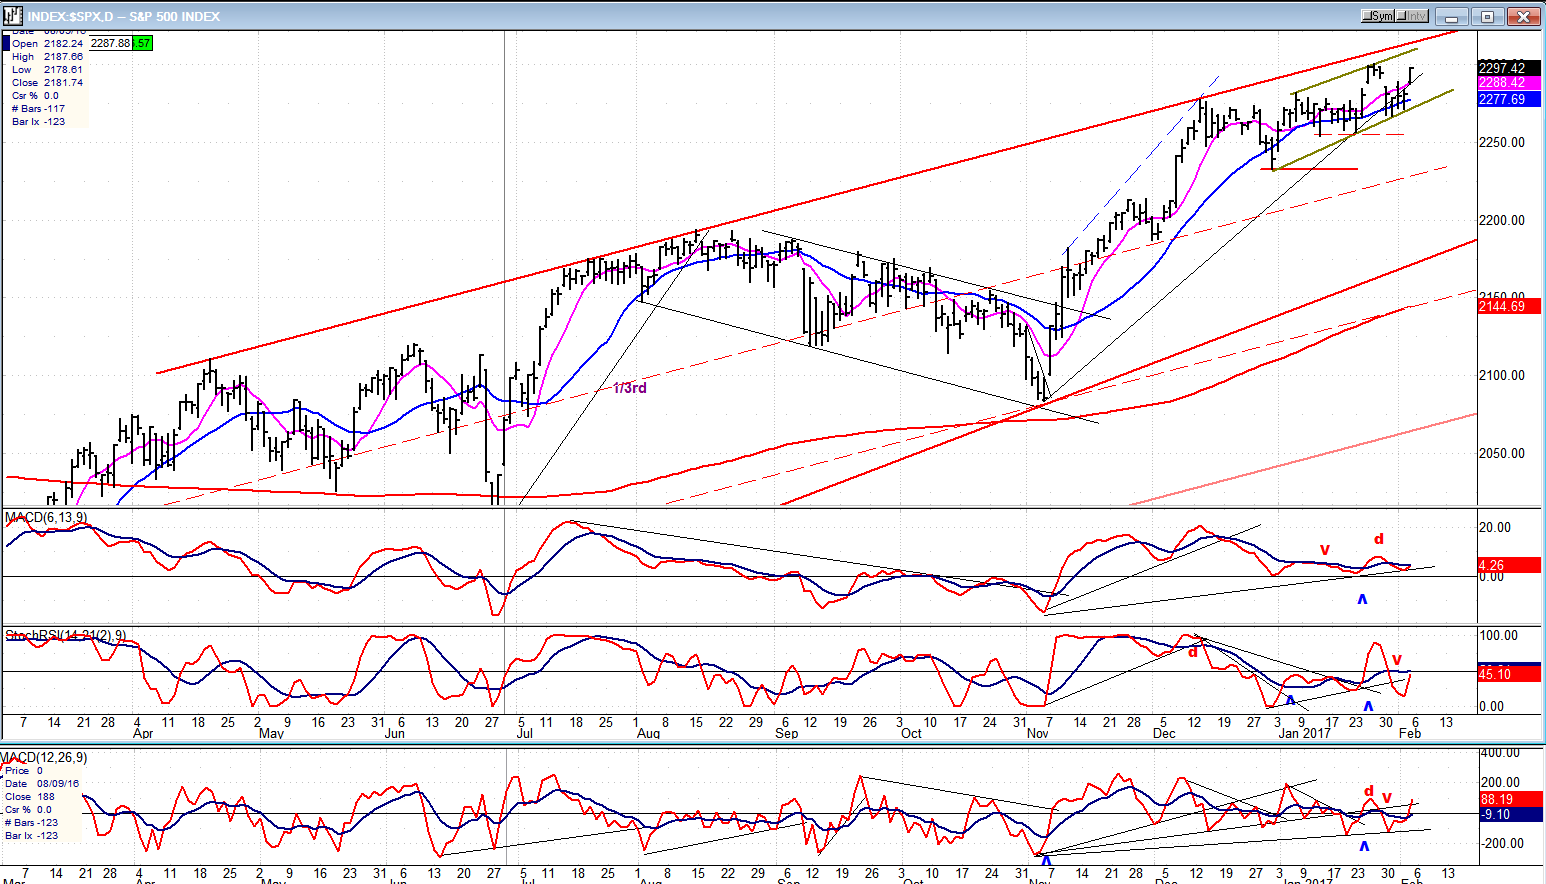
The biggest surprise that the market could have in store for us would be to keep on rising and go through the red trend line which has stopped every rally since April of last year. After touching 2300 last week, the index pulled back immediately, dropping thirty-three points in two days, but refused to go lower -- ostensibly waiting for last Friday’s job report. Its positive nature fostered a rally which came within two points of the high in the first hour and a half of trading. After that, it meandered in a small range for the rest of the session and closed at 2297, near its high of the day. There was a drop of two points in the futures immediately after the close, but this may only be a cautious move by some traders in case more pyrotechnics should come from the White House over the week-end, and not an indication of weakness coming at Monday’s opening.
Because we have not yet received a sell signal from the daily indicators, we could push a little higher past 2300. As we can see on the chart, since the index pulled back to the 2233 level a month ago, it has been moving in a small slanted channel which looks like distribution for a top. The move to 2300 took it to the top of the channel; and last Monday’s retracement, back to it’s low. If we fail to push ahead on Monday and make a new high, we can probably expect the next downturn to take us below last week’s low on our way to challenge the 2233 level. It must be taken out if we are to fulfill our expectation of starting an intermediate-term downtrend.
The first indication that we are on our way would be to drop below the lower line of the small channel, with additional confirmation coming after we break below 2233. With Friday’s rally, the oscillators turned up; but are at best neutral. Next week’s action is needed to clarify the short-term trend which remains positive, though sluggish.
Hourly Chart
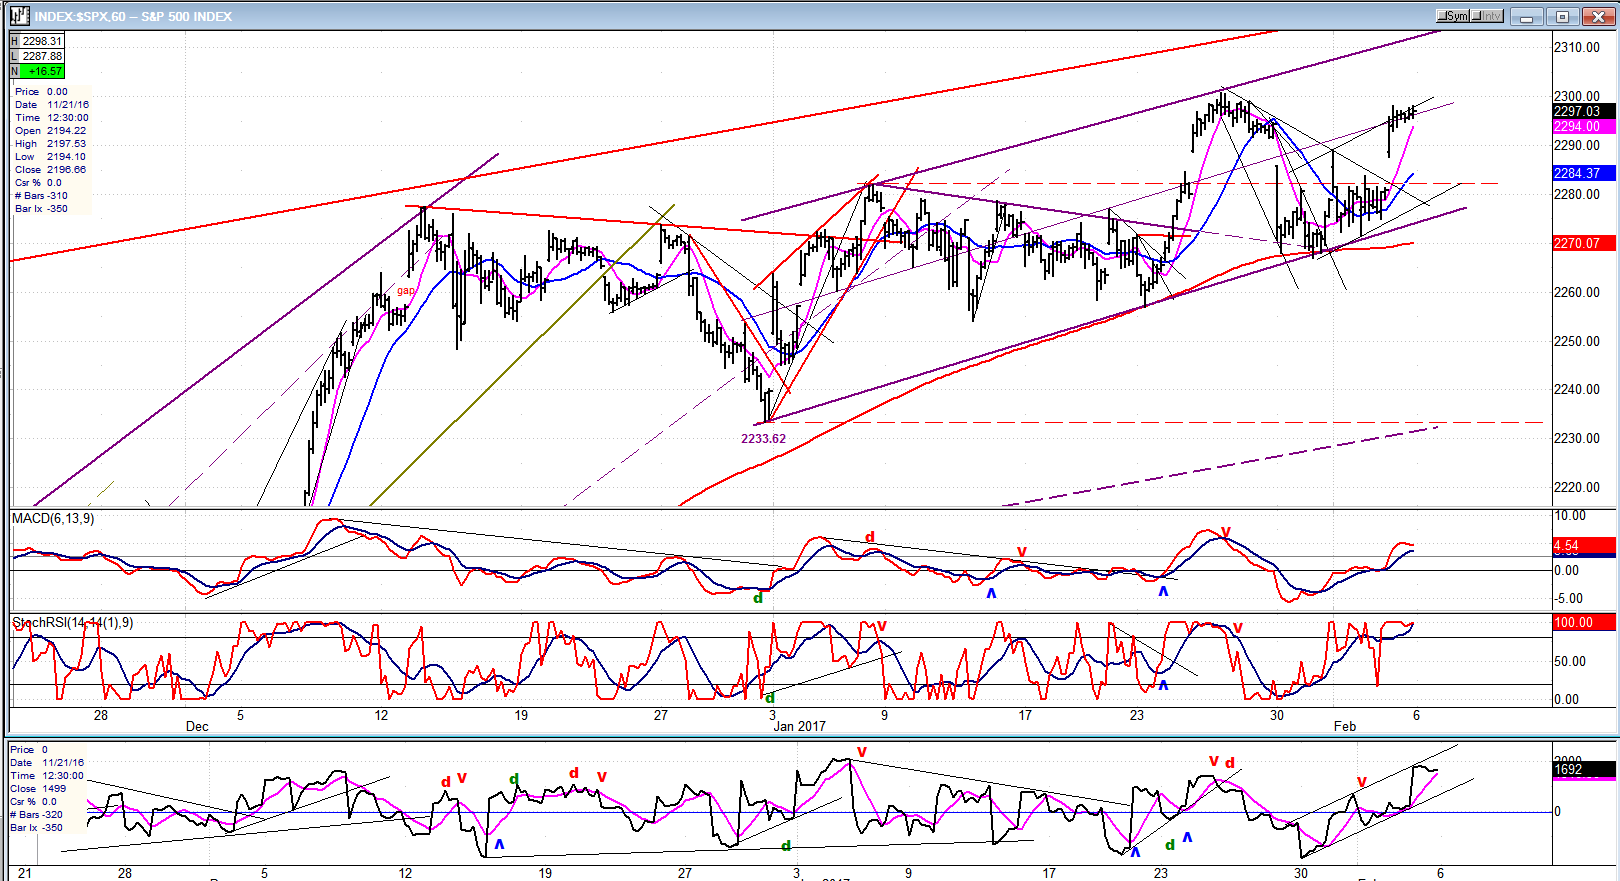
We have here an enlarged view of the small channel that has formed under the top of the diagonal which goes back to 1810. On Friday, the market gapped up at the opening and quickly met with resistance at the mid-channel line, and under the small congestion pattern which formed at the recent high. If we start down on Monday, we are probably done. However, if we continue to the top of the small channel, we will prolong the topping formation and be kept in suspense. There is no divergence showing in any of the oscillators and this means that the topping pattern could continue a little longer. From the 2233 low, the formation has the appearance of an ending pattern with the third, and most likely last, small up-wave in process.
Note how every retracement has found support on the red 200-hr MA. Breaking below it would be the first firm indication that we are rolling over. Should this happen, our first level of support would be at the 2233 level which, by the time we get there, will be reinforced by the mid-channel line of a larger channel.
An Overview Of Some Important Indexes (Weekly Charts)
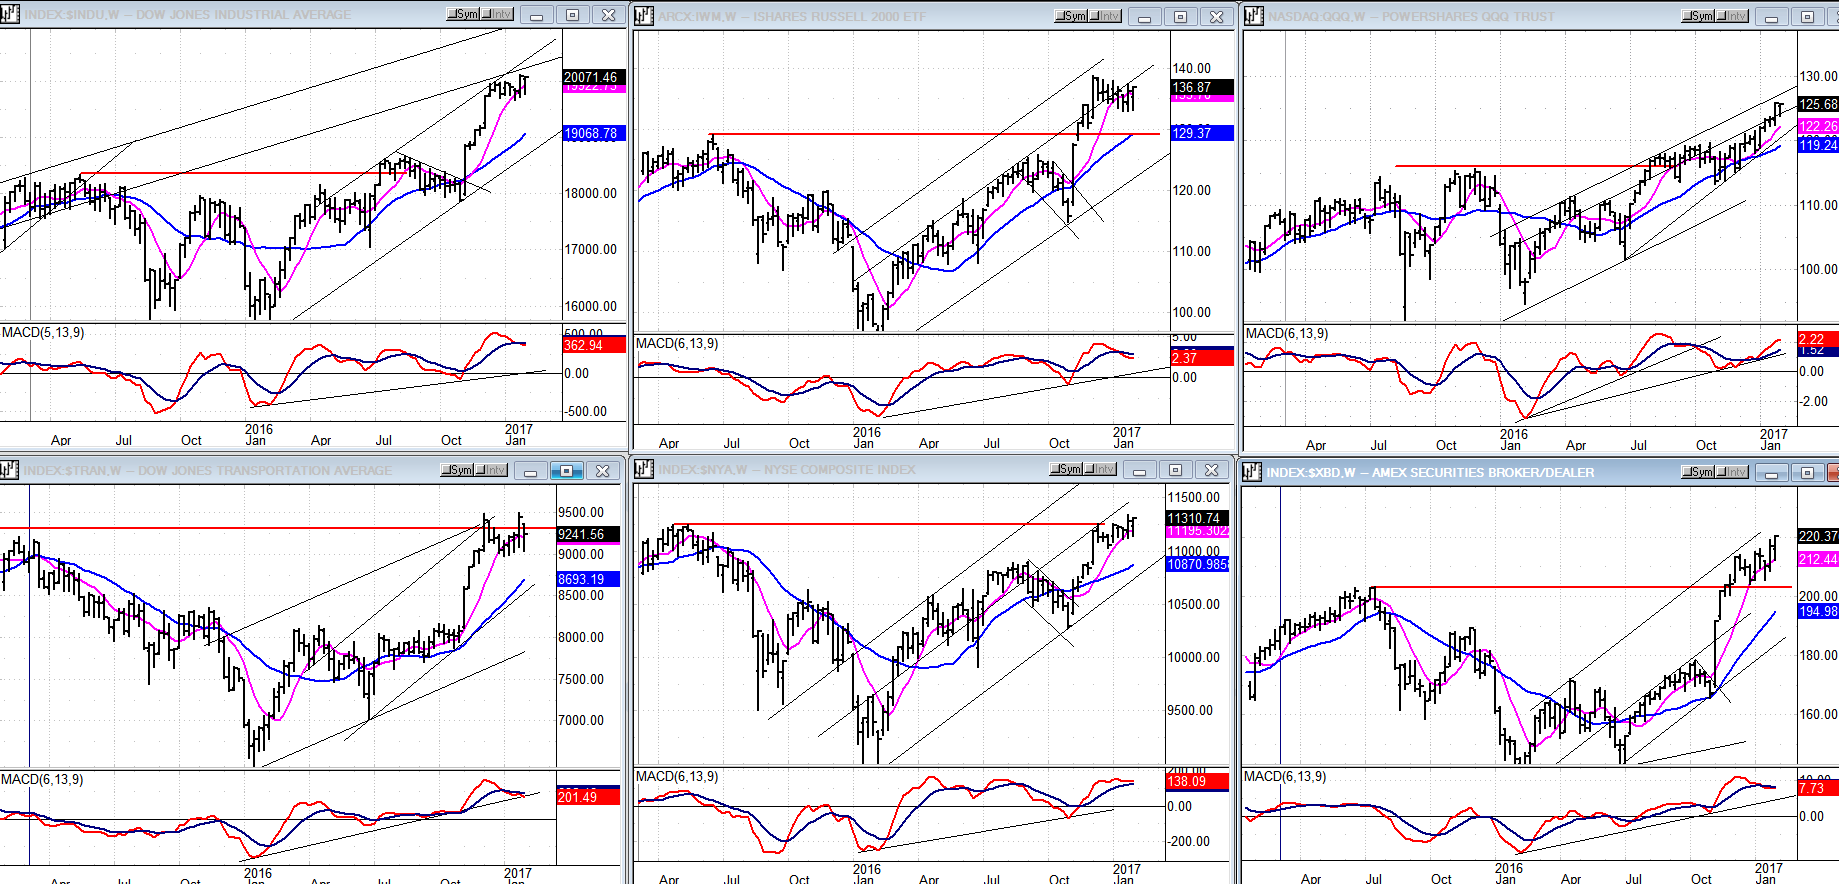
In the past week, only one index made a slightly new high: XBD (bottom right). Three others re-tested their highs, and two are beginning to show some weakness: TRAN (bottom left) and IWM (top center).
It’s too soon to draw any kind of conclusion from this group’s action, but if these last two (which have been market leaders in the past) continue to weaken, it will add credibility that a top is forming in the overall market. Before we get a confirmed top, all the indexes must show signs of reversing.
UUP (Dollar ETF)
UUP may be finding some support at this level, and beginning to build a small base before reversing its trend. If so, it must not make a new low in the coming week. In any case, a reversal is near but what kind will be determined by the next rally. It may simply be a rally in a downtrend followed by a resumption of weakness, or by a larger and more lengthy consolidation.

GDX (Gold Miners ETF)
GDX continues to move higher. It has a reliable 18-wk cycle which is marked on the chart, but has been known to invert, and this may be what the index is currently doing. The best date for this cycle to top or bottom, would be mid-month. The next low could then come in early March if another dominant cycle does not invert.
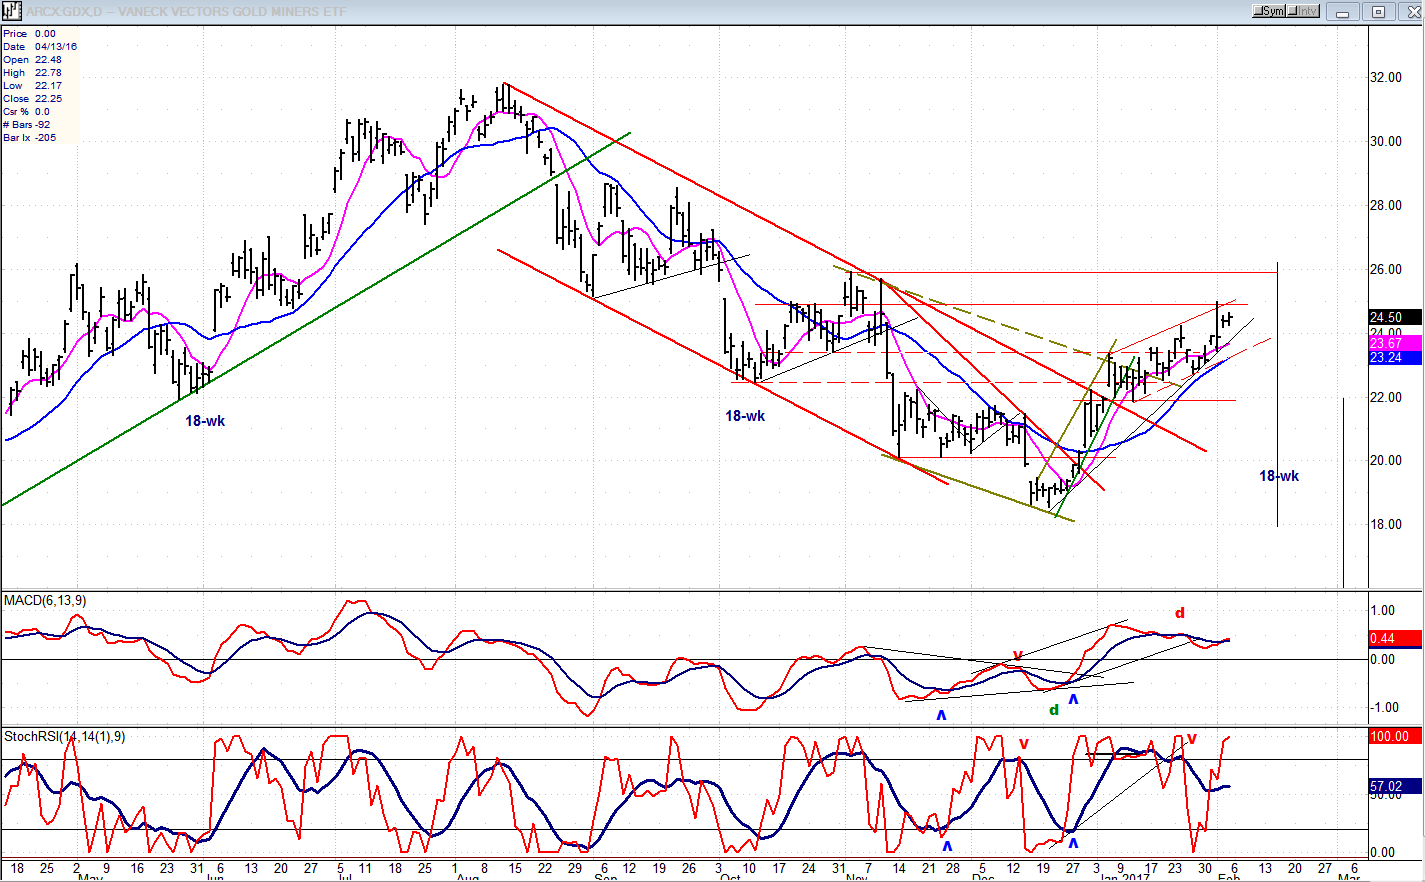
Note: GDX is now updated for subscribers throughout the day, along with SPX.
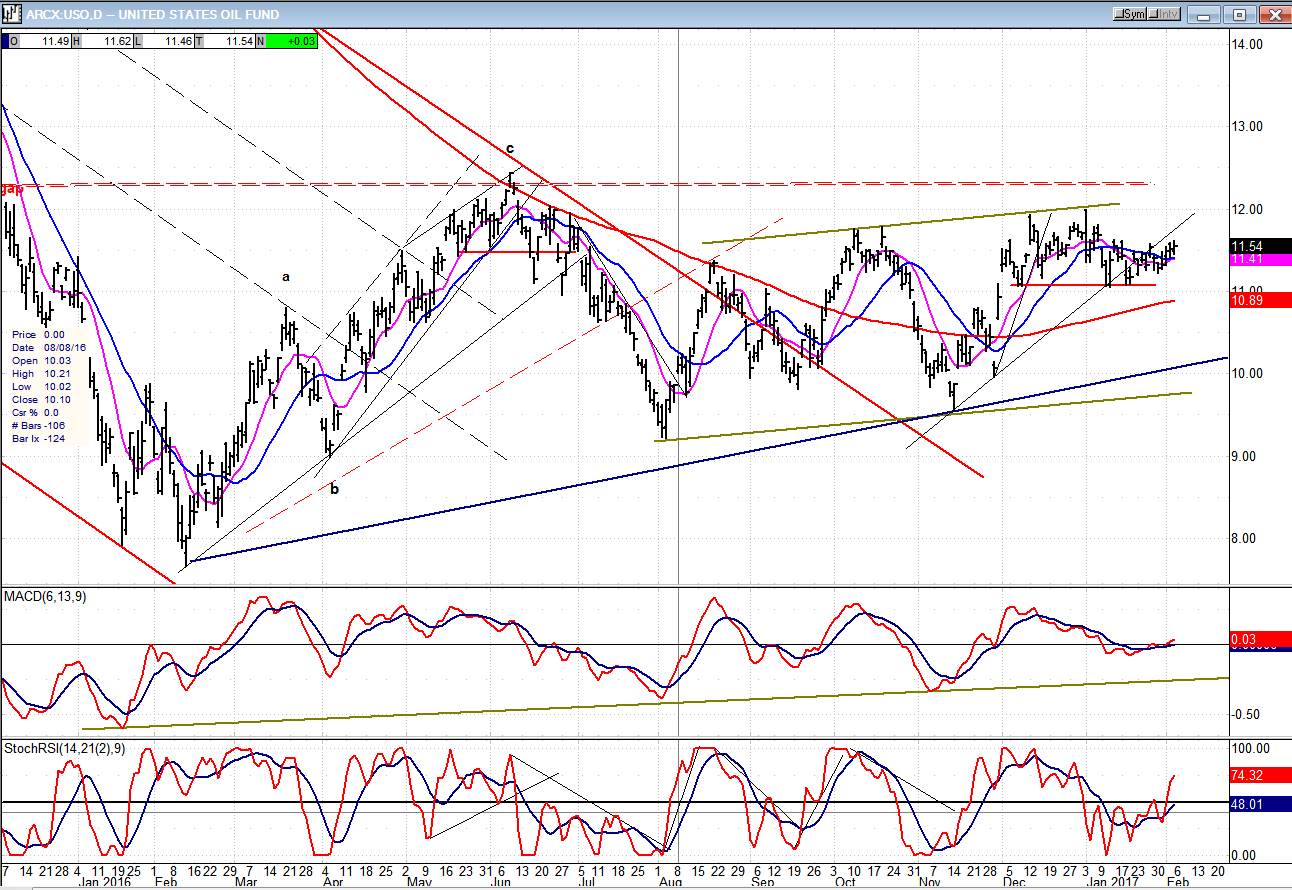
USO (US Oil Fund)
USO continues to move sideways. As long as it holds above the red horizontal line, its next move could still be on the upside, but the time window for that move is closing.
Summary
After Monday’s sharp drop, SPX held at an important short-term support level and rallied after the jobs report came out on Friday. This move is essentially a test of the high, but it could expand into more distribution which might even see new highs before a reversal occurs.
********
For a FREE 4-week trial, send an email to [email protected], or go to www.marketurningpoints.com and click on “subscribe”. There, you will also find subscription options, payment plans, weekly newsletters, and general information. By clicking on "Free Newsletter" you can get a preview of the latest newsletter which is normally posted on Sunday afternoon (unless it happens to be a 3-day weekend, in which case it could be posted on Monday).
The above comments and those made in the daily updates and the Market Summary about the financial markets are based purely on what I consider to be sound technical analysis principles. They represent my own opinion and are not meant to be construed as trading or investment advice, but are offered as an analytical point f view which might be of interest to those who follow stock market cycles and technical analysis.

When Andre Gratian was a stock broker years ago, a friend introduced him to technical analysis of the market. Consequently, it is not an exaggeration to say that Andre fell in love with this approach! Ever since then, it has become an increasingly important part of his professional life. Gratian has studied the works of Wyckoff, Edwards & Magee, Edward J. Dewey (cycles) and many others. However, one of my most profitable undertaking has probably been to study Point & Figure charting, which he finds invaluable in analyzing stocks and indices. If he were restricted to one methodology, this is the one that he would choose. This well-rounded background has given him what he feels to be a special insight into the stock market, facilitating the recognition of meaningful patterns and the ‘turning points’ in all trends, whether they be short or long term. Andre feels very comfortable discussing the stock market and passing on meaningful information to others. His subscribers include individuals and money managers throughout the world. Moreover, his Newsletters are currently published on several financial sites, here and abroad.


