Technical Analysis Of The Markets


Current Position of the Market
SPX Long-Term Trend: Uptrend continues
SPX Intermediate-Trend: Minor reversal at 2300, followed by resumption of uptrend.
Analysis of the short-term trend is done on a daily-basis with the help of hourly charts. It is an important adjunct to the analysis of daily and weekly charts which discuss longer market trends.
Uptrend Continues
Market Overview
“Don’t fight the trend” is a cardinal rule of technical analysis! When SPX reached its 2300 projection, it was expected to pull back, helped by divergences which were showing in various time frames and by topping intermediate cycles already in right translation. It did -- a total of thirty-two points! Then at lightning speed, it started to build a re-accumulation pattern measuring over one hundred points across which took only a few days to complete. In order to appreciate how much stock traded hands in such a short time, you must look at a 1X Point & Figure chart; a bar chart does not do it justice.
Since the break-out of that base occurred at the end of last week, only a little over half of that count has been filled and, although some minor tops should develop in the process, we need to wait until the entire projection has been met. The price level reached will depend on whether traders are satisfied with a conservative or liberal count.
While the size of the re-accumulation phase will play a large part in determining the rally top, at least one of possibly two or three bottoming intermediate cycles should play a part in determining the next low. The 20-week cycle, which has shown good regularity in the past, is expected to bottom around 4/01.
Structurally, the extension of the move beyond 2300 has altered the chart pattern to a bullish channel which will be discussed in the analysis section. This move has also pushed SPX farther away from its bull market trend line which now stands near 2000.
Analysis (This chart and others below, are courtesy of QCharts.com.)
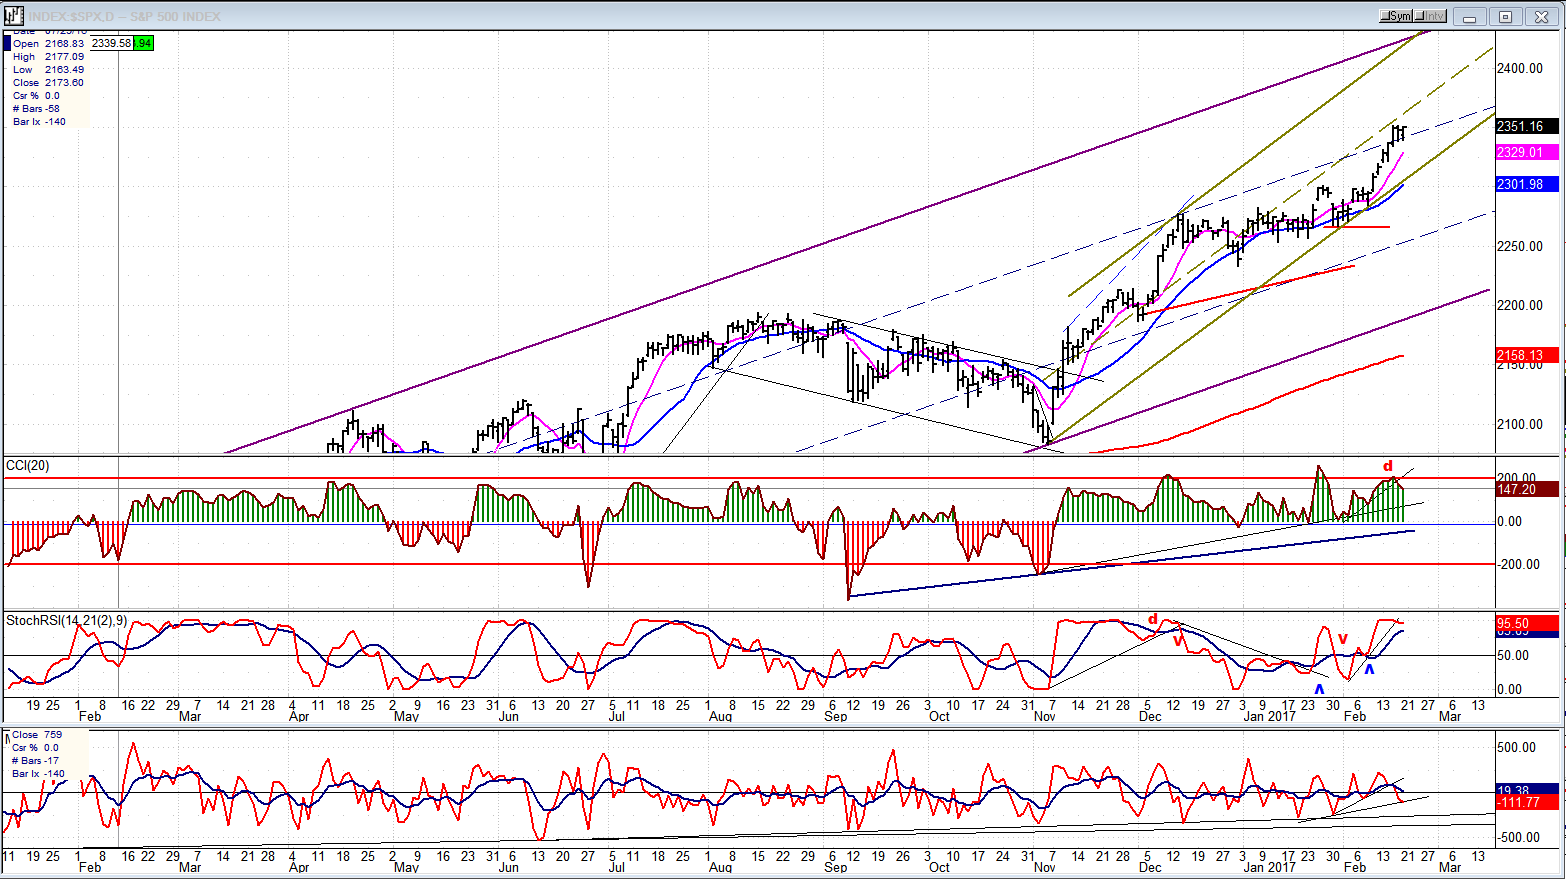
Daily Chart
By turning up and making a new high after a brief correction from 2300, SPX has clarified its long-term position and caused us to redraw trend and channel lines. What could have been interpreted as a diagonal from 1810 has been revised to a bullish, intermediate (purple) channel with the index currently having retraced 2/3rds of its width, where it has found near-term resistance and entered a minor consolidation pattern.
The price action has also formed another, short-term (green) channel which denotes the trend from the 2084 low of 11/04. A short-term correction should take place when the lower channel line is penetrated, and this should not be too far away considering the structure as well as a minor phase projection which should place a limit on the advance. The start of an intermediate correction which was considered a possibility after reaching 2300 will be delayed until higher prices (2400-2410? max) are reached.
The indicators appear to bear this out (especially on the hourly chart). Momentum indicators are both overbought and showing minor negative divergence, warning of a short-term correction; but an intermediate one will not take place until the top indicator becomes negative. We’ll then find out if prices can remain confined to the larger channel. Even if they are, they could still allow for a substantial correction.
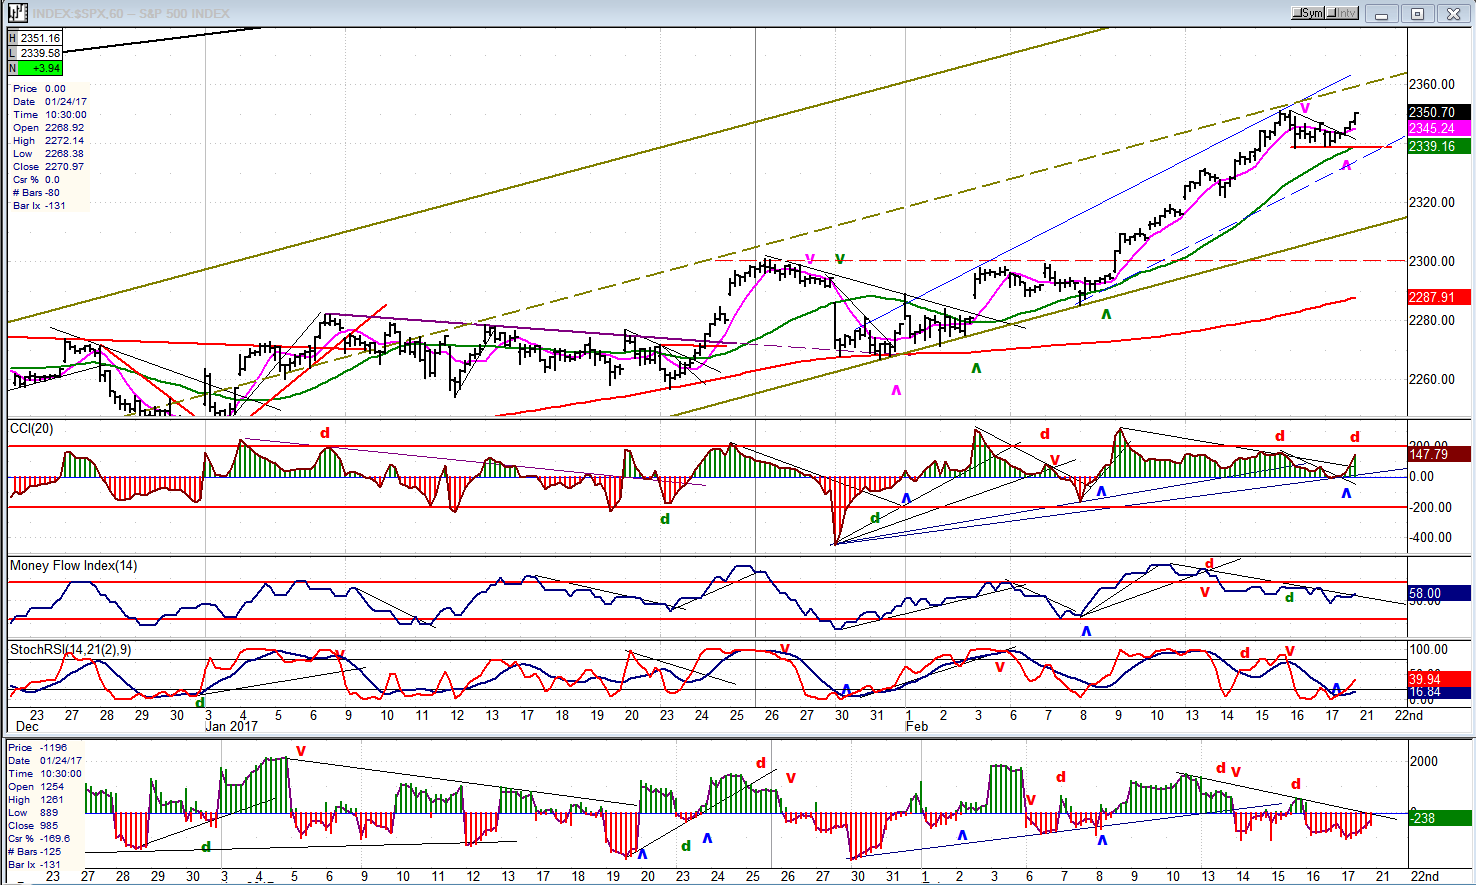
Hourly Chart
A more detailed view of the price action shows that the index met with resistance at the mid-channel line of the minor channel, pulled back, and consolidated for a few hours; then on Friday, attempted to resume its uptrend. It may be a little too soon to do so since only two of the indicators have turned up. The others remain in a downtrend with the A/Ds still negative.
If we are to go higher right away, we’ll need a good opening on Tuesday morning. In spite of the short consolidation, there has been enough accumulation on the P&F chart to reach the next minor objective. The retracement looks a little shallow; and down to 2330-35 would be more proportional as a correction level. But this is nitpicking within the larger context and of interest only to the day traders.
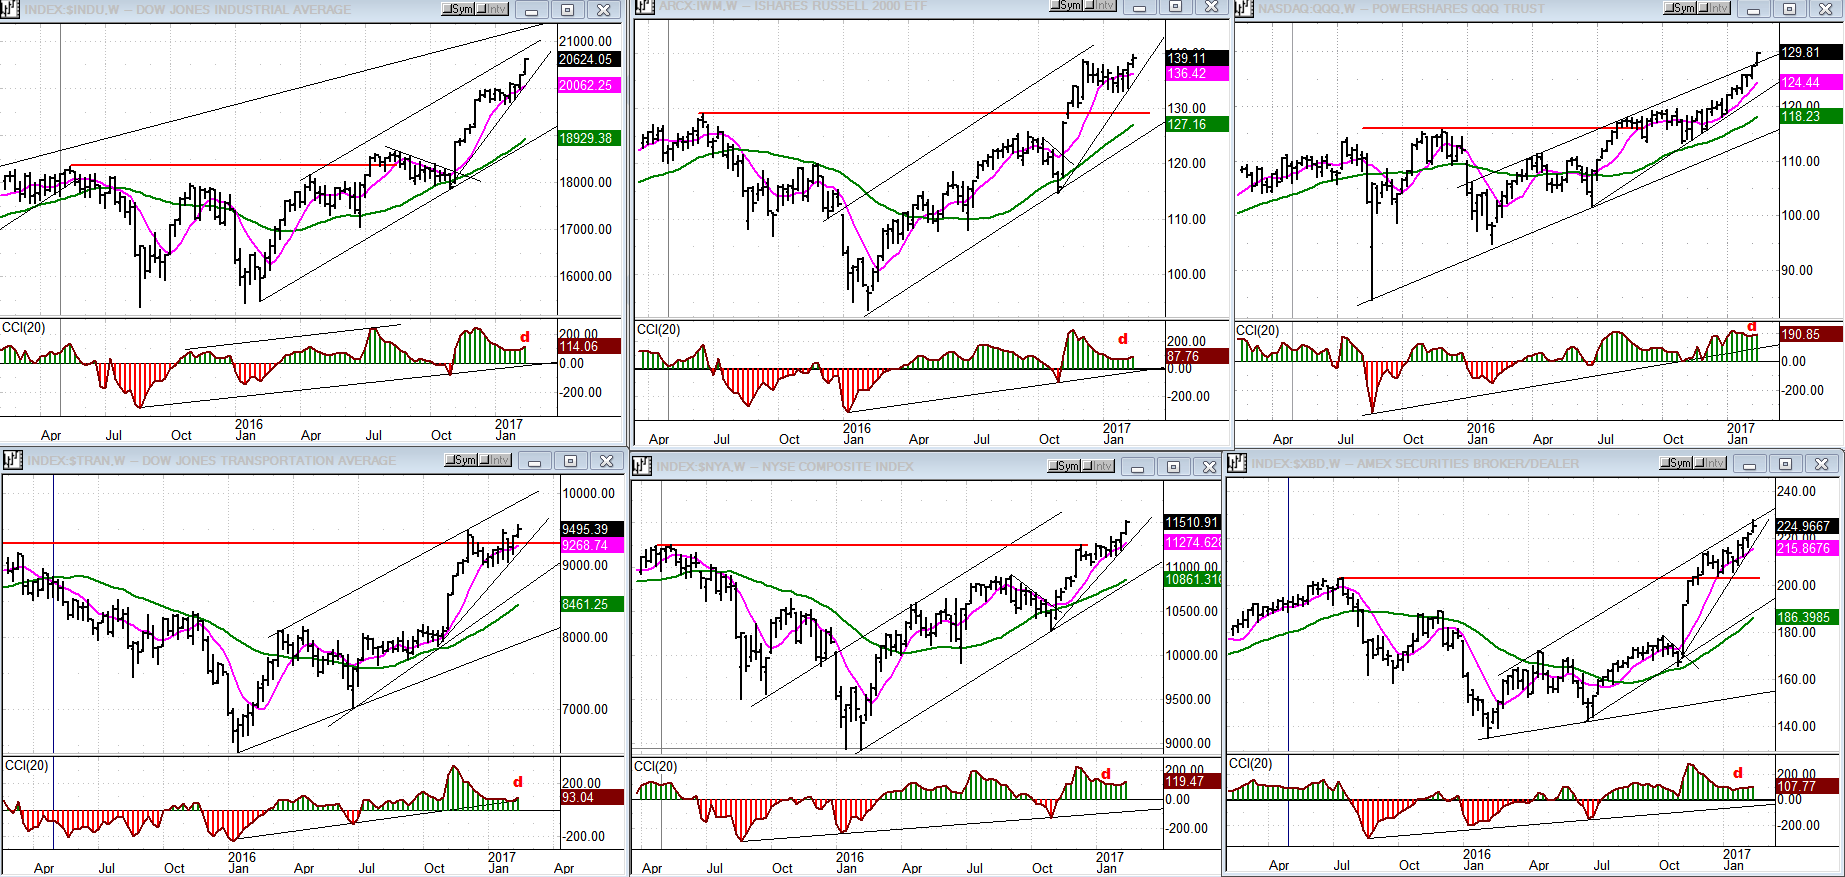
An Overview Of Some Important Indexes (Weekly Charts)
With all congestion levels that were developed over the past few weeks now clearly exceeded in the indexes shown here (except for IWM (center top) and TRAN (lower left) which are still lagging, but may catch up later) there is little question that the market is still in an uptrend since the beginning of 2016. They all have clear trendlines connecting their lows and we don’t have to worry about an important trend change until these trend lines are about to be challenged.
Note that the oscillators are all showing negative divergence. When they turn down, it will be a warning that they are about to break their secondary trend lines.
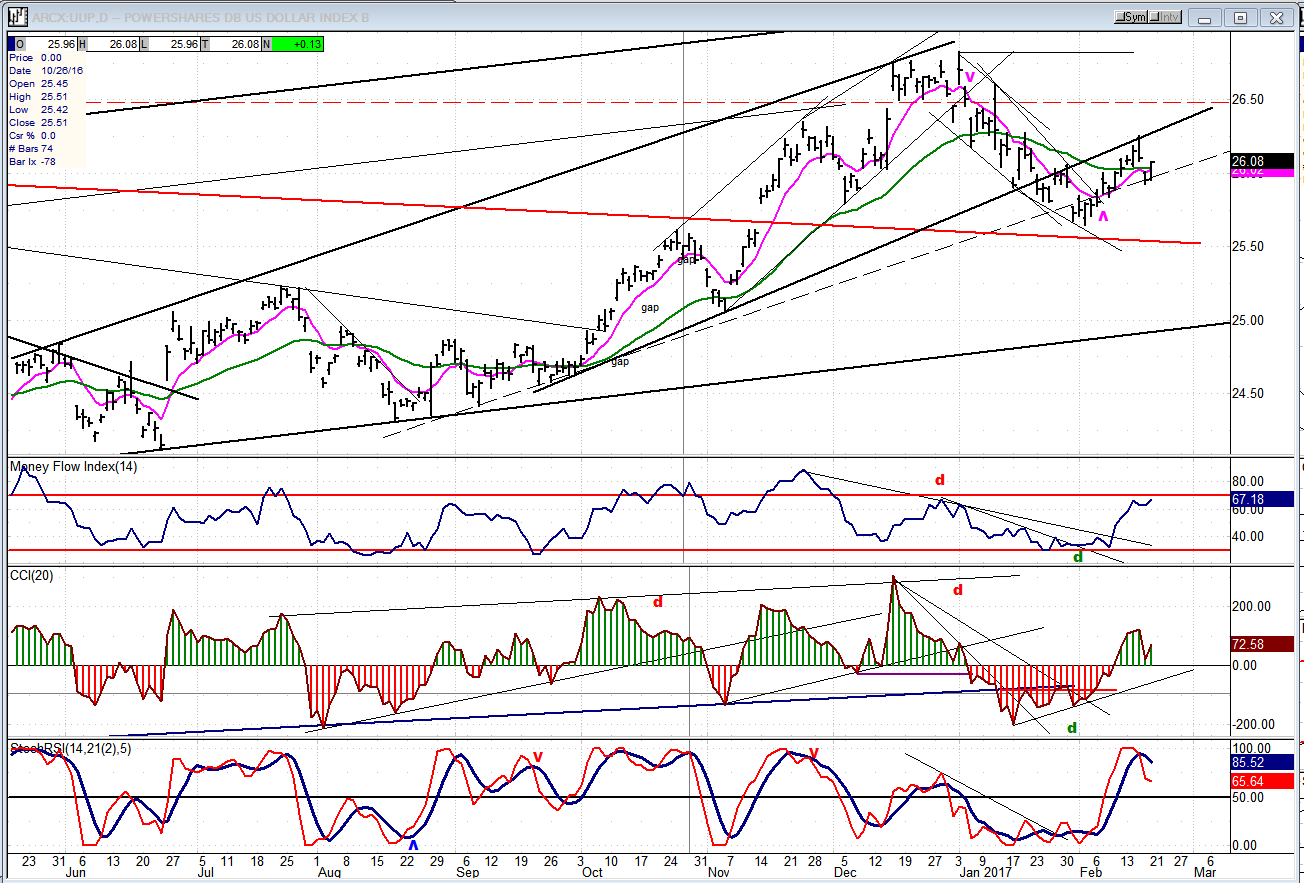
UUP (Dollar ETF)
UUP retraced 50% of its correction back to the broken trend line where it found resistance and reversed. There can be another attempt at rallying, but it’s unlikely to make much headway. More consolidation will be required before the index can eventually attain its full long-term projection.
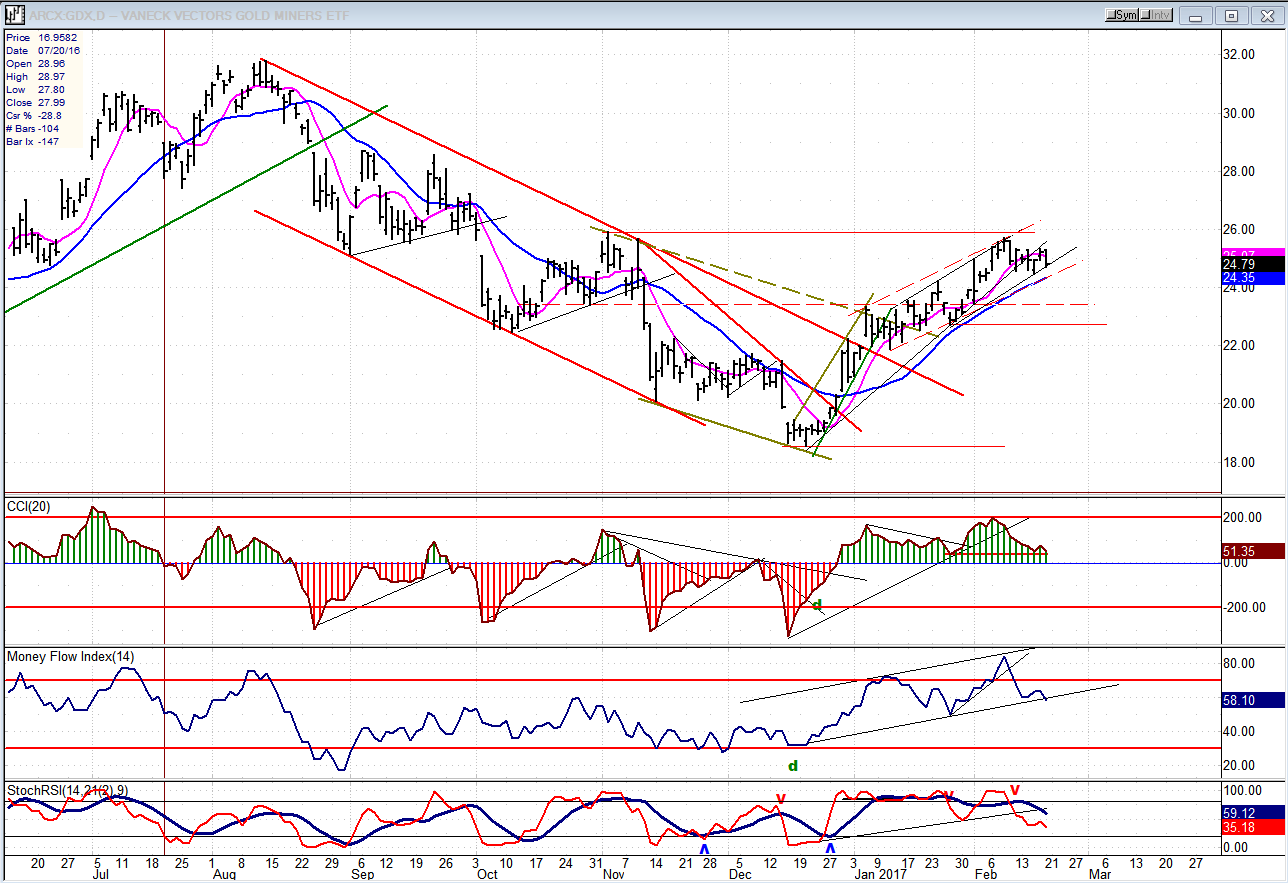
GDX (Gold Miners ETF)
GDX continues to consolidate and should bounce early next week after it reaches a cycle low, but the correction could continue until the beginning of March when a more dominant cycle bottoms.
Note: GDX is now updated for subscribers throughout the day, along with SPX.
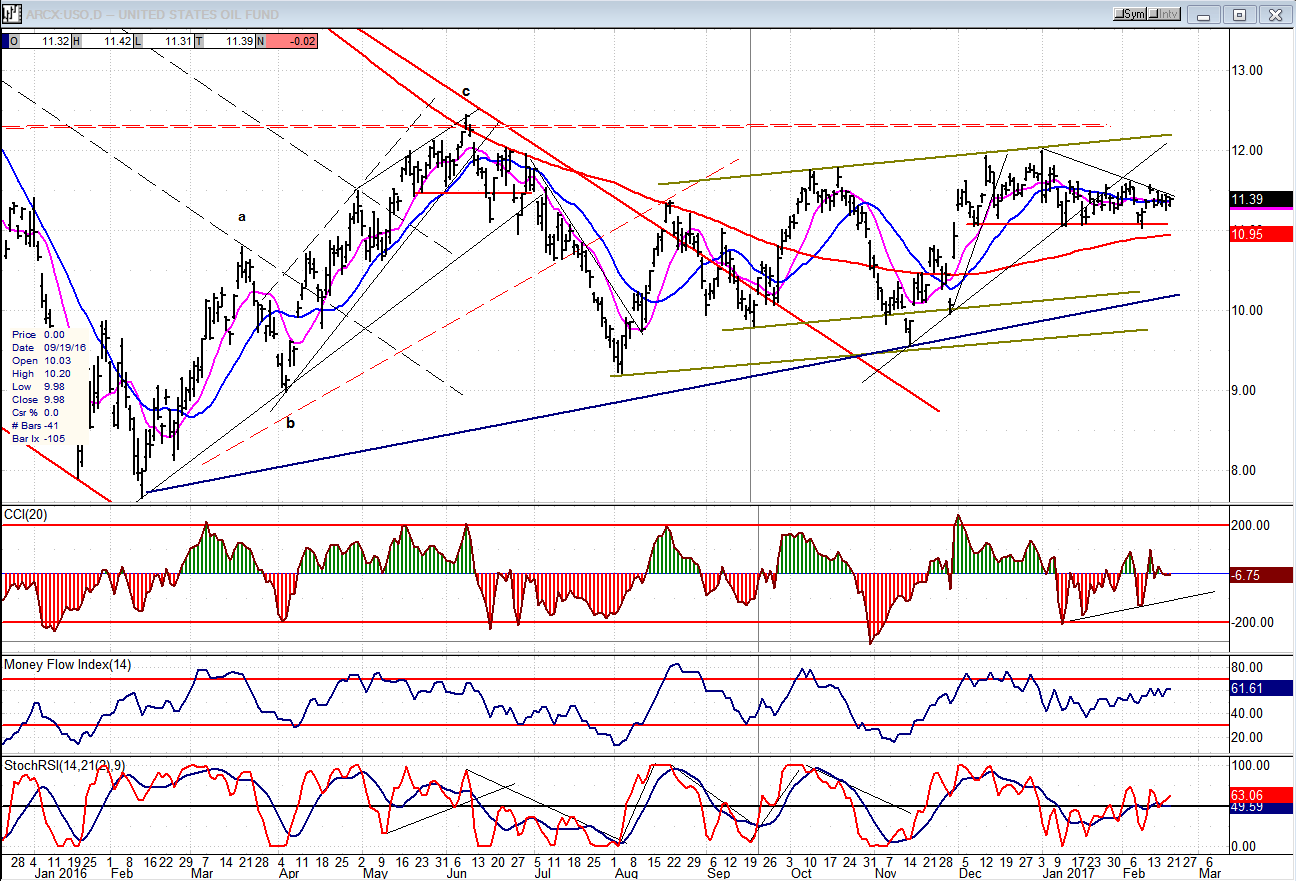
USO (US Oil Fund)
USO appears to be making a pattern in the form of a descending triangle. If it drops below the red support line, it should stabilize a little above 10.00, but risks going even lower if it cannot hold the main (blue) trend line.
Summary
With SPX firmly back in an uptrend, we can expect higher prices before the next significant reversal occurs.
********
For a FREE 4-week trial, send an email to [email protected], or go to www.marketurningpoints.com and click on “subscribe”. There, you will also find subscription options, payment plans, weekly newsletters, and general information. By clicking on "Free Newsletter" you can get a preview of the latest newsletter which is normally posted on Sunday afternoon (unless it happens to be a 3-day weekend, in which case it could be posted on Monday).
The above comments and those made in the daily updates and the Market Summary about the financial markets are based purely on what I consider to be sound technical analysis principles. They represent my own opinion and are not meant to be construed as trading or investment advice, but are offered as an analytical point f view which might be of interest to those who follow stock market cycles and technical analysis.

When Andre Gratian was a stock broker years ago, a friend introduced him to technical analysis of the market. Consequently, it is not an exaggeration to say that Andre fell in love with this approach! Ever since then, it has become an increasingly important part of his professional life. Gratian has studied the works of Wyckoff, Edwards & Magee, Edward J. Dewey (cycles) and many others. However, one of my most profitable undertaking has probably been to study Point & Figure charting, which he finds invaluable in analyzing stocks and indices. If he were restricted to one methodology, this is the one that he would choose. This well-rounded background has given him what he feels to be a special insight into the stock market, facilitating the recognition of meaningful patterns and the ‘turning points’ in all trends, whether they be short or long term. Andre feels very comfortable discussing the stock market and passing on meaningful information to others. His subscribers include individuals and money managers throughout the world. Moreover, his Newsletters are currently published on several financial sites, here and abroad.


