Technical Analysis Of The Markets


Current Position Of The Market
SPX Long-Term Trend: Uptrend continues.
SPX Intermediate-Trend: A minor reversal at 2300 has been followed by a resumption of the uptrend targeting the 2400 area.
Analysis of the short-term trend is done on a daily-basis with the help of hourly charts. It is an important adjunct to the analysis of daily and weekly charts which discuss longer market trends.
Sentiment At ‘Extreme Greed’
Market Overview
For the past few days, the Fear & Greed index has been alternating between “Greed” and “Extreme Greed”. Normally, it is not long after this labeling of the market sentiment that a trend reversal takes place. On Thursday and Friday, SPX tried to correct its short-term trend, but the bulls wouldn’t have it and, after a short dip, they sent prices back up toward the high. Structurally, we are due for a short down wave, and enough distribution has taken place at the 2360/2368 level for the index to enter a correction of some 30 points -- if the bears can get something started. Perhaps they will have better luck next week.
If they are successful, it should be only a short-term correction and not an important top quite yet. There is a higher count to about 2400+ that could complete the move which began at 2084, after which a more significant retracement should take place. This would be the decline that was expected (prematurely) to start from the 2300 level. A cycle analyst is pointing out that we are fast approaching the equivalent of the 17-year cycle peak which came on March 12, 2000. If he is right, we are near a significant market top. We should soon know!
To say that the market is overbought would be an understatement; and breadth, either viewed at the intermediate level with the New York Summation Index, or at the daily level through the McClellan Oscillator, is showing severe divergence, with the latter worsening every day.
Analysis (This chart and others below, are courtesy of QCharts.com.)
Daily Chart
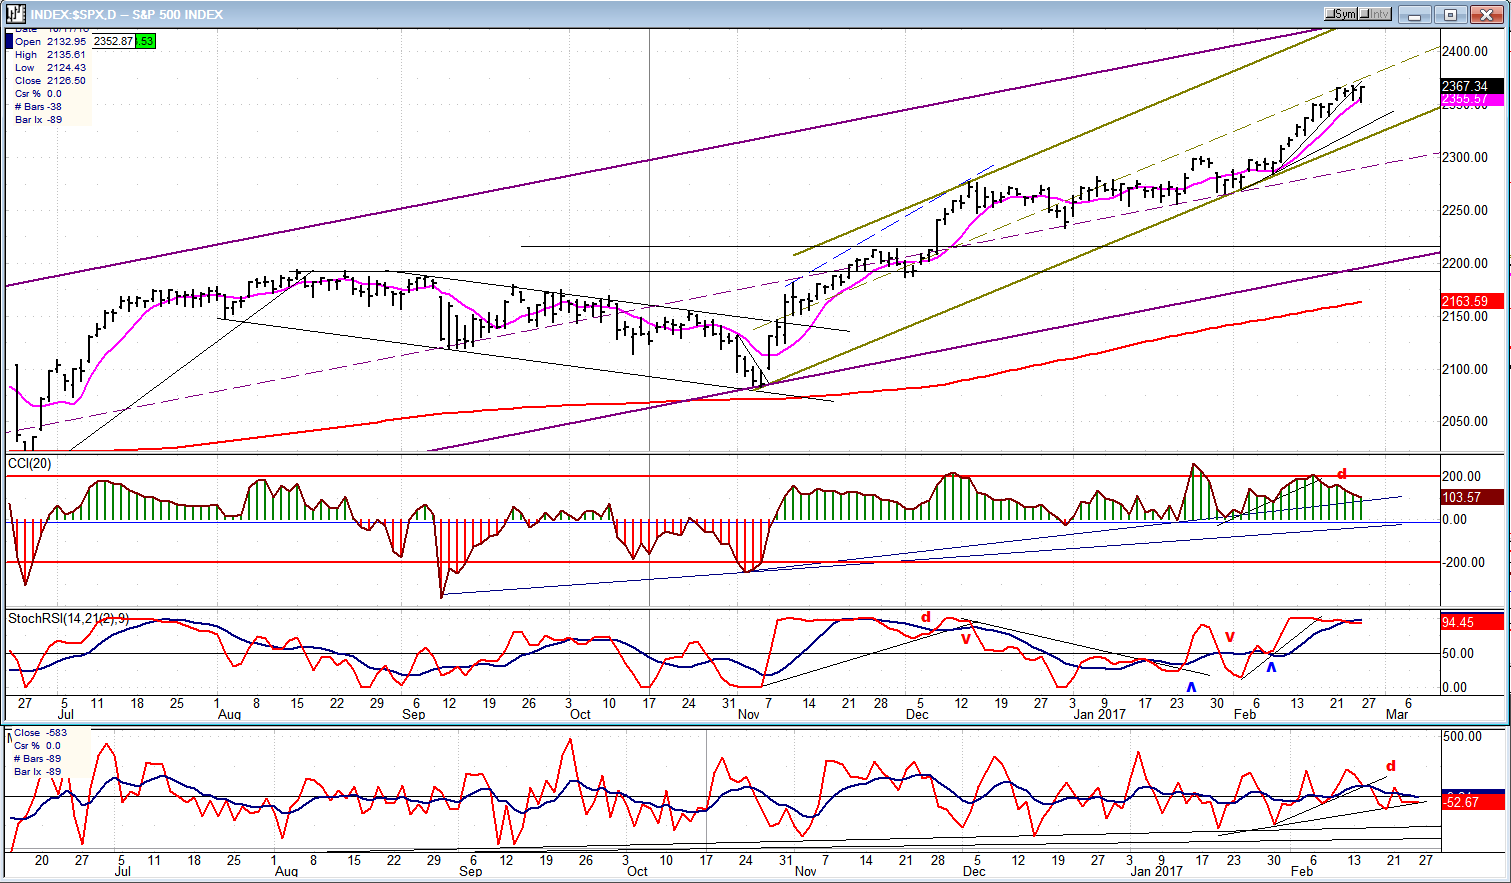
SPX is forming a channel within a larger channel. It is likely that it will not reach the tops of either over the short term. For now, the index is finding resistance at the mid-channel line of the steeper channel and, during the last four days has remained in a tight trading range. Now, the most likely action would be to pull back about 30 points before moving up to the 2400+ level to meet the next projection target. After that, a reversal would take it out of the green channel with a decline that would probably last until the low of the 20-wk cycle in the first week of April.
The lower trend line of the larger purple channel would, by then, be at about half the distance of the entire rally from 2084, providing logical, initial support for the correction (we should get a better fix on the downside target after the top distribution pattern has been completed). However, if we continued to decline below the channel line, it would be a warning that something more than a normal correction is taking place.
We don’t need the Fear and Greed index to tell us that we are near a top. The indicators are also warning us of the same thing. SRSI has been trading at its maximum reading for about two weeks, while the CCI has slowly gone in the opposite direction of price, increasing in negative divergence every day. But the A/D indicator (at the bottom) is the weakest of the three, having gone negative about a week ago, and looking ready to give a more convincing sell signal at any time.
Hourly Chart
From 2/8 SPX started a trend which has been interrupted by small corrections until it broke its first minor trend line. After pushing higher, on Thursday it broke the green trend line, dipped down a few points and back-tested the trend line before dropping lower on Friday, finding support on the dashed blue channel line from which it rallied once again until the close. It now has the choice of moving through the channel line and correcting approximately 30 points or, if the minor correction is already complete, moving higher in a choppy uptrend to the 2400+ projection target.
The oscillators have not been able to make a synchronized move on the downside, and the Money Flow indicator has just gone sideways. They did, however, all turn back up on Friday at the close, which should suggest a move higher near-term. A break below the dashed channel line with the oscillators turning down in unison would give us a short-term sell signal.

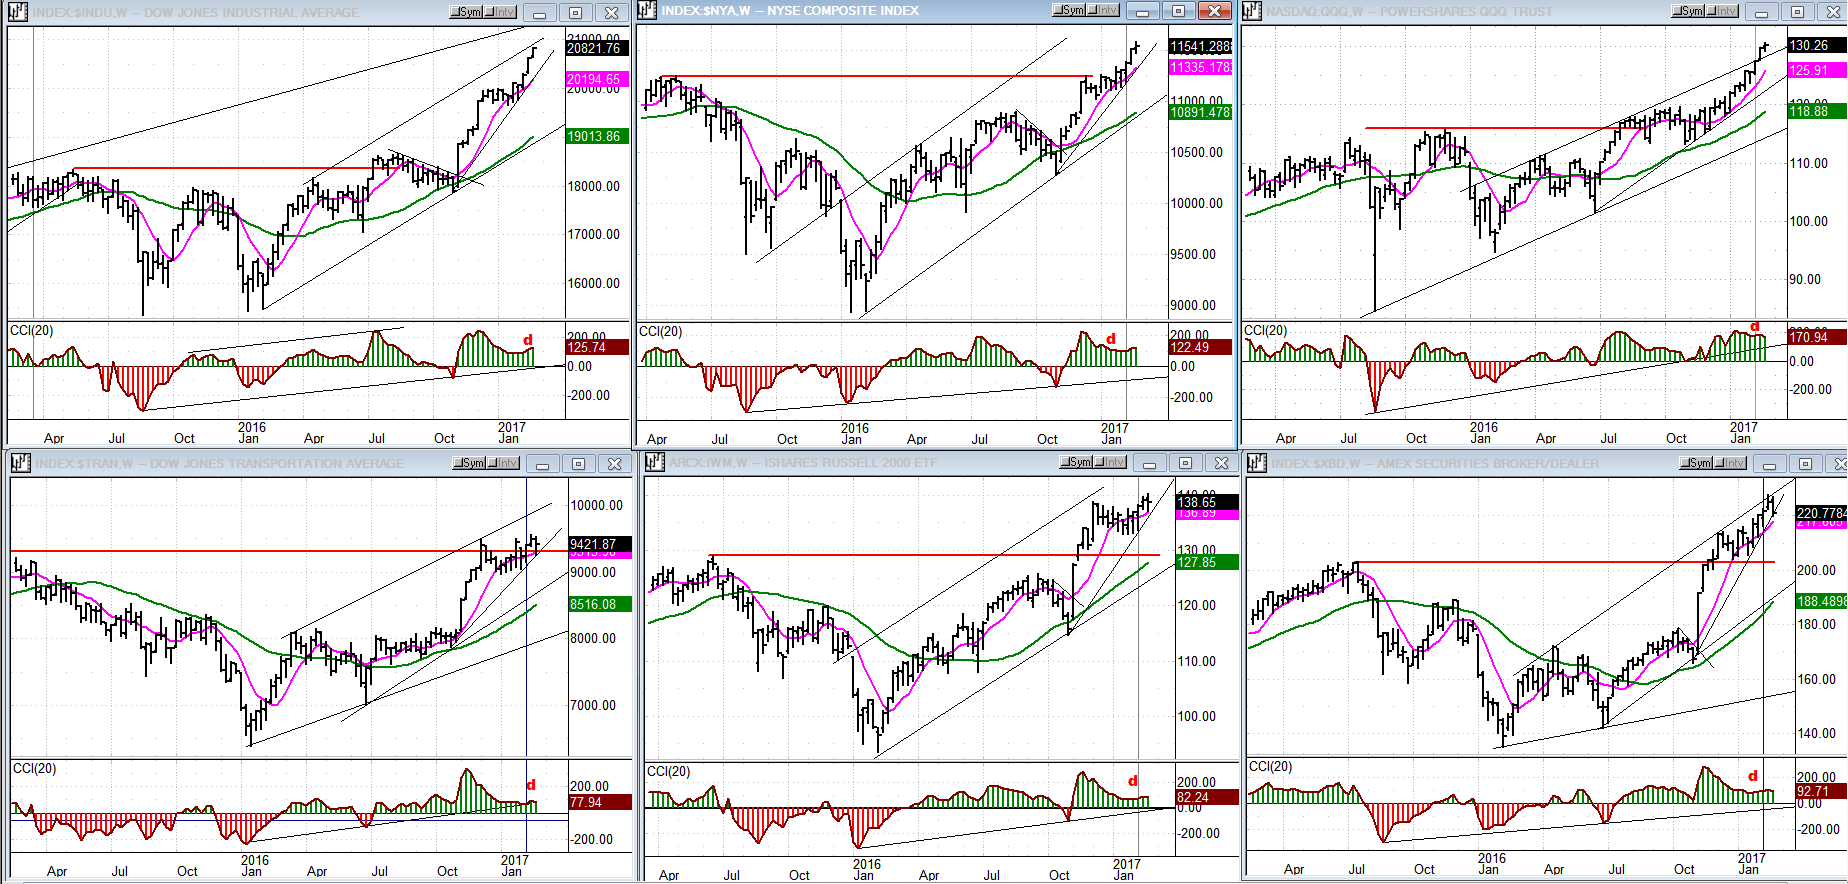
An Overview Of Some Important Indexes (Weekly Charts)
The weekly momentum is still up in all the indexes below, with the TRAN and IWM continuing to be the laggards. Since, as past market leaders, these two are ostensibly warning us of an approaching top, they should be the first to turn down when it has arrived.
UUP (Dollar ETF)
UUP has retraced 50% of its decline and is most likely approaching the end of its rally, but it could have another few days of distribution in this area before turning down to do some additional consolidation. There are higher projections for this index which will be invalidated only when it has confirmed that it has entered a major downtrend.

GDX (Gold Miners ETF)
GDX is at odds with gold which just made a new recovery high, but it is approaching what could be and important multi-cycle low that could extend its uptrend after another dip of about one point.
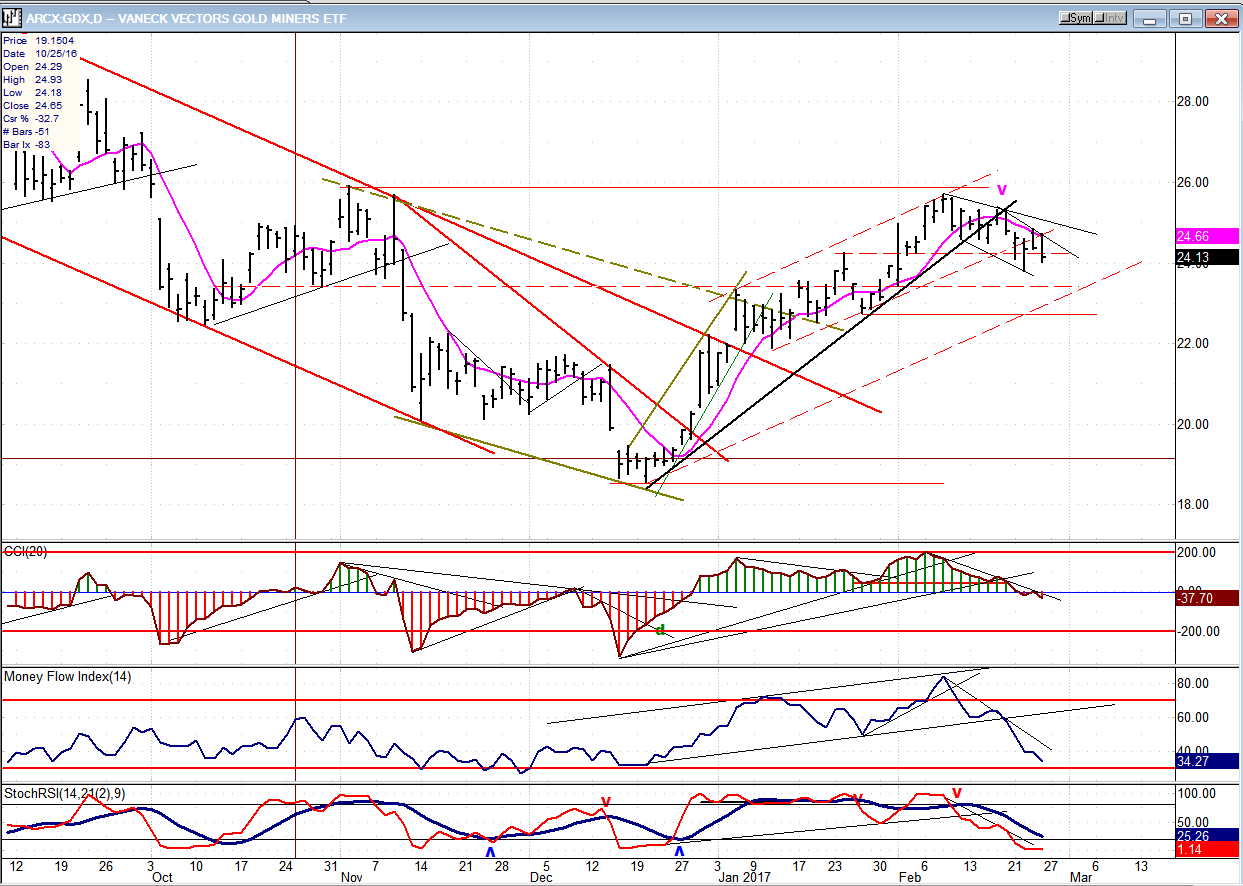
Note: GDX is now updated for subscribers throughout the day, along with SPX.
USO (US Oil Fund)
USO is still stuck in a range, either ready to extend its 90-day consolidation or preparing to re-test its low. We should soon know which it is; but with the current market condition calling for a correction in the near future, a move lower would seem to be the logical scenario.

Summary
Renewed stock market momentum beyond the SPX 2300 projection target has brought about and extreme in bullish sentiment which normally calls for a correction. IF, as a cycle analyst is forecasting, we are approaching the peak of the 17-year cycle (17 years from its former peak in March 2000) then the rally from 1810 is coming to an end and should be followed by a substantial price retracement. Many things do point to a correction. We’ll soon know how severe it will be after the distribution period has been completed.
********
For a FREE 4-week trial, send an email to [email protected], or go to www.marketurningpoints.com and click on “subscribe”. There, you will also find subscription options, payment plans, weekly newsletters, and general information. By clicking on "Free Newsletter" you can get a preview of the latest newsletter which is normally posted on Sunday afternoon (unless it happens to be a 3-day weekend, in which case it could be posted on Monday).
The above comments and those made in the daily updates and the Market Summary about the financial markets are based purely on what I consider to be sound technical analysis principles. They represent my own opinion and are not meant to be construed as trading or investment advice, but are offered as an analytical point f view which might be of interest to those who follow stock market cycles and technical analysis.

When Andre Gratian was a stock broker years ago, a friend introduced him to technical analysis of the market. Consequently, it is not an exaggeration to say that Andre fell in love with this approach! Ever since then, it has become an increasingly important part of his professional life. Gratian has studied the works of Wyckoff, Edwards & Magee, Edward J. Dewey (cycles) and many others. However, one of my most profitable undertaking has probably been to study Point & Figure charting, which he finds invaluable in analyzing stocks and indices. If he were restricted to one methodology, this is the one that he would choose. This well-rounded background has given him what he feels to be a special insight into the stock market, facilitating the recognition of meaningful patterns and the ‘turning points’ in all trends, whether they be short or long term. Andre feels very comfortable discussing the stock market and passing on meaningful information to others. His subscribers include individuals and money managers throughout the world. Moreover, his Newsletters are currently published on several financial sites, here and abroad.


