Technical Analysis Of The Markets


Current Position Of The Market
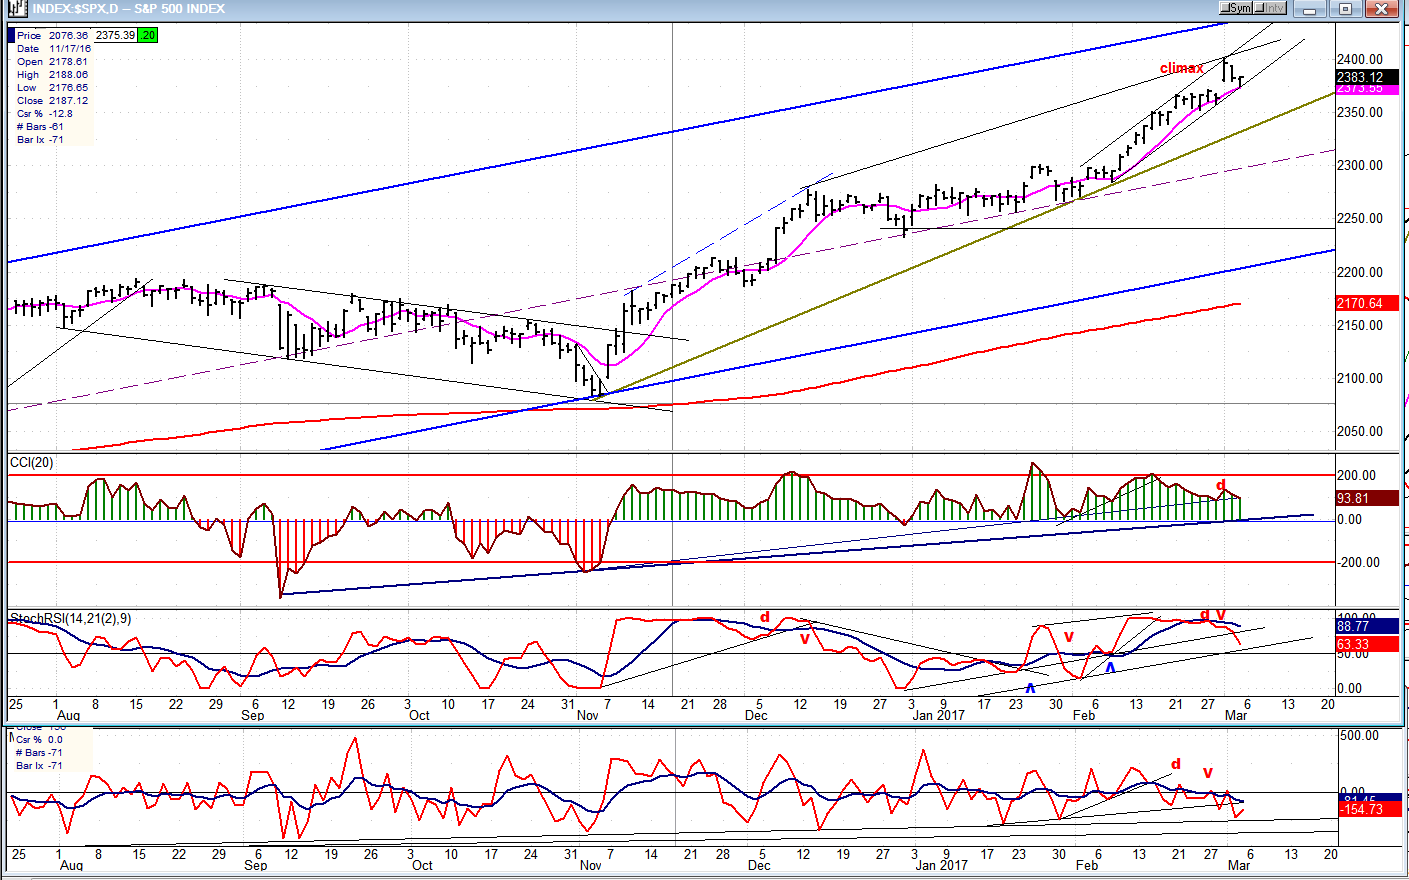
SPX Long-Term Trend: Uptrend continues.
SPX Intermediate-Trend: 2400 has been reached but the rally could extend just a little higher before an intermediate reversal takes place.
Analysis of the short-term trend is done on a daily-basis with the help of hourly charts. It is an important adjunct to the analysis of daily and weekly charts which discuss longer market trends.
2400 Projection Reached
Market Overview
Now that we have met the 2400 primary projection for this rally, let’s see if we are next going to try for its extension to about 2410. The reversal which started last Thursday had already drifted twenty points lower by Friday’s close and should have a lot more to go before it is over. But since the decline has stalled, it could be that we are preparing for one more up-move. The rally which started at 2084 is the last phase of a trend which had its origin at 1810. Simply retracing .382 of this last phase would be a 110-point decline. 50% would be about 160 points. Of course, if we go a little higher, this will have to be revised.
For an evaluation of the time this correction would take, there are three intermediate cycle lows ahead bottoming between early April and early May. So, between the Fibonacci measurement and the cycle analysis, we have at least a preliminary concept of how far the coming correction could travel and how long it could take. If there is another wave a little higher, we’ll simply make a few adjustments to the price projection. The time factor should remain the same.
Analysis (This chart and others below, are courtesy of QCharts.com.)
Weekly Chart
The main (purple) channel extends back to March 2009 and is the bull market channel which is still alive and well since SPX reached almost to its top with this move. The intermediate blue channel started at 1810 with the index trading at approximately the mid-point of the bull channel which is also a sign of market strength, as long as we keep trading in the upper portion of the bull channel. I have marked with a dashed red line the 50% retracement point of the final phase. Note that it ends at the bottom of the last consolidation phase where support was previously found.
I am also showing the estimated lows of the cycles mentioned above. These three cycles combined, with the 67-wk cycle as their center piece, should have no problem causing a .382 to 50% retracement of the last phase. The last time they made their lows in close proximity was in January of last year, when they caused a much deeper correction than the one we are currently expecting; but the two periods are not comparable. Back there, we were ostensibly forming wave IV of the bull market; whereby this time, we should be dealing with a correction of a much smaller degree. Nevertheless, let’s be cautious, especially since we are currently within a week of a precise 17-year period from the 2000 market top. The 17-year cycle is an important cycle and many analysts had expected it to make a low at this time, myself included. If this cycle is inverting (again?) we could be in a similar position as we were at that major top.
A look at the oscillators tells us that we have every reason to expect a correction. The two lower ones are super overbought, and the CCI is showing negative divergence. Of course, this is not the case with the MACD which is still accelerating upward, but I have found that the CCI is more sensitive and gives earlier warnings. Chances are that the SRSI and MF will have to drop back to the lower part of their range before the correction is finished.

Daily Chart
Since the pull-back into Friday found support on the daily trend line, it is possible that we could still get another small blip on the upside before we break it, especially since the trend line is being reinforced by the MA. There has already been a small bounce since we touched both on Friday. This has formed a crawling pattern best observed on the hourly chart which looks like a small flag. We’ll examine this more closely when we analyze it.
Since the best clues about what lies next are on that chart, let’s just take a look at the oscillators, and move on. The A/Ds showed some negative divergence as early as two weeks ago, and gave a sell signal on Friday when they broke the uptrend line and dipped well below zero. The SRSI showed negative divergence at the top and gave an initial sell signal on Thursday, but must drop below 50 to confirm. The CCI is also showing divergence but must break its secondary trend line (at a minimum), to give a sell signal. Let’s now look at the hourly chart.
Hourly Chart
Here, we can examine more closely the last phase of the advance which starts at 2357. On Friday, the index did not drop all the way down to the channel line, but stopped on a secondary trend line a few points higher from which it crawled up all day Friday. It will need to drop lower so that it can challenge the main trend and channel lines of the advance from 2357, and then we’ll have to confront all the support between 2350 and 2370. That could hold up prices for a little while before the correction begins in earnest or, since the cycle lows are near, we could drive through all at once after the rally has completed.
Although all the oscillators and the A/Ds gave a concerted sell signal Thursday, Friday’s crawling pattern has arrested their declines and started to place them in a potential rally position. This means that there could still be another small phase up. Until the daily oscillators are in definite sell mode, we could still push a little higher, or at least re-test the high.

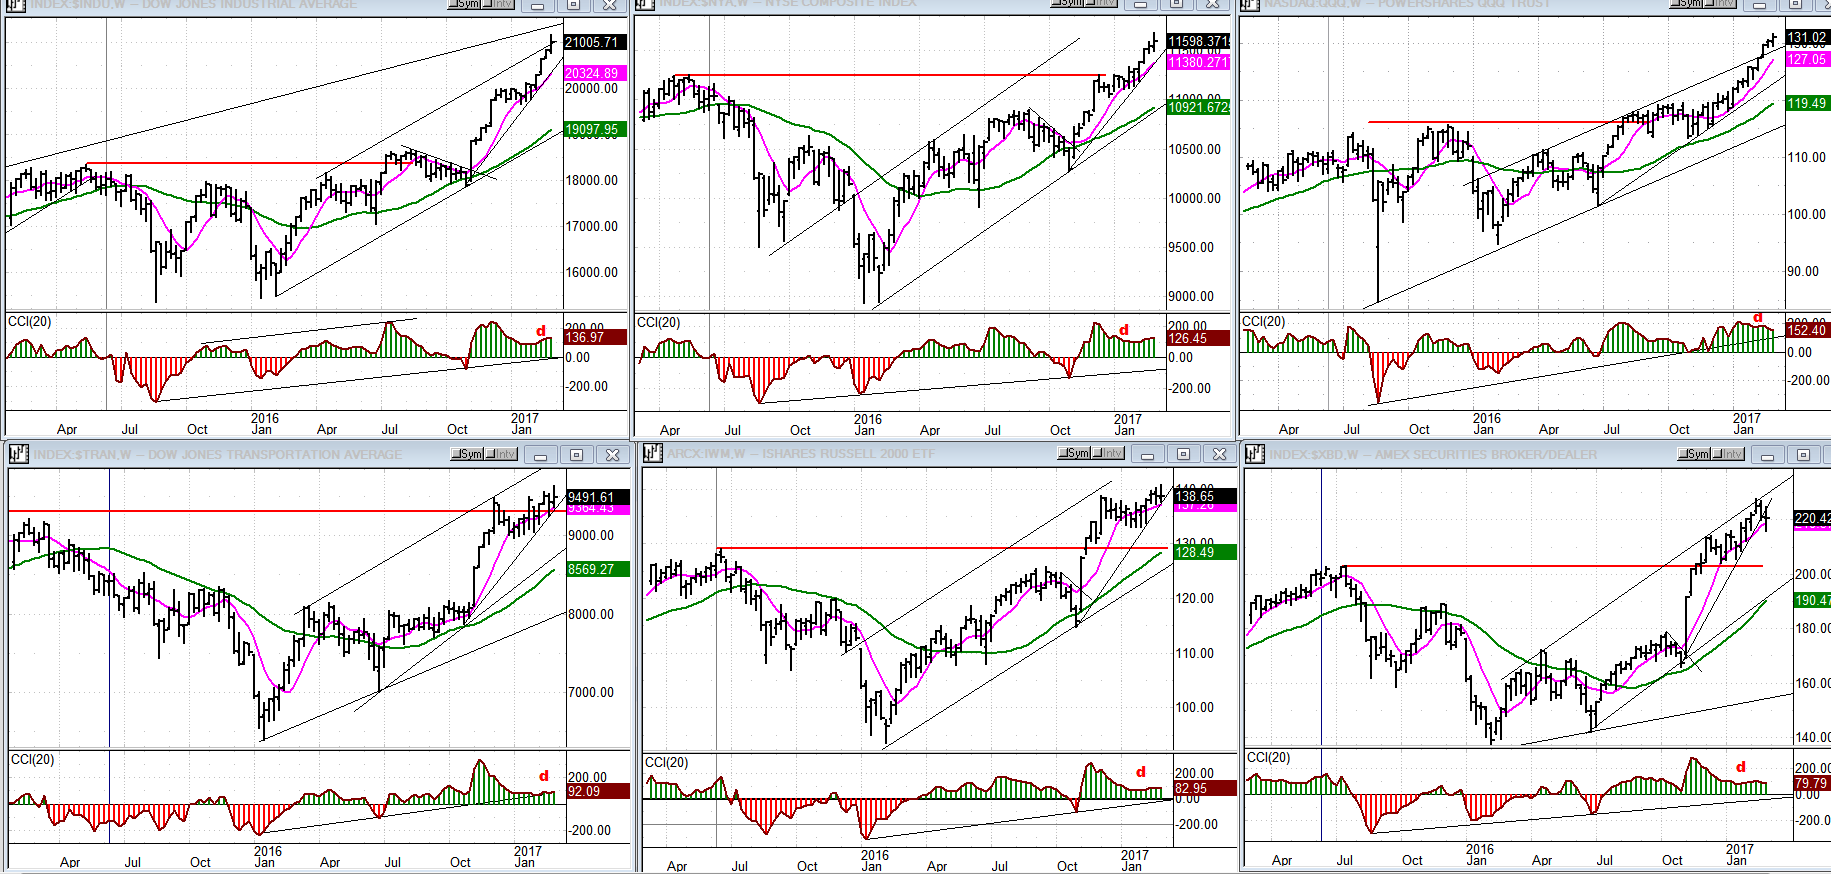
An Overview Of Some Important Indexes (Weekly Charts)
I have divided this group of leading/confirming indexes into two groups: the strongest ones (on top), and the weakest (on the bottom). There is not much to be garnered from last week’s action, except that we are still looking for confirmation of an intermediate top. This should first begin to show in the lower group when they turn down and start to move toward their last consolidation level.
UUP (Dollar ETF)
UUP continues to back-test its broken trend line and to be pushed away every time that it does. There are no clear indications that it has completed this pattern, and may not put an end to it until the Fed announces a rate hike on the 15th. The most likely future action will be to pull back in a c-wave pattern before attempting to make a new high. Only if it breaks above the broken trend line in a show of renewed momentum will it look as if it is ready to challenge its former high.

GDX (Gold Miners ETF)
GDX is at an interesting juncture where two cycles are making their lows -- possibly simultaneously. The 25-day cycle was expected to bottom either Friday or Monday. The 82-84 weekly cycle has now completed 82 weeks, and will enter its 83rd next week.
On Friday, the daily cycle appeared to have bottomed, but the close makes this questionable. There are two possibilities. It already has and will re-test on Monday, or it already has and it will be pulled lower by the weekly which is still bottoming. We’ll know better tomorrow.
The P&F chart suggests that the projection has been met at 22, although there is an outside chance that we could still drop to 20.50-21.00.
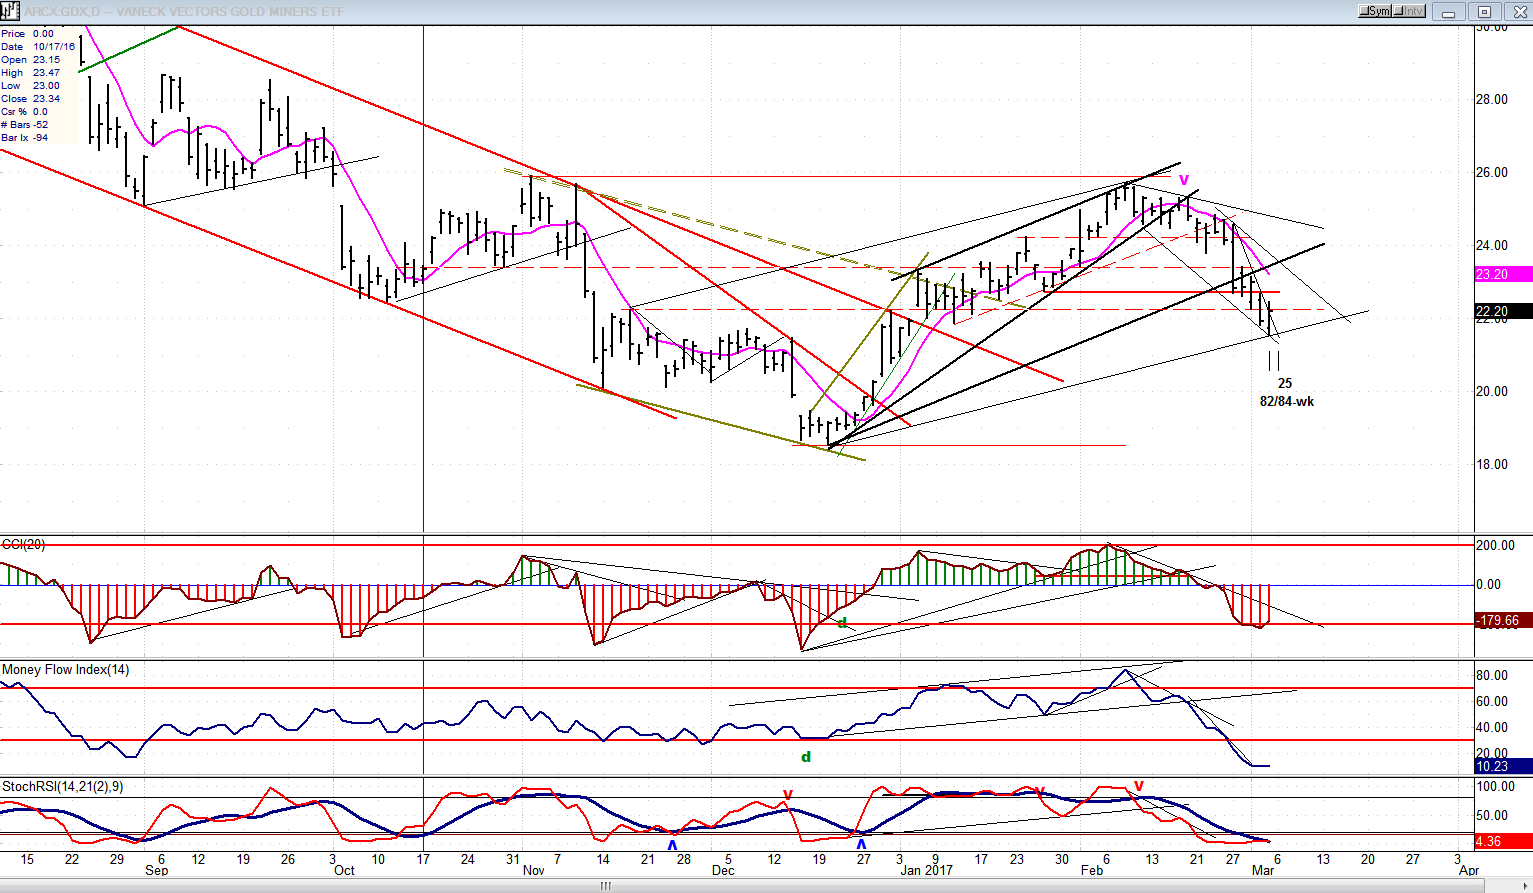
Note: GDX is now updated for subscribers throughout the day, along with SPX.
USO (US Oil Fund)
USO has gone nowhere for several weeks and may be ready to break down, which would be logical if the market begins to correct.

Summary
SPX has reached its primary objective of 2400 and pulled back. There is a 2410 adjunct which could still be reached if the index can regain its upside momentum starting Monday. The daily indicators have still not given a sell signal, and the hourly appear to have completed their correction. So, Monday will be key in deciding which comes next. Structurally, there is a bias for a slightly higher high.
*********
For a FREE 4-week trial, send an email to [email protected], or go to www.marketurningpoints.com and click on “subscribe”. There, you will also find subscription options, payment plans, weekly newsletters, and general information. By clicking on "Free Newsletter" you can get a preview of the latest newsletter which is normally posted on Sunday afternoon (unless it happens to be a 3-day weekend, in which case it could be posted on Monday).
The above comments and those made in the daily updates and the Market Summary about the financial markets are based purely on what I consider to be sound technical analysis principles. They represent my own opinion and are not meant to be construed as trading or investment advice, but are offered as an analytical point f view which might be of interest to those who follow stock market cycles and technical analysis.

When Andre Gratian was a stock broker years ago, a friend introduced him to technical analysis of the market. Consequently, it is not an exaggeration to say that Andre fell in love with this approach! Ever since then, it has become an increasingly important part of his professional life. Gratian has studied the works of Wyckoff, Edwards & Magee, Edward J. Dewey (cycles) and many others. However, one of my most profitable undertaking has probably been to study Point & Figure charting, which he finds invaluable in analyzing stocks and indices. If he were restricted to one methodology, this is the one that he would choose. This well-rounded background has given him what he feels to be a special insight into the stock market, facilitating the recognition of meaningful patterns and the ‘turning points’ in all trends, whether they be short or long term. Andre feels very comfortable discussing the stock market and passing on meaningful information to others. His subscribers include individuals and money managers throughout the world. Moreover, his Newsletters are currently published on several financial sites, here and abroad.


