Technical Analysis Of The Markets


Current Position of the Market
SPX Long-term trend: Uptrend continues.
SPX Intermediate trend: Reaching 2400 has brought about a correction, but 2410 is still a remote possibility.
Analysis of the short-term trend is done on a daily-basis with the help of hourly charts. It is an important adjunct to the analysis of daily and weekly charts which discuss longer market trends.
Unconfirmed Intermediate Top
Market Overview
In the last letter, I mentioned that I had a P&F projection to 2400 and that, after a correction, there was a possibility that it could be followed by a push a little higher to about 2410. So far, so good! Reaching the target brought a forty-five-point retracement but, because it found support just above the main trend line, we still do not have confirmation that we have started a correction of intermediate proportion. Until we break that trend line, an extension of the rally from 2084 to a higher high could still be ahead. However, the intermediate cycle lows which are due between April and May are just around the corner and are increasing their downward pressure on prices every day. This should soon cause another reversal and a continuation of the downtrend.
On Friday, assisted by a good jobs report, the rally which started the previous day retraced exactly 50% of the forty-five-point decline before pulling back to fill the opening gap, but we moved up again into the close. Monday will be a decision day. If we can regain upside momentum, there has been enough re-accumulation to take us slightly beyond 2400. This would also make the wave three structure more complete. If we do this early next week, there would still be plenty of time for the cluster of bottoming cycles to generate a significant correction. We’ll be able to get a better idea of its extent after we see how much distribution has taken place in the top area.
Daily Chart
The uptrend which started at 1810 has formed a wide (blue) channel, which is itself an intermediate channel contained within the bull market channel. The top of the blue channel is identified by two dashed lines. The heavy line at the top connects with the April 2016 top, while the lighter line is drawn across the August top. The lower line is where the rally from 2084 met its 2400 target and pulled back. The fact that we were not able to get all the way to the top channel line is a sign of long-term deceleration which could be the beginning of a rounding top. It’s not something that we should worry about right away, but we should keep it in mind for future reference.
Within the larger channel, there is a secondary one which starts are 2084. This is the trend which we are currently analyzing and are trying to decide when and at what price it will come to an end. Note how the rally ended: on the last day, there was a gap that is most likely an exhaustion gap which caused a climactic end of the uptrend, followed by an immediate reversal. However, since we did not gap down to form an island reversal, we cannot be certain that we have seen the top, and this is why we’ll need to wait until we see what the index does on Monday. If we turn back down right away, the odds of coming through the trend line and resuming the decline will greatly increase. However, if we can get past the pink MA, the odds will shift to possibly making a higher high.
The bottom two oscillators gave a sell signal right away and quickly became oversold. They have now turned, but not conclusively yet. Of more interest is the top indicator which never did break its uptrend line and became negative. If it had, we would already be in a downtrend. For a confirmed sell signal, it is key for this oscillator to go negative.

Hourly Chart
After the index reached its projection and reversed, it first broke a trend line, then moved through the black channel. It found support at the lows of the previous consolidation and on the greenish trend line from 2084. On Friday morning, it gapped open after the jobs report was released, found resistance below the broken channel line, closed the gap, and moved up again. That second move up into the close was without real conviction, so I am not sure that we can make a new recovery high on Monday, as well as get back inside the black channel. The coup de grace for the rally from 2084 would be turning down and going through the greenish line as well as Thursday’s low. The next support would be at the (red) 200-hr MA, and would only be temporary.
On the hourly chart, the top oscillator is still the main one to watch for a buy and sell signal. All three are currently in an uncertain uptrend, and they should all turn down together for a sell signal.

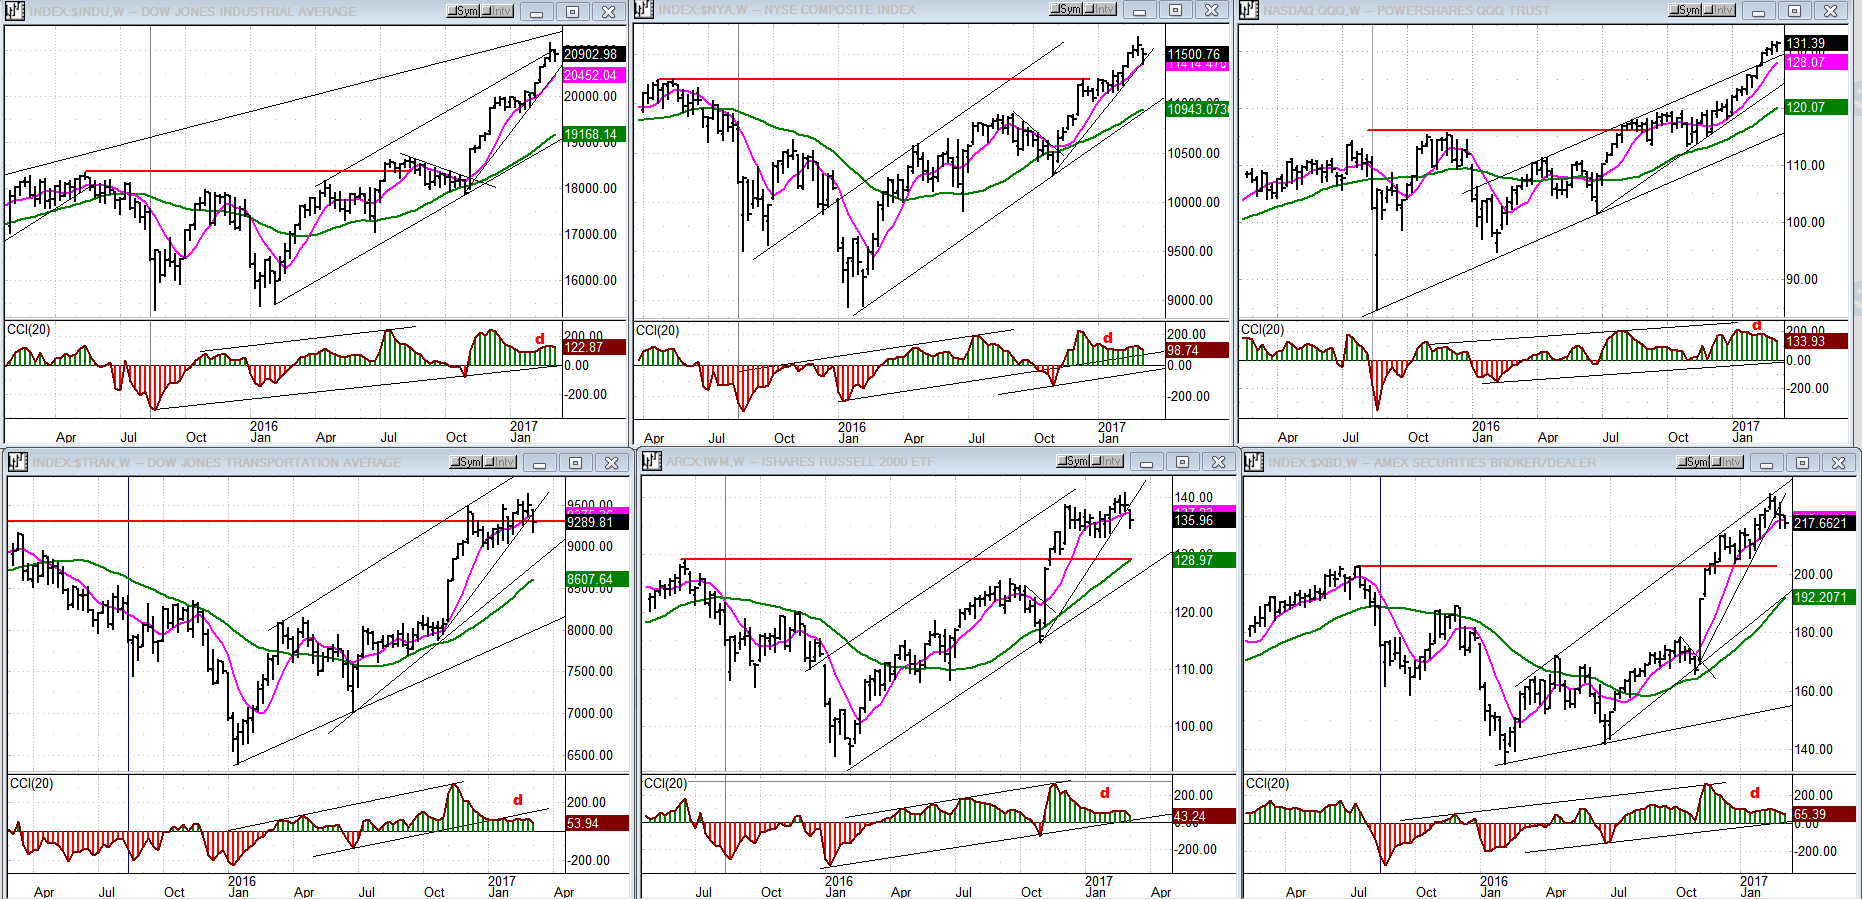
An Overview Of Some Important Indexes (Weekly Charts)
At the weekly level, charts do not show changes very quickly and last week’s pull-back does not look significant in the upper tier, which is comprised of the strongest indexes. It is more noticeable on the lower indexes which are overall less strong and where market weakness should show more readily. The red line denotes the level of the former all-time high. This identifies the transportation index as the weakest over the long-term. On an intermediate term, the IWM is just as weak, and the XBD not much stronger. Nevertheless, all are still in long-term uptrends and will need to show more negative patterns before we can consider an end to the bull market.
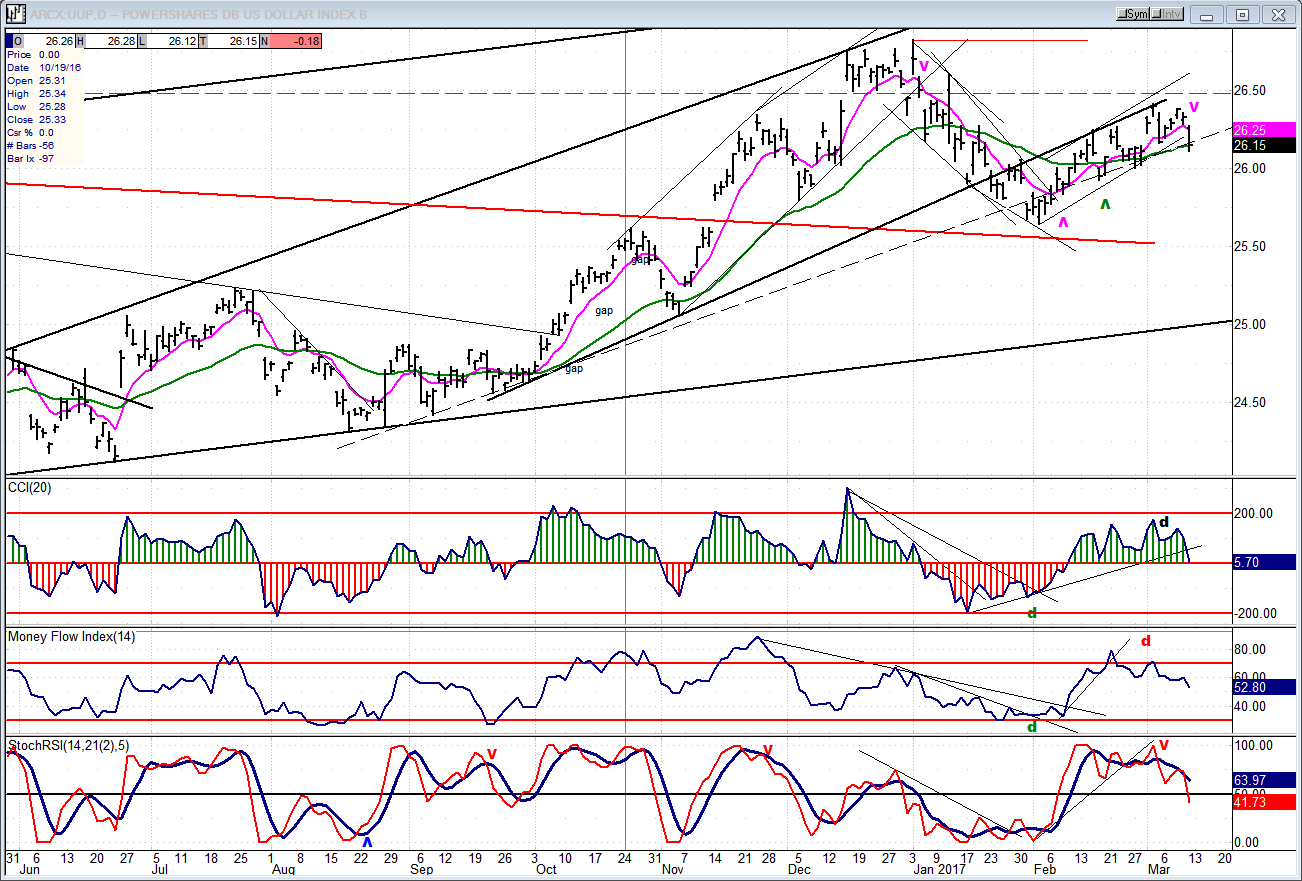
UUP (Dollar ETF)
UUP had a serious pull-back last week, and how this is reflected in the indictors means that it could be starting on the c-wave of its intermediate correction. We’ll need a little more confirmation.
GDX (Gold Miners ETF)
With the 25-day cycle turning up, and perhaps the 84-wk as well -- although the latter will require more confirmation -- GDX was able to close at its best level in a week. That puts it at a resistance level which may have marked an interruption to this rally off the low. Once that resistance is overcome, the index can go on to challenge the correction channel line which is currently at about 22.50. This could limit the “break-out” move for now, since the P&F chart suggests that a base must first be established before attempting to resume the intermediate uptrend. Even if the 84-wk cycle has bottomed, this is not a guarantee that we are ready to extend the uptrend which started last year, or even that we have seen the final low of this move.

Note: GDX is now updated for subscribers throughout the day, along with SPX.
USO (US Oil Fund)
USO has done what the chart pattern suggested. I mentioned that this looked like a descending triangle which, if resolved to the downside, could cause it to drop back to its long-term trend line, and perhaps farther. Since the basic price projection for this type of pattern has essentially been met, USO could find support in this area and continue its long-term base-building process.

Summary
Filling the 2400 count has caused the expected profit-taking, which sent SPX into a quick retracement of 45 points. This brought it to the trend line from 2084 which must be broken before we can extend the correction into something more intermediate.
There are three intermediate cycles bottoming between April and May which should pull it down farther, but until the trend line is broken, we do not have a confirmation that the correction has actually started, especially since the index must first prove that it is incapable of reaching its alternate target of about 2410. In a strong market, even the influence of important cycles can be diminished, but we should be able to estimate what they can do when the distribution phase is complete and we can calculate the extent of the correction.
********
For a FREE 4-week trial, send an email to [email protected], or go to www.marketurningpoints.com and click on “subscribe”. There, you will also find subscription options, payment plans, weekly newsletters, and general information. By clicking on "Free Newsletter" you can get a preview of the latest newsletter which is normally posted on Sunday afternoon (unless it happens to be a 3-day weekend, in which case it could be posted on Monday).
The above comments and those made in the daily updates and the Market Summary about the financial markets are based purely on what I consider to be sound technical analysis principles. They represent my own opinion and are not meant to be construed as trading or investment advice, but are offered as an analytical point f view which might be of interest to those who follow stock market cycles and technical analysis.

When Andre Gratian was a stock broker years ago, a friend introduced him to technical analysis of the market. Consequently, it is not an exaggeration to say that Andre fell in love with this approach! Ever since then, it has become an increasingly important part of his professional life. Gratian has studied the works of Wyckoff, Edwards & Magee, Edward J. Dewey (cycles) and many others. However, one of my most profitable undertaking has probably been to study Point & Figure charting, which he finds invaluable in analyzing stocks and indices. If he were restricted to one methodology, this is the one that he would choose. This well-rounded background has given him what he feels to be a special insight into the stock market, facilitating the recognition of meaningful patterns and the ‘turning points’ in all trends, whether they be short or long term. Andre feels very comfortable discussing the stock market and passing on meaningful information to others. His subscribers include individuals and money managers throughout the world. Moreover, his Newsletters are currently published on several financial sites, here and abroad.


