Technical Analysis Of The Markets


Current Position of the Market
SPX Long-term trend: Uptrend continues.
SPX Intermediate trend: The correction from 2400 continues,
Analysis of the short-term trend is done on a daily-basis with the help of hourly charts. It is an important adjunct to the analysis of daily and weekly charts which discuss longer market trends.
Cyclical Correction Underway
Market Overview
The correction from SPX 2400 is caused by intermediate cycles which will not make their lows until late April, early May. The first phase took the index down to 2323 for a seventy-seven-point loss. Last week, the next phase was a rebound of forty-seven points to 2370 which may or may not be complete. The level reached represents the lower portion of a target zone which extends to 2474 and, in spite of three separate unsuccessful attempts at exceeding 2370 and closing on its low of the day, SPX failed to give a confirmed short-term sell signal. We’ll have to wait until Monday for a decision.
Of the three cycles, the one which just reversed is the most reliable, so the others will have to prove themselves. However, structure appears to point to more correction ahead. In spite of last week’s rally, the daily indicators are still in a sell mode, and the weekly indicators have turned down but are only correcting and have not given a sell signal at the weekly time frame.
When this correction began, I indicated that I did not expect a major decline. Last week’s rally has already shown that it will be in the form of an intermediate consolidation/correction. Nevertheless, we should expect new lows to be made before it is over. And, with the final low not scheduled for a few more weeks, we could enter a volatile period over the immediate future.
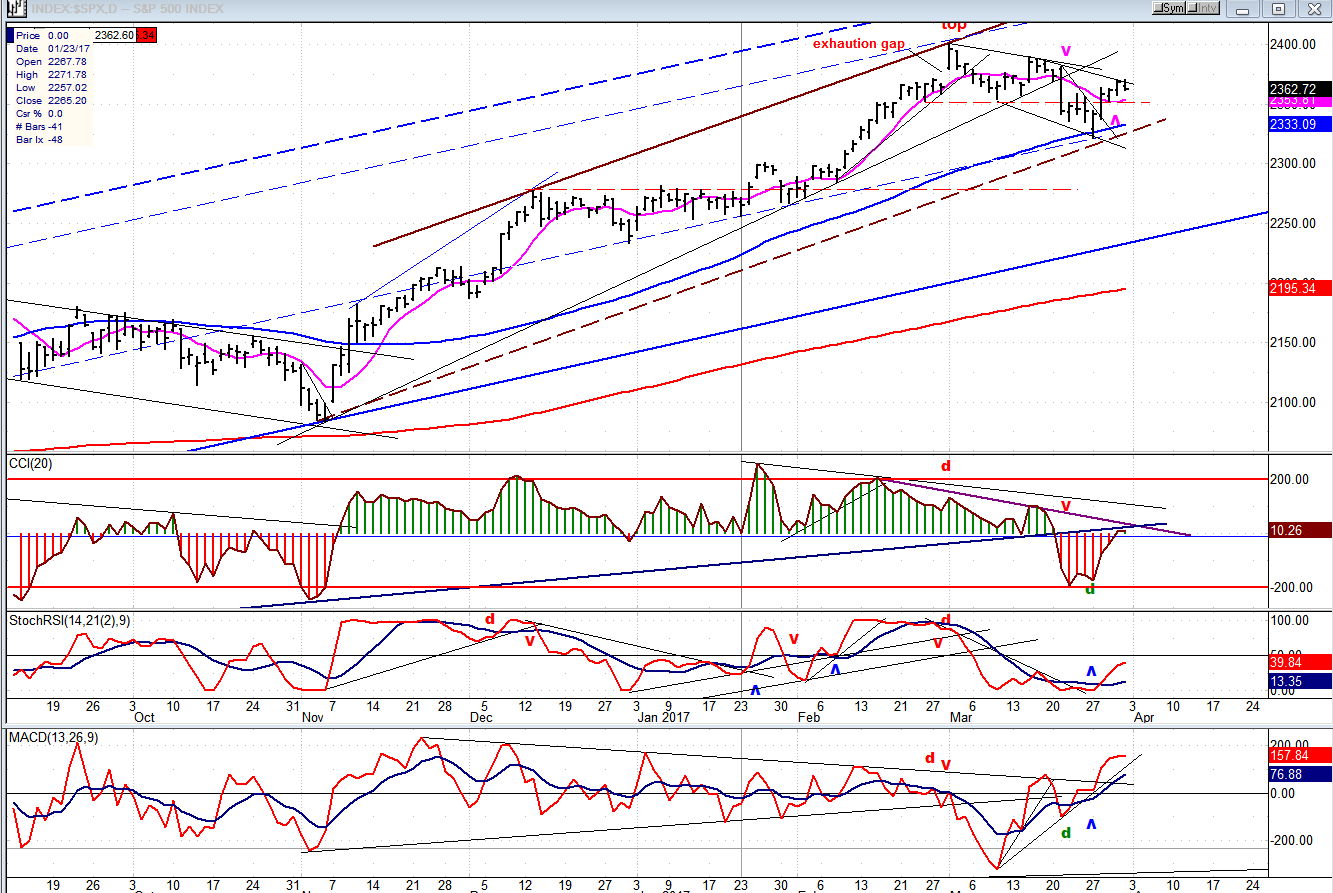
Daily Chart
As I discussed in the past issue, although the current uptrend started a little over a year ago at 1810, this corrective action is only for the rally which started at 2084, and is contained in the brown channel which has a dashed line for the lower channel line. The larger (blue) channel delineates the action from 1810. After this correction is over, we should make a new high to complete the larger structure, and then challenge the bottom line of the blue channel. This will bring a much more severe corretion than the one we are currently experiencing, but it is too soon to consider a potential bull market top.
The first (a-b-c) phase of the correction ended on the blue (55-d) moving average which coincides with the lower channel line. 2325 had been the projection derived from the distribution which formed before we broke the trend line. The 2323 low was right in the ball park.
Instead of an immediate break through the bottom of the brown price channel, phase two could, after a short retracement, extend to a new correction high before we start on phase three. In any case, if the entire correction is a larger a-b-c pattern, phase three should break below both the dashed trend line and the blue 55-d MA and make a new correction low at a level which will be determined by the amount of distribution prior to the reversal.
A look at the oscillators makes it clear that the daily trend is still down. Until we have a significant break above the downtrend lines of the top oscillator sustained by strong upside momentum, we are still in a downtrend. Last week’s rally was extensive enough to reverse both lower oscillators. All three will be expected to turn lower as the next correction get underway, but perhaps not before they first develop some negative divergence.
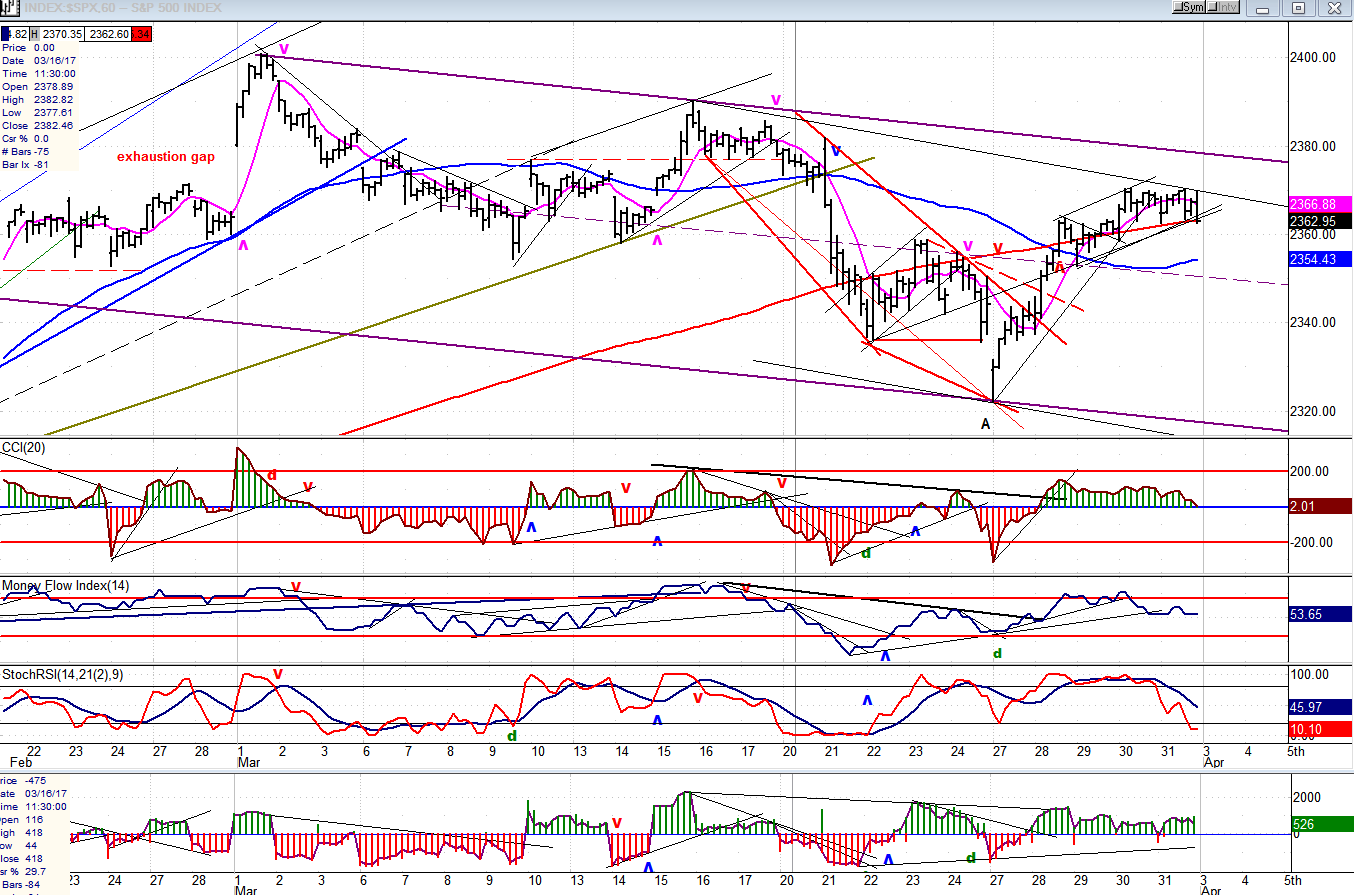
Hourly Chart
The consolidation/correction remains confined to a broad, but shallow channel, indicating that it should not be all that severe for the rest of its duration (with the end expected to still be several weeks away). And if we are forming another a-b-c second phase, we will most likely penetrate the top of the channel with the minor c-wave before starting on the major C-wave decline.
I may have drawn a secondary channel prematurely since a minor top of the move from 2323 has not been confirmed. As mentioned above, the projection target was 2370-2374, and although the lower level stopped the index on four separate occasions, there is no certainty that we won’t try for 2374 before minor a-wave is over. Prices have been gyrating along the red (233hr) MA for the past week, and the close on Friday was right on it, as well as on an internal trend line from which additional support could be derived. Trading below that level is required to confirm the start of minor b-wave.
Neither has the top oscillator nor the lower one (A/Ds) gone negative, which is essential for a sell signal to be given. The SRSI is the only one which has clearly entered a downtrend and, since it is always an early bird, the others could follow on Monday to give us the small b-wave of the second phase.
An Overview Of Some Important Indexes (Weekly Charts)
The top tier is the strongest by far and shows no sign of long-term deceleration.
TRAN (bottom left) continues to be the weakest index and is the only one which has given a mild weekly sell signal. It deserves continued monitoring because of its historical pattern of giving warning long before long-term reversals occur. The total group gives no indication that the long-term is in imminent serious jeopardy.

UUP (Dollar ETF)
UUP is getting back into an uptrend, possibly after completing a long-term wave 4 consolidation. If so, after a short consolidation, it should continue its uptrend, and eventually make a new high, which is expected to be a long-term top followed by a significant correction.

GDX (Gold Miners ETF)
GDX continues to move in a sideways pattern, which should eventually resolve itself into some additional downward correction over the next few weeks. The index may remain under pressure until UUP has made its final high, or is close to it.

Note: GDX is now updated for subscribers throughout the day, along with SPX.
USO (US Oil Fund)
USO found support on its bottom channel line and had a good bounce. Its action should continue to mimic that of the overall market as it extends its short-term base in preparation for another attempt at moving above the recent tops. Note how positive divergence in the top indicator continues to warn of a trend reversal.

Summary
The correction from 2400 is expected to continue in a relatively shallow manner, until the intermediate cycles have all made their lows. This could still take several more weeks.
********
For a FREE 4-week trial, send an email to [email protected], or go to www.marketurningpoints.com and click on “subscribe”. There, you will also find subscription options, payment plans, weekly newsletters, and general information. By clicking on "Free Newsletter" you can get a preview of the latest newsletter which is normally posted on Sunday afternoon (unless it happens to be a 3-day weekend, in which case it could be posted on Monday).
The above comments and those made in the daily updates and the Market Summary about the financial markets are based purely on what I consider to be sound technical analysis principles. They represent my own opinion and are not meant to be construed as trading or investment advice, but are offered as an analytical point f view which might be of interest to those who follow stock market cycles and technical analysis.

When Andre Gratian was a stock broker years ago, a friend introduced him to technical analysis of the market. Consequently, it is not an exaggeration to say that Andre fell in love with this approach! Ever since then, it has become an increasingly important part of his professional life. Gratian has studied the works of Wyckoff, Edwards & Magee, Edward J. Dewey (cycles) and many others. However, one of my most profitable undertaking has probably been to study Point & Figure charting, which he finds invaluable in analyzing stocks and indices. If he were restricted to one methodology, this is the one that he would choose. This well-rounded background has given him what he feels to be a special insight into the stock market, facilitating the recognition of meaningful patterns and the ‘turning points’ in all trends, whether they be short or long term. Andre feels very comfortable discussing the stock market and passing on meaningful information to others. His subscribers include individuals and money managers throughout the world. Moreover, his Newsletters are currently published on several financial sites, here and abroad.


