Technical Analysis Of The Markets


Current Position of the Market
SPX Long-term trend: Uptrend continues.
SPX Intermediate-trend: The correction from 2400 continues,
Analysis of the short-term trend is done on a daily-basis with the help of hourly charts. It is an important adjunct to the analysis of daily and weekly charts which discuss longer market trends.
Cycle Lows Still Ahead
Market Overview
The market action continues to suggest that we are in a mild corrective pattern although, with the cycle lows still several weeks away, we should see lower prices before the correction is complete. Estimated date of lows and price targets for SPX have already been determined through P&F and cycle analysis, and we must now closely monitor the market action to make sure that our assessment is correct, so that we can respond quickly to any deviation from the anticipated market path. The action into Friday’s close is reassuring since it created a new congestion pattern which gives a confirming count to the one formed at the 2381 level. This makes the target for the low even more reliable. But now that enough re-distribution has taken place, we need to extend the decline from the 2375 secondary top. This is what my indicators are currently projecting and, if they turn out to be correct, a resumption of the downtrend should start immediately and could extend to a new low before the next consolidaton takes place.
Daily Chart
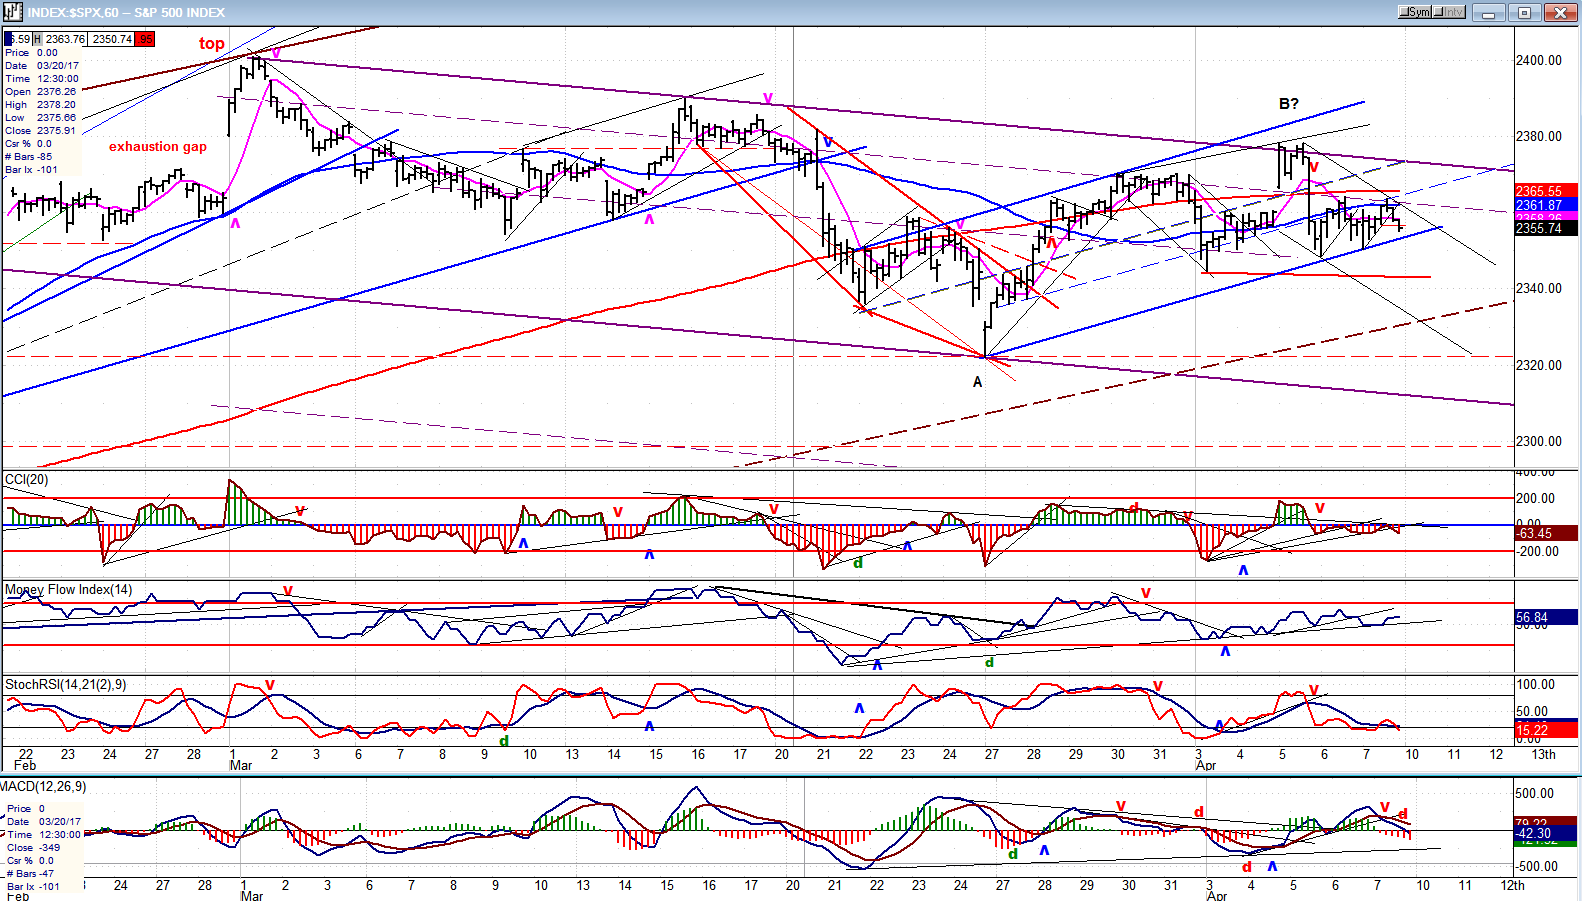
The SPX phase which started at 2084, and which is a part of the longer trend from 1810, came to an end at 1400. It is represented on the chart by the brown channel which has a solid line on top and a dashed line on the bottom. Since the high, which was characterized by an exhaustion gap taking the price to its 1400 projection target, the index has been under a consolidation/correction which is now approaching the bottom line of the channel. Because the high represents the structural completion of this up-phase, it is expected to move outside the channel before the next one gets underway.
We can arrive at a pretty accurate measure of price retracement during a phase correction by using the Fibonacci sequence. More often than not, the retracement will fall between .382 and .618 of the previous uptrend. The current phase went from 2084 to 2400, or 316 points. The price retracement for this correction is unlikley to be more than approximately .382 of 316, or 121 points. This is verified by a P&F count of the top distribution pattern taken at the 2381 level. Very often, there will be a supsequent re-distribution pattern at a lower level which will give a confirming count. The congestion pattern to the right of the initial 3/27 low is giving us such a confirming count, providing that it stops at Friday’s high and that we start to extend the decline on Monday, without adding to it.
The structure is, so far, validating this analysis with the 3/27 low being the A-wave of the correction and the recent 2378 high most likely being the B-wave of a potential A-B-C pattern. If Monday does not resume the decline, the structural assumption is not correct and we’ll have to go back to the drawing board. But the indicators are putting the odds on our side. The momentum oscillators have begun to roll over after making a lower high while remaining negative. The A/D indicator (bottom) is doing the same, and all three are showing negative divergence. A strong rally on Monday would nullify the short-term analysis, and perhaps the rest as well! Absolute certainty is not a feature of technical analysis, but objective evaluation through proper methodology goes a long way toward revealing the market’s future trend.

Hourly Chart
Using parallel lines are an important feature of my analysis when drawing channels and internal trend lines. In this chart, the small blue channel is formed by lines parallel to the blue trend line from the 2084 low, which was broken shortly after the 2400 top was made. If, on Monday, the index plunges through the lower blue channel line, it’s a fair guess that the correction has resumed. The larger brown channel dashed line could provide temporary support, and beyond that, the red dashed line drawn at the 2323 recent low.
The top trend line of the sloping corrective channel stopped the rally from 2323 and it was immediately followed by an instant 30-point drop which gives it a lot of validity as a resistance line. This was followed by a 50% retracement which was successfully tested again on Friday with a close below all three MAs. These are good reasons to think that Monday should break below the blue channel line.
The A/D oscillator has already given a sell signal by making a bearish cross, and the last two trading hours on Friday accelerated its already negative histogram as well as those of the two MAs, with the shortest already below the zero line. The momentum indicators are also rolling over, but we’ll need the middle one to start a downtrend for final confirmation. Both daily and hourly indicators are rolling over at the same time. This is normally a strong warning that a decline is imminent.
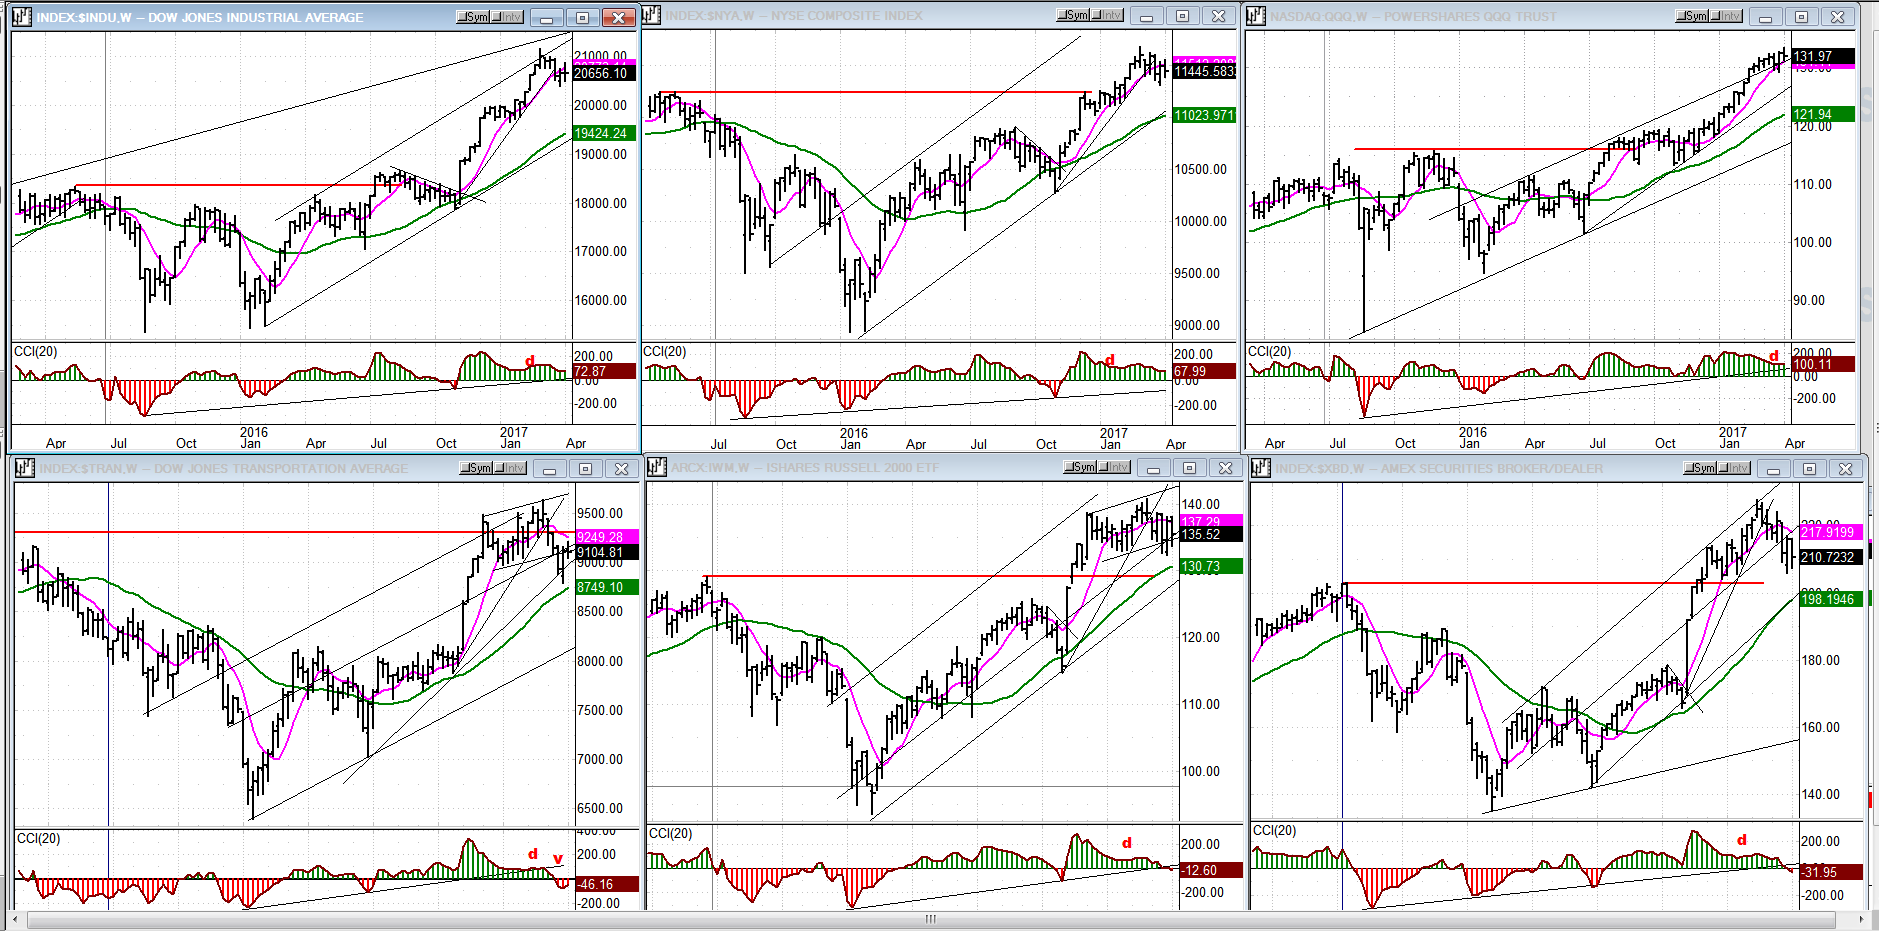
An Overview Of Some Important Indexes (Weekly Charts)
QQQ (top right) made a slightly new high last week and remains the strongest index of this group over the near-term. The other two in the top tier (DJIA, NYA) have entered mild corrections after making their highs at the end of February. On a long-term basis, DJIA (top left) is the strongest. Note by how much more it has exceeded its former all-time high (red line).
The weak are getting weaker! TRAN (bottom left) is the first to have given a weekly sell signal with its oscillator breaking its trend line and going negative. The other two, (IWM & XBD) followed suit last week. So far, TRAN is the only one that has dropped below its 2014 high. It normally gives an early warning of an approaching significant top; so, it will be interesting to see how it behaves after this correction while the strongest indexes make new all-time highs.
UUP (Dollar ETF)
Last week, UUP continued its rally. It has reached a downtrend line which it must overcome if it is to make a new high (as expected) but it may have a mild consolidation, first.

GDX (Gold Miners ETF)
GDX continues a mild uptrend which is part of a correction from the early February top. Friday saw a sharp move early in the day which gave up all its gain by the close. With a strong dollar and a cycle low due in about a week, it could retrace at least to the bottom of its sideways pattern.

Note: GDX is now updated for subscribers throughout the day, along with SPX.
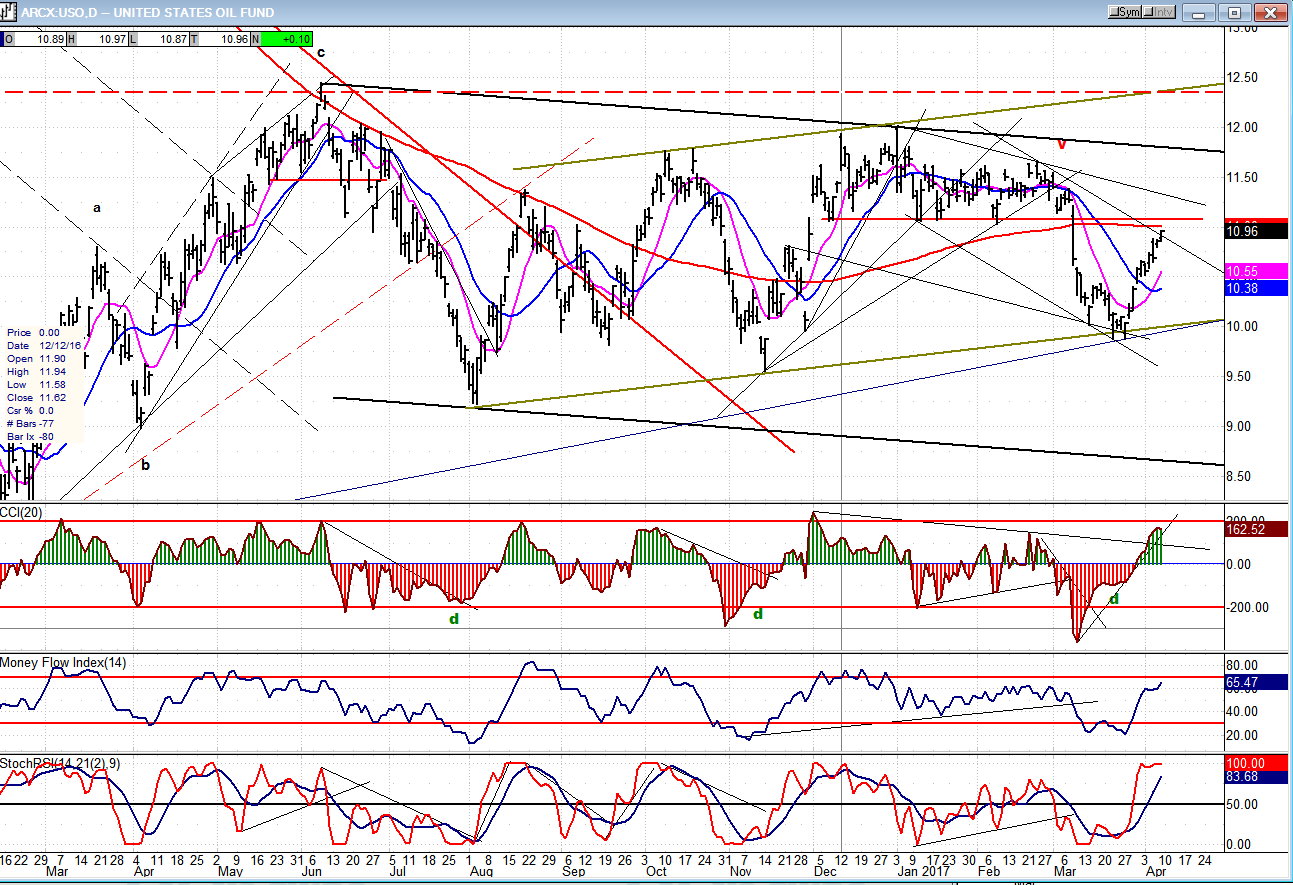
USO (US Oil Fund)
USO has had a good rebound from the bottom channel line which has taken it to the 233-d MA, as well as to the bottom of the descending triangle. This should halt its advance for now.
Summary
There is no sign that the correction which started on 3/01 is over. On the contrary, by Friday’s close, the index looked on the verge of continuing the decline from the secondary high of 4/05. The most objective forecast projects a continuation of the downtrend until the intermediate cycles have made their lows and are ready to reverse course.
********
For a FREE 4-week trial, send an email to [email protected], or go to www.marketurningpoints.com and click on “subscribe”. There, you will also find subscription options, payment plans, weekly newsletters, and general information. By clicking on "Free Newsletter" you can get a preview of the latest newsletter which is normally posted on Sunday afternoon (unless it happens to be a 3-day weekend, in which case it could be posted on Monday).
The above comments and those made in the daily updates and the Market Summary about the financial markets are based purely on what I consider to be sound technical analysis principles. They represent my own opinion and are not meant to be construed as trading or investment advice, but are offered as an analytical point f view which might be of interest to those who follow stock market cycles and technical analysis.

When Andre Gratian was a stock broker years ago, a friend introduced him to technical analysis of the market. Consequently, it is not an exaggeration to say that Andre fell in love with this approach! Ever since then, it has become an increasingly important part of his professional life. Gratian has studied the works of Wyckoff, Edwards & Magee, Edward J. Dewey (cycles) and many others. However, one of my most profitable undertaking has probably been to study Point & Figure charting, which he finds invaluable in analyzing stocks and indices. If he were restricted to one methodology, this is the one that he would choose. This well-rounded background has given him what he feels to be a special insight into the stock market, facilitating the recognition of meaningful patterns and the ‘turning points’ in all trends, whether they be short or long term. Andre feels very comfortable discussing the stock market and passing on meaningful information to others. His subscribers include individuals and money managers throughout the world. Moreover, his Newsletters are currently published on several financial sites, here and abroad.


