Technical Analysis Of The Markets


Current Position of the Market
SPX Long-term trend: Uptrend continues.
SPX Intermediate-trend: The correction from 2400 continues,
Analysis of the short-term trend is done on a daily-basis with the help of hourly charts. It is an important adjunct to the analysis of daily and weekly charts which discuss longer market trends.
Getting To “B”
Market Overview
There was some uncertainty ahead of the French election which kept the market in a tight range, but when the results came in, prices exploded upward, especially with practically everyone endorsing Macron, making Le Pen a sure-loser in the runoff. Nevertheless, with the cycle lows still well ahead, the pattern under construction is more likely to be a B-wave than the resumption of the uptrend to new highs which should follow the C-wave. After the announcement of the “massive” tax reform plan on Wednesday (which turned out to be somewhat less than the rhetoric), the failure of health care plan 2.0 to get enough votes, the one-week-only extension of keeping the government open, and the disappointing GDP numbers, it’s no wonder that the rally fizzled by the end of the week. It is still possible to re-test the high before reversing but, at the very least, we should fill the gigantic gap on the SPX as wave C, before reaching for new highs. We must also contend with the jobs report next week. If it is another disappointment, it would be a perfect trigger to give back some territory, but the market is very likely to reverse before Friday.
While QQQ continues on its merry way into the stratosphere, there are signs that the DJIA is beginning to lag SPX. IWM filled its upper gap on Friday, and TRAN has filled both upper and lower. Arguing for this to be the conclusion of a B-wave is not too much of a stretch. But we are still trading in a rising channel and must come out of it in the next couple of days before wave C reveals itself.
Analysis: (These Charts and subsequent ones courtesy of QCharts.com)
Daily Chart
The decline from 2400 which stopped at 2322 is labeled as wave A of the entire correction. We have either completed or are about to complete wave B and should soon see the beginning of wave C as we come out of the narrow channel drawn on the chart-- probably next week. The momentum indicators still have a little more work to do, so we could first re-test the 2398 high, or exceed it slightly.
We discussed the inability of the index to make much downside headway after it broke below its 2084 lower channel line (dashed), and held above the former near-term low. This opened the door for a possible B wave extension to the 2400 high. As you recall, our original count for the top was 2400 with a potential extension to 2410. Is that what we are seeking to fill right now?
Since the B wave may not yet be complete, we’ll have to wait until its completion to establish a downside count for wave C. With two cycles remaining to make their lows (the first near the middle of next month, and the other near the end of the month), we don’t have to be in a hurry to see the market turn up, and a decline to the support levels discussed earlier is still possible. Those are near the horizontal dashed red lines and the blue bottom line of the 1810 channel.
While the momentum indicators could continue their topping process as prices rise higher, the A/D oscillator has already given a preliminary sell signal which will be confirmed when the other two join in.

Hourly Chart
Certain features of the chart pattern and indicators are easier to discern on the 60m chart. To begin with, the enormous gap which occurred after the results of the French election was followed by a strong consolidation pattern in the form of a small pennant; and then there was another gap which sent us into the Tax reform announcement date with a consolidation into the end of the week. It lasted two days, plenty of time to fill the upper gap and to reach the bottom channel line! But we did neither, which is a sign of latent strength, suggesting that another high for the B(?) wave top is possible, especially since the last spurt in the rally stopped at the very top channel line with only very minor deceleration showing.
At the same time, the oscillators gave a preliminary sell signal in unison, but it was only for the consolidation pattern, and they now look ready to extend the move upward. So that’s the best guesstimate for now. The degree of accumulation also points to a potential extension of the rally to a double top at 2398, or even to a slightly new high to 2405. If we start up first thing Monday morning, we could finish by Tuesday.

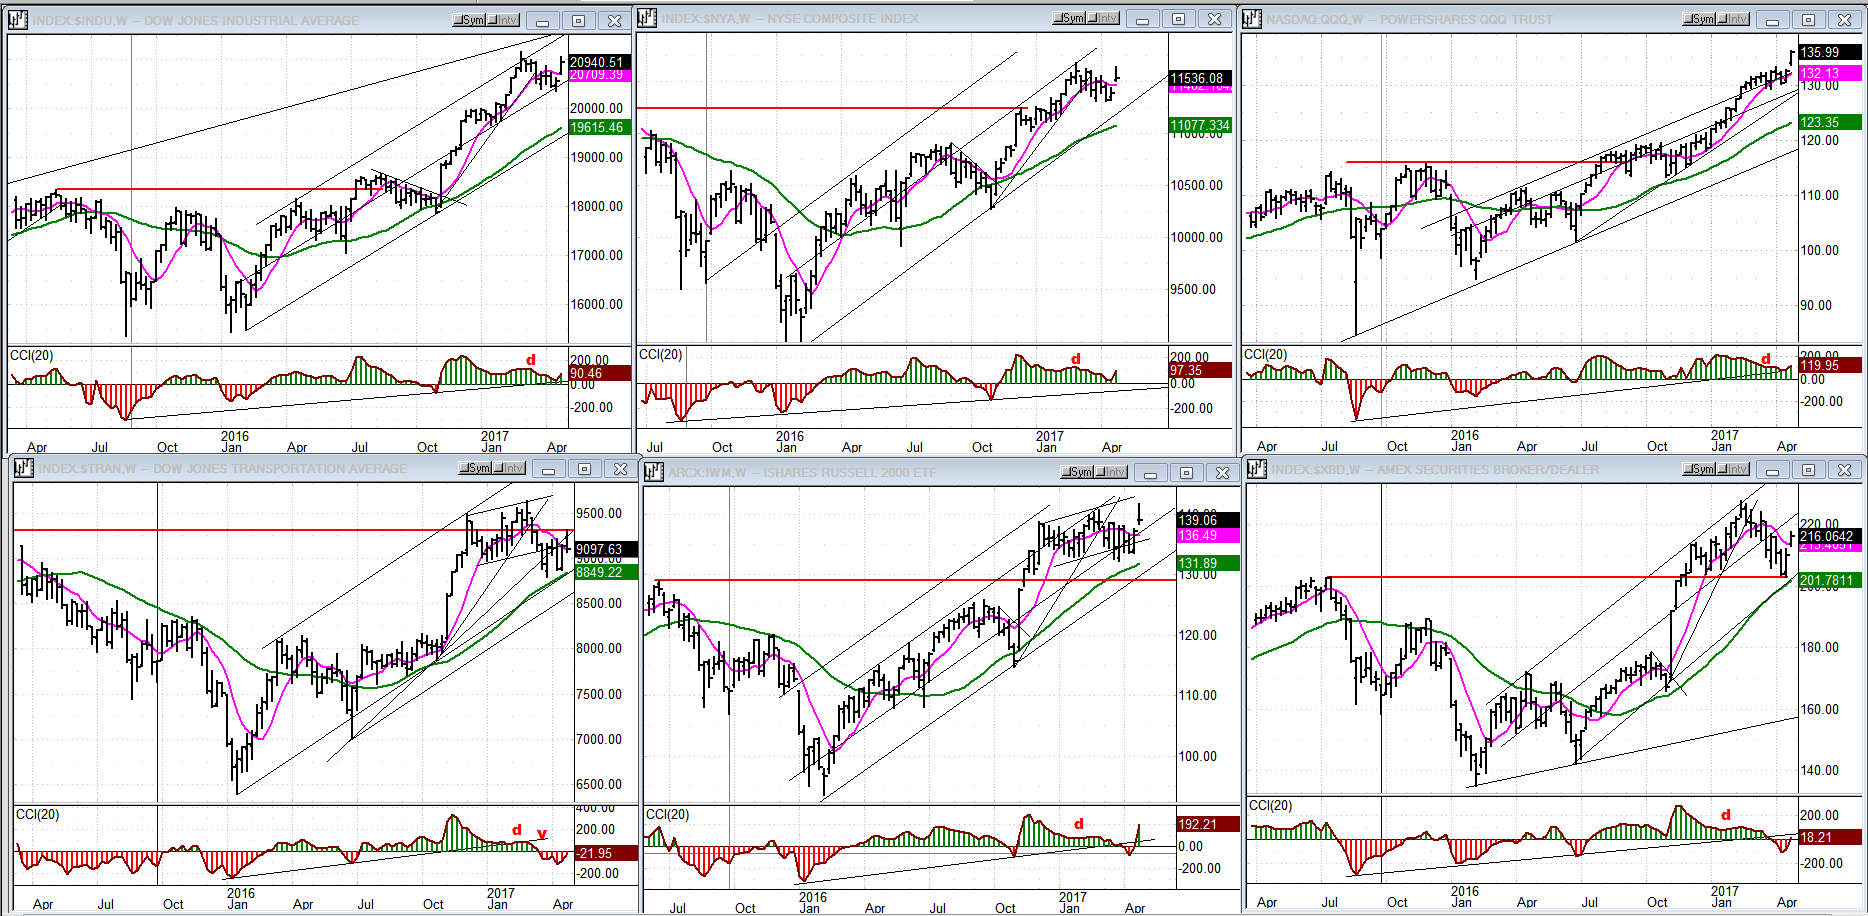
An Overview Of Some Important Indexes (Weekly Charts)
As mentioned earlier, the QQQ (top right), which is powered by all the high-flyers, continues to make new highs and left all the others behind, last week. IWM (bottom center) also made a new high last week, but quickly retraced it on Friday, closing its upper gap for good measure. TRAN, (bottom left) still ranks last, rallying to its former long-term high (red line) and quickly pulling back. It is the only one to close the larger gap. This is the one to watch for a long-term trend evaluation of the stock market. It has proven itself capable of advance-warning in the past, and looks ready to do it again.
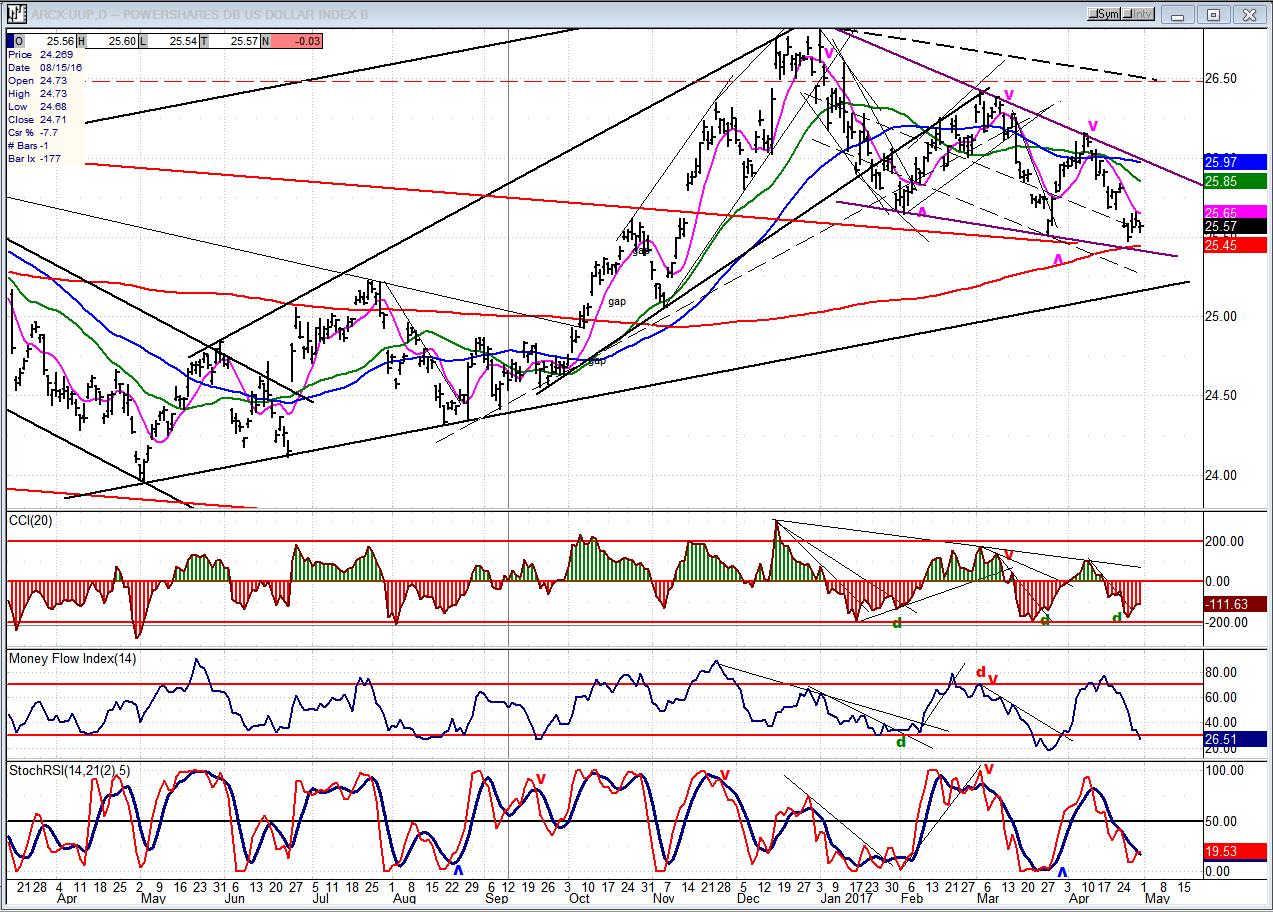
UUP (Dollar ETF)
UUP looks as if it is making a triangle wave 4 with the “e” wave just about complete, before continuing its rally. This would support the view that there needs to be another high before a larger correction takes place. What effect this will have on gold is uncertain since gold dropped along with UUP recently; although bottoming cycles are credited for this decline.
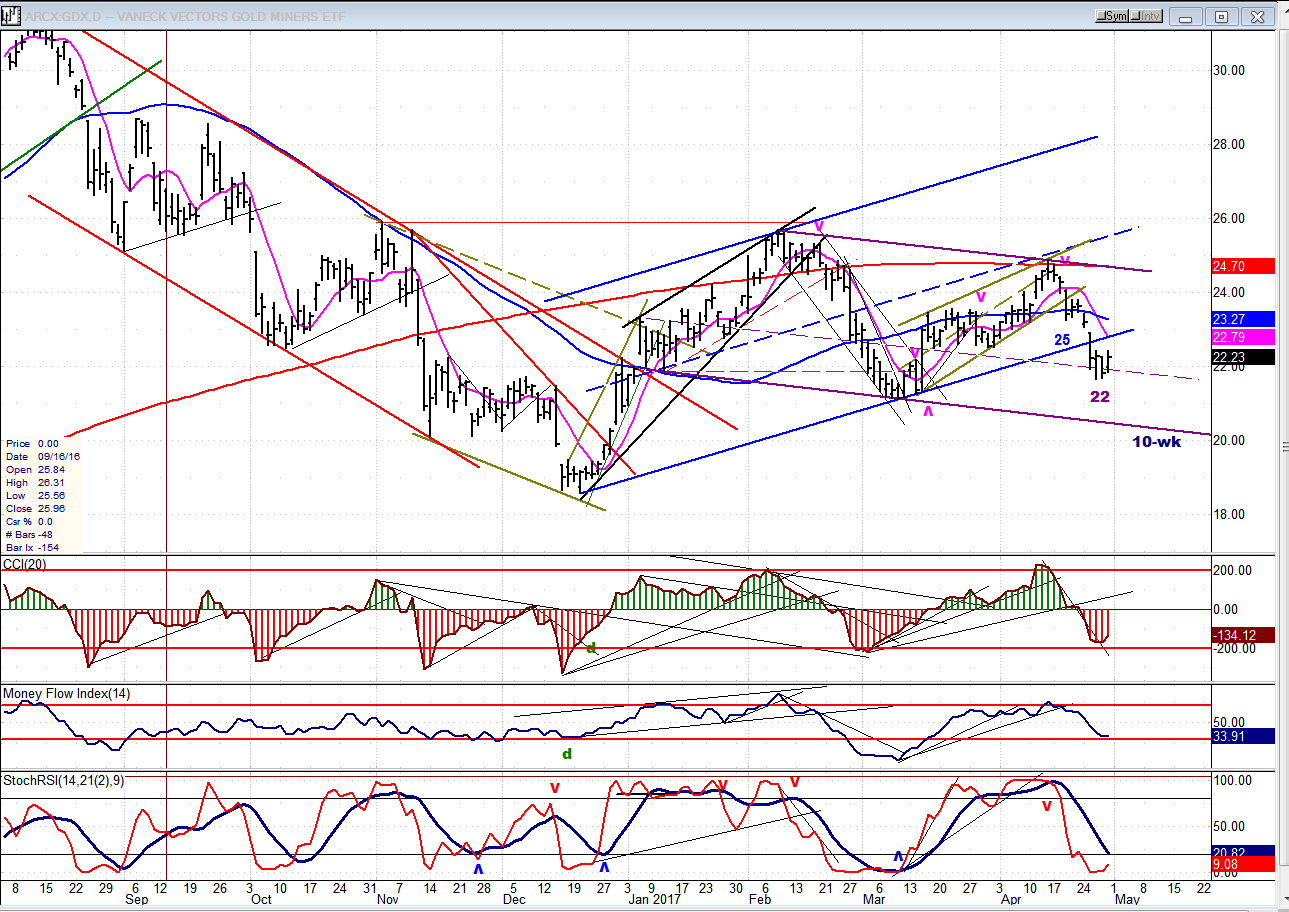
GDX (Gold Miners ETF)
GDX is undergoing a normal longer-term correction which is the result of bottoming cycles. A small holding period is expected before the last and largest cycle makes its low, probably completing wave C of the correction. After that, we can expect that the long-term uptrend will resume.
Note: GDX is now updated for subscribers throughout the day, along with SPX.
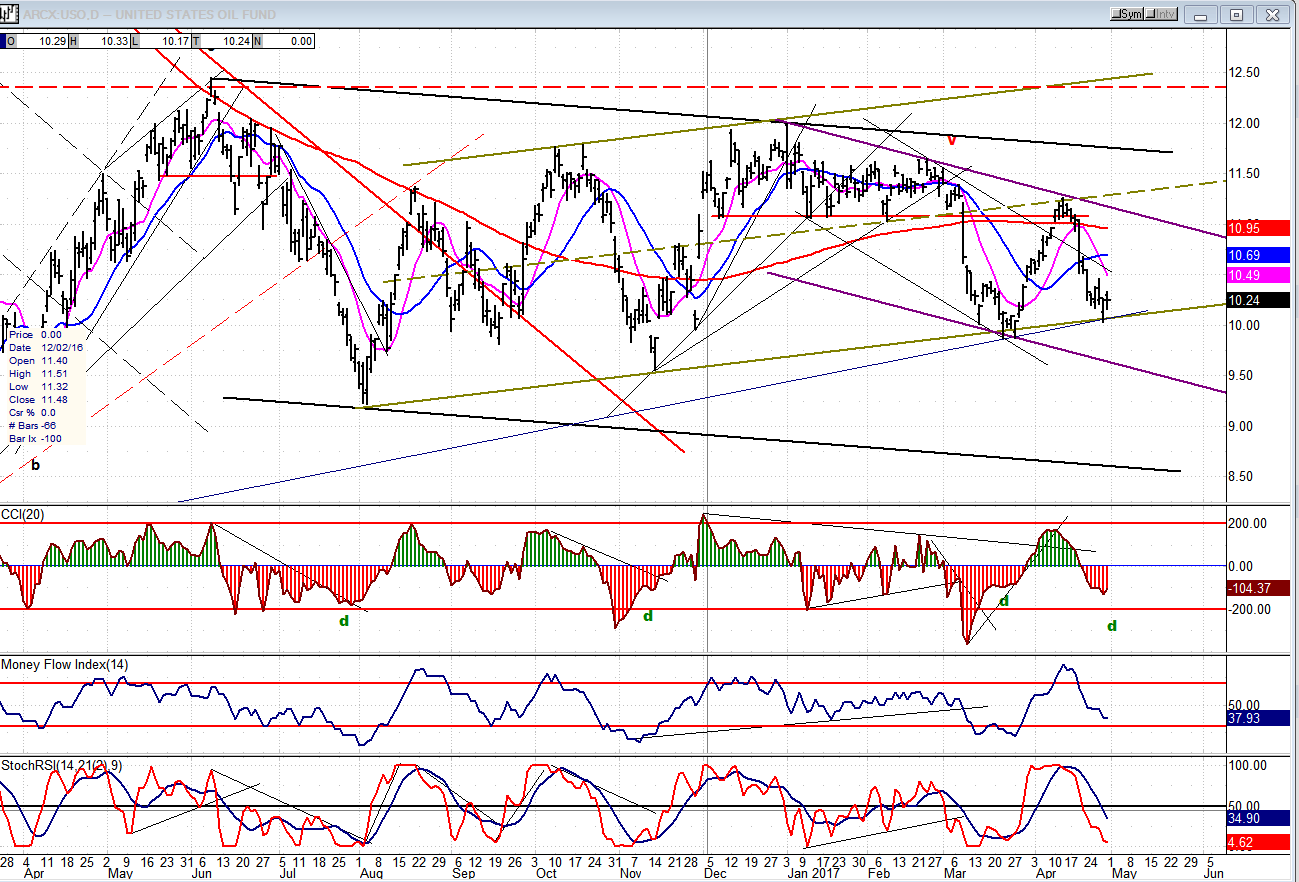
USO (US Oil Fund)
USO has been a disappointment to its bullish supporters. It was expected to hold at a higher level and challenge the top trend line, with the possibility of moving to the top of the rising green channel. It still has a chance to redeem itself if it does not break through the rising trend lines. Although the top oscillator is showing positive divergence, the two lower ones are less bullish and suggest that USO could drop to the lower line of the purple channel before finding its footing.
Summary
Everything considered, best guesstimate is that SPX should have one more minor wave up, possibly to 2405, before completing wave B of the larger correction.
********
For a FREE 4-week trial, send an email to [email protected], or go to www.marketurningpoints.com and click on “subscribe”. There, you will also find subscription options, payment plans, weekly newsletters, and general information. By clicking on "Free Newsletter" you can get a preview of the latest newsletter which is normally posted on Sunday afternoon (unless it happens to be a 3-day weekend, in which case it could be posted on Monday).
The above comments and those made in the daily updates and the Market Summary about the financial markets are based purely on what I consider to be sound technical analysis principles. They represent my own opinion and are not meant to be construed as trading or investment advice, but are offered as an analytical point f view which might be of interest to those who follow stock market cycles and technical analysis.

When Andre Gratian was a stock broker years ago, a friend introduced him to technical analysis of the market. Consequently, it is not an exaggeration to say that Andre fell in love with this approach! Ever since then, it has become an increasingly important part of his professional life. Gratian has studied the works of Wyckoff, Edwards & Magee, Edward J. Dewey (cycles) and many others. However, one of my most profitable undertaking has probably been to study Point & Figure charting, which he finds invaluable in analyzing stocks and indices. If he were restricted to one methodology, this is the one that he would choose. This well-rounded background has given him what he feels to be a special insight into the stock market, facilitating the recognition of meaningful patterns and the ‘turning points’ in all trends, whether they be short or long term. Andre feels very comfortable discussing the stock market and passing on meaningful information to others. His subscribers include individuals and money managers throughout the world. Moreover, his Newsletters are currently published on several financial sites, here and abroad.


