Technical Analysis Of The Markets


Current Position of the Market
SPX Long-term trend: Uptrend continues with a notable loss of upside momentum.
SPX Intermediate trend: The correction from 2400 on 3/08 continues, with a B-wave still likely despite a new high.
Analysis of the short-term trend is done on a daily-basis with the help of hourly charts. It is an important adjunct to the analysis of daily and weekly charts which discuss longer market trends.
A New (Questionable) Uptrend?
Market Overview
EWT: The Elliott analysts are hanging on to their B-wave pattern – for the time being -- but if the uptrend continues past 2425, they may have to throw in the towel.
Cycles: With a new high achieved last week, it is obvious that all three of the intermediate cycles which I discussed in past letters have made their lows, with the last one bottoming on 5/18.
P&F projections: The current rally from 2353 has reached its minimum target (2419). There are two more valid (potential) projections for this phase: 2425 and 2433.
Trend analysis: Weekly: Probably topping. Pronounced negative divergence. Daily: Up, with negative divergence. Hourly: Reached minimum projection, is going sideways, and may be topping. Negative divergence in indicators.
Breadth: Initial breadth momentum for the current rally reached 2000. By Friday, it had steadily declined to 150 at the close, with a slight dip to -100 intra-day.
Summary: Everything considered, it is probable that the new high is an extension of the uptrend which started at 2084, and not a new uptrend. If a short-term top was not reached on Friday, one should be over the next few days at one of the alternate projections mentioned above.
Analysis: (These Charts and subsequent ones courtesy of QCharts.com)
Weekly Chart
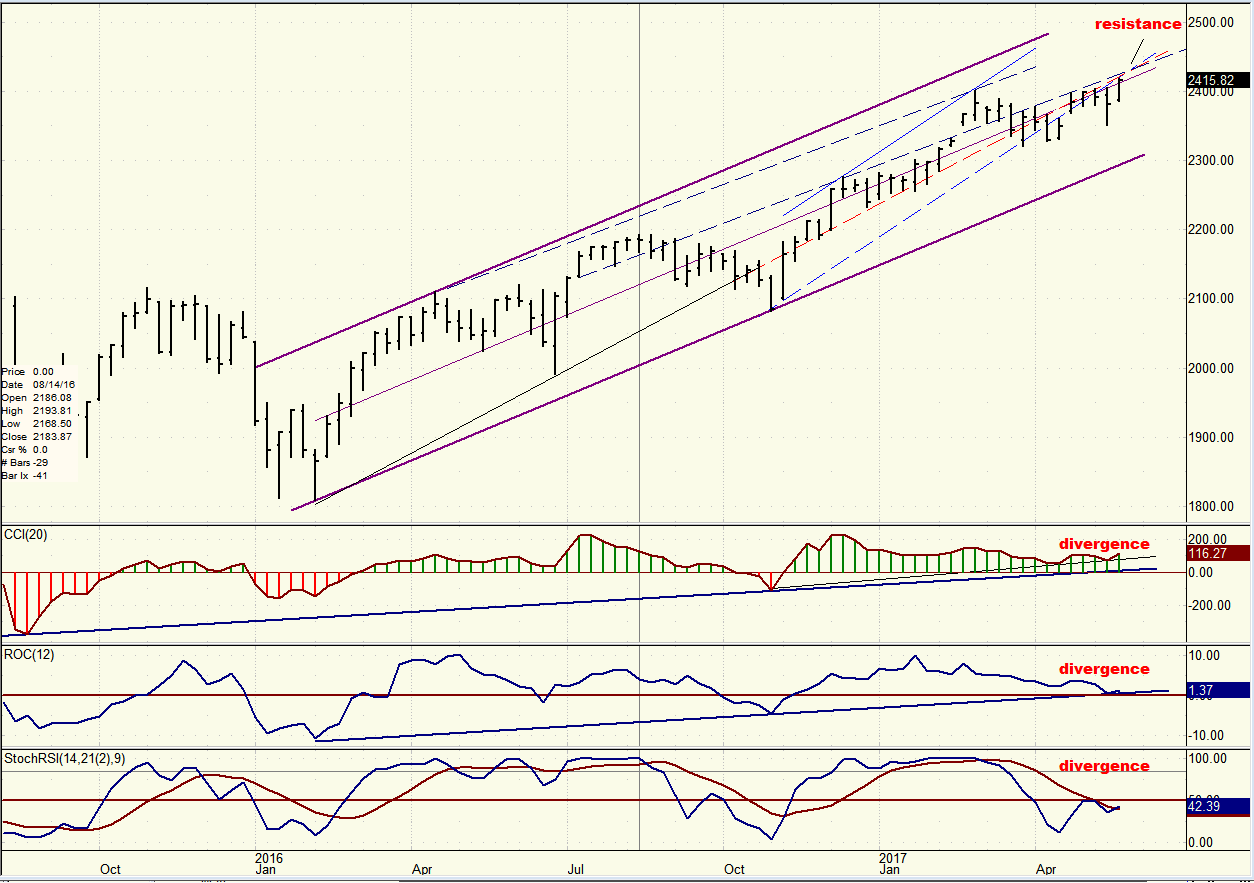
Let’s first focus on the main channel which identifies the current price action. Below is a weekly chart of the move which started at 1810. What I want to point out here is the fact that the price is having difficulty getting to the top of the channel due to the resistance coming from a juncture of several trend and parallel lines. This momentum deceleration is reflected in the oscillators which all show strong negative divergence. If the index cannot push its way through this resistance over the next few days, there is a good chance that it will turn down. Hence the concern of the EWT analysts (and others) who are still looking for an important retracement before a genuine resumption of the long-tem uptrend.
Daily Chart
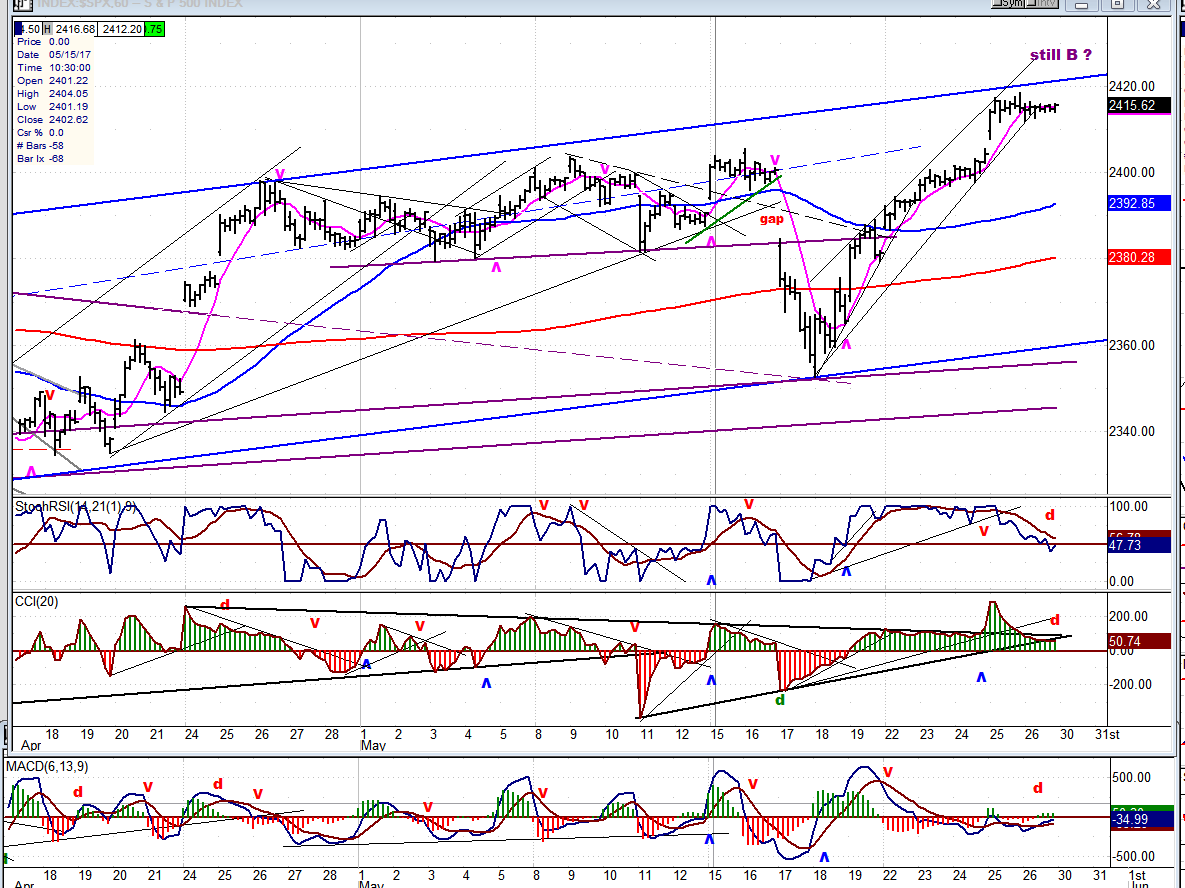
For a more detailed analysis, we’ll now move to the daily chart. The main channel shown above is represented by heavy purple lines. Note that the bottom one is totally validated by the 233-DMA which matches it exactly! That channel has been divided into quadrants (blue lines) and we can see that price has been confined to the second quadrant from the top since the original projecion to 2400 was met.
There is a secondary, steeper channel (pink lines) which was discussed earlier, which delineates the move from 2084. It has been breached repeatedly since the 2400 top but the index, which has found consistent support on the blue mid-channel line, has not been able to move outside of it aggressively. On Friday, the index has once again risen to the secondary channel line in another back-test.
If the current P&F projection is correct, giving SPX a maximum upside of 2433, then it is obvious that it will not be able to rise above the resistance shown on the weekly chart before correcting. The daily oscillators show that to a lesser degree than the weekly, with only the A/D indicator diverging and ready to give a sell signal.
The index cannot forever continue to trade inside the second quadrant. It will either have to move decisively through the top to continue its uptrend, or it will break down and move through the mid-channel line with the possibility of declining to the bottom of the main channel before finding support.
The answer to “a new uptrend” could be evident soon, but the odds appear to be stacked against it.

Hourly Chart
The blue channel lines shown on the hourly chart do not exactly match the blue quadrant lines of the daily chart, but close enough to identify the short-term trend. The last of the three intermediate cycles made a last-minute sharp decline into its low point, creating a V-shaped bottom followed by a rally which is now approaching (or at) the top of the channel which was formed by the recent price activity. Friday’s sideways move, after the minimum target was reached on the previous day, has created strong negative divergence in all the indicators, but it has not yet resulted in a sell signal -- although you could not get any closer to one. Tuesday’s action will determine if there is enough buying to rescue the bulls and send it to the next target of 2425, or if it will pull-back a little first before going for it. These appear to be the best alternatives for the moment. A retracement of 10 to 15 points followed by a move to the next projection would put the daily indicators in a better position to give a sell signal.
An Overview Of Some Important Indexes (Weekly Charts)
QQQ continues to mimic the Energizer Bunny, while other indexes are not doing much, especially the ones in the lower tier. We should soon find out if we are ready to establish a new uptrend or not. If so, the indexes should rise cleanly out of their congestion levels.

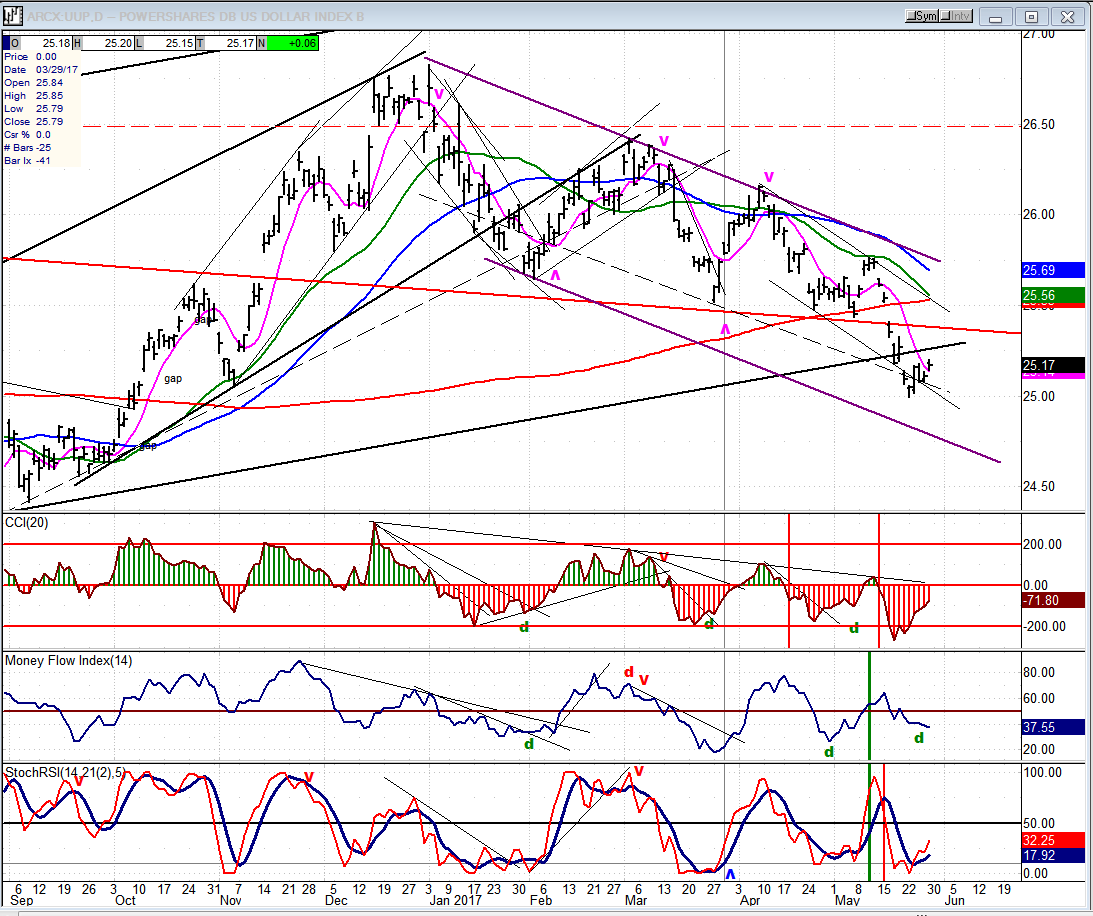
UUP (Dollar ETF)
UUP’s money flow index is showing a pattern of decreasing downward pressure with each new low --which could lead to a rally -- but a lot of ground must be reclaimed before a new uptrend can be established. And besides, the P&F chart warns of a potential move to 24.50, first.
GDX (Gold Miners ETF)
GDX is showing renewed buying interest and may be ready for a move higher, but it would likely be limited to about 24.50, if that, for now.
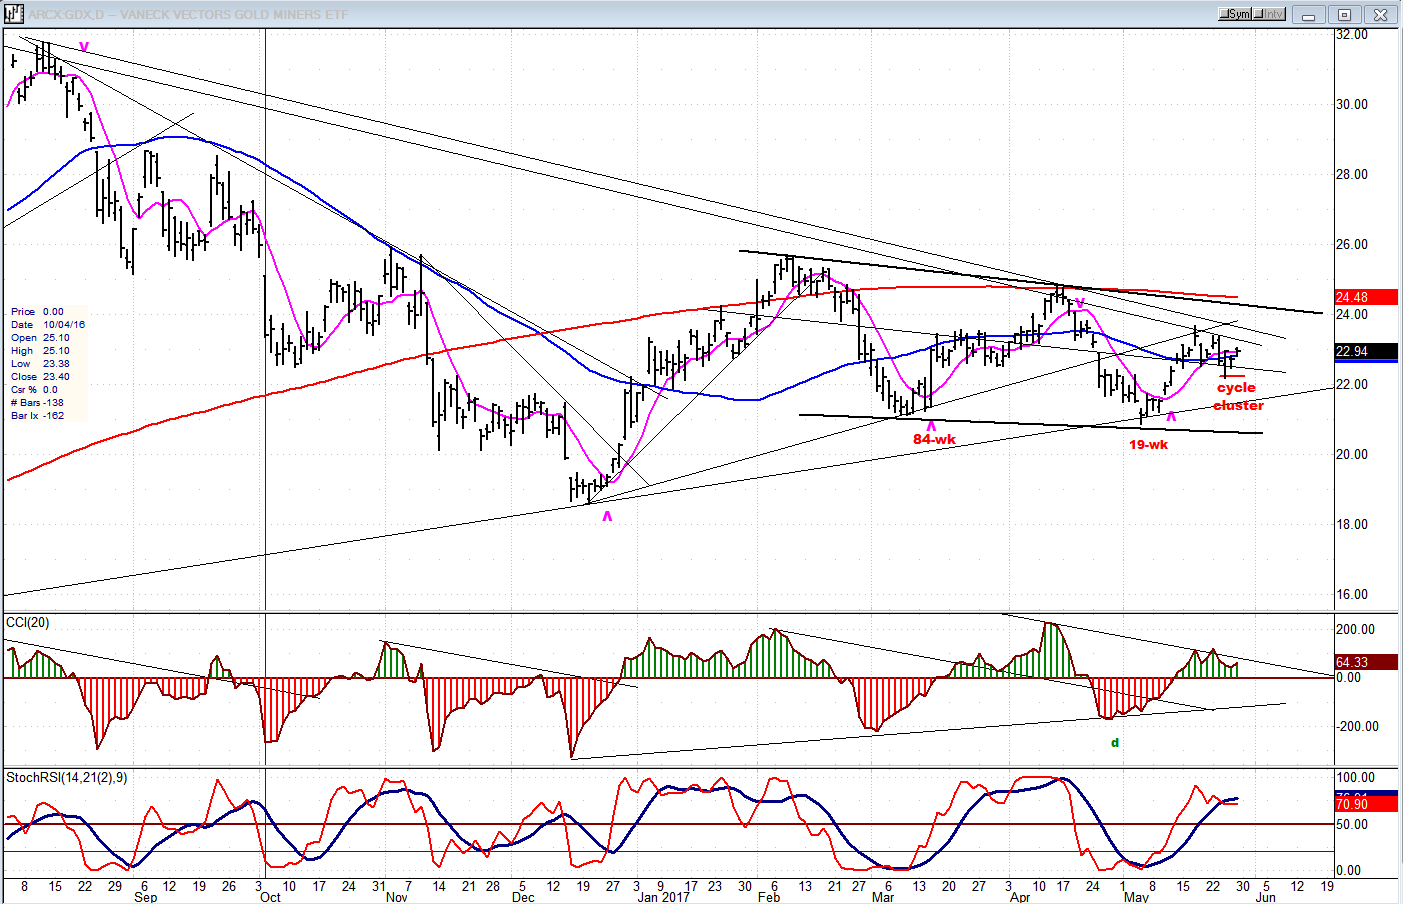
Note: GDX is now updated for subscribers throughout the day, along with SPX.
USO (US Oil Fund)
USO is still trading in a newly established intermediate downtrend with no immediate sign of breaking out of it.

********
For a FREE 4-week trial, send an email to [email protected], or go to www.marketurningpoints.com and click on “subscribe”. There, you will also find subscription options, payment plans, weekly newsletters, and general information. By clicking on "Free Newsletter" you can get a preview of the latest newsletter which is normally posted on Sunday afternoon (unless it happens to be a 3-day weekend, in which case it could be posted on Monday).
The above comments and those made in the daily updates and the Market Summary about the financial markets are based purely on what I consider to be sound technical analysis principles. They represent my own opinion and are not meant to be construed as trading or investment advice, but are offered as an analytical point of view which might be of interest to those who follow stock market cycles and technical analysis.

When Andre Gratian was a stock broker years ago, a friend introduced him to technical analysis of the market. Consequently, it is not an exaggeration to say that Andre fell in love with this approach! Ever since then, it has become an increasingly important part of his professional life. Gratian has studied the works of Wyckoff, Edwards & Magee, Edward J. Dewey (cycles) and many others. However, one of my most profitable undertaking has probably been to study Point & Figure charting, which he finds invaluable in analyzing stocks and indices. If he were restricted to one methodology, this is the one that he would choose. This well-rounded background has given him what he feels to be a special insight into the stock market, facilitating the recognition of meaningful patterns and the ‘turning points’ in all trends, whether they be short or long term. Andre feels very comfortable discussing the stock market and passing on meaningful information to others. His subscribers include individuals and money managers throughout the world. Moreover, his Newsletters are currently published on several financial sites, here and abroad.


