Technical Analysis Of The Markets


Current Position of the Market
SPX Long-term trend: Uptrend continues with a loss of upside momentum in weekly indicators.
SPX Intermediate-trend: Correction over. May be heading for about 2500.
Analysis of the short-term trend is done on a daily-basis with the help of hourly charts. It is an important adjunct to the analysis of daily and weekly charts which discuss longer market trends.
Is the Correction Over?
Market Overview
All trends from monthly to hourly are up with a new break-out to an all-time high last week. It is now obvious that the C-wave was shallow and ended on 4/17, with the low of one of the intermediate cycles bottoming at that time. Since (to my knowledge) the next intermediate cycle low is not due until August, there should not be any real weakness until we get closer to that date, and it should allow us to reach the next important projection of about 2500. After that, however, we should witness the most substantial reversal of the trend which started at 1810, but which will not necessarily be the beginning of a new bear market. If EWT analysts are correct, there should be one more wave up to an even newer high, the level of which will be determined by the amount of re-accumulation achieved during that correction. Negative divergence has been apparent for some time in the weekly indicators (as was shown on the weekly SPX chart posted last week), but the push higher since 5/18 is keeping them positive for the time being. The next time they weaken it will be a warning that a significant correction has started.
Analysis: (These Charts and subsequent ones courtesy of QCharts.com)
Daily Chart
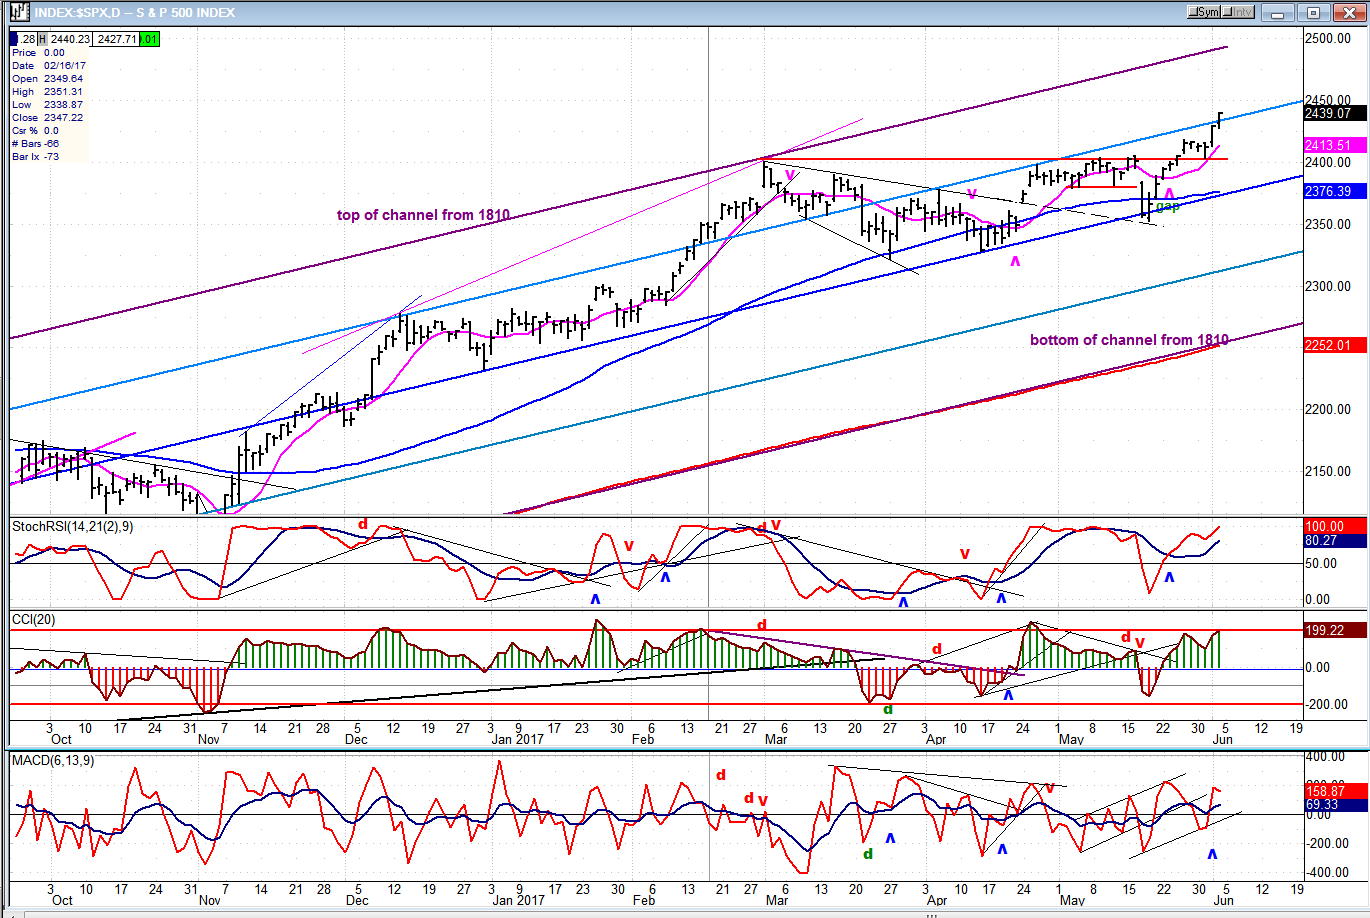
Last week, I mentioned that I had divided the main channel from 1810 into four sections, and that, since the index had reached its 2400 projection, it had been trading in the second quadrant from the top -- finding support on the mid-channel line, and resistance at the top of the second division. Note that this resistance extends all the way back to the December high with that action temporarily confined to the same parameters before it finally broke out and reached the top of the channel. Now that we have a break-out, not only above the red line, but pushing into the first quadrant as well, it is possible that we will be repeating the same pattern as before, and work our way to the top of the channel again by the time we reach the final price target of 2500 or so (which target is determined by the amount of re-accumulation that took place during the recent correction). These projections based on patterns created on P&F charts are not irrefutable, but based on the frequency with which they meet their goal, it is best to give them credence until proven otherwise.
The fact that the correction which started from 2400 was so shallow demonstrates the underlying stength of the index, and it tells us that we are not about to see the high of the bull market. We originally suspected that after the end of the rally from 2085, wave-C of the correction could take us back down to the 2300 level, but the three intermediate cycles combined could not generate enough downward pressure for that. Now, they are pushing the market higher instead and, if I am right, there will not be another intermediate bottom until August, and therefore nothing likely to interfere with the new uptrend until we get closer to that date. This should give it plenty of time to reach the stated objective.
The daily oscillators have resumed their uptrend, with only a little weakness showing in the A/Ds. After breaking below both MAs, price moved back above immediately and is pulling way from them. This is a sign of strength.
Hourly Chart
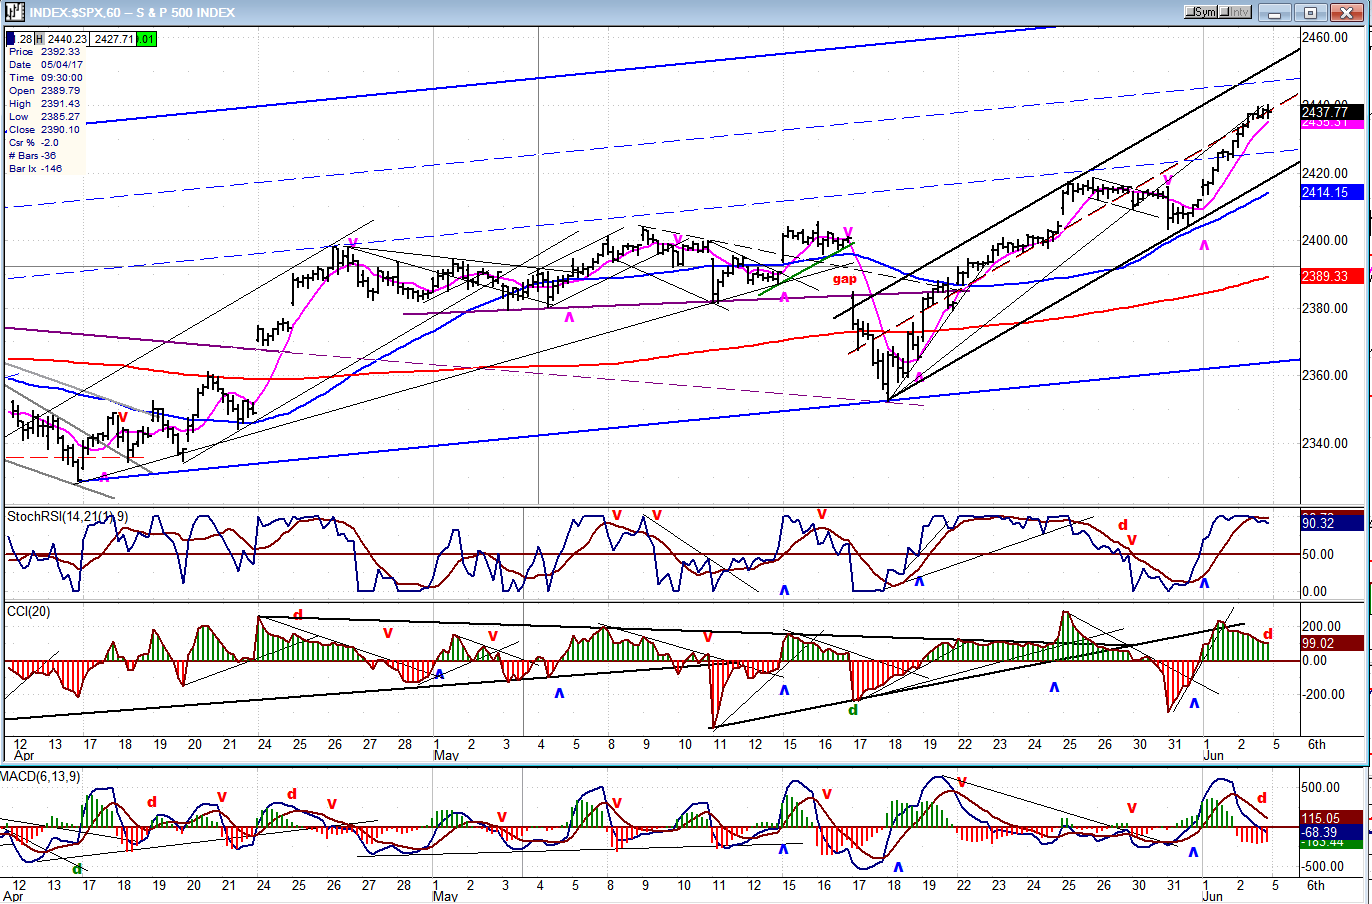
The blue parallels on this chart are not subdivisions of the trend channel from 1810. They simply attempt to clarify the current move from the low of the correction in April. Last week, I was looking to see if we would again find resistance at the first dashed line from the bottom. We had started to pull away from it for the third time, but with the clean reversal and break-out above it last week, we should be on our way to higher prices. The move within the narrow black channel probably delineates the third wave of the impulse which started on 4/17.
On Friday, the oscillators started to turn down after becoming overbought, and this has created some negative divergence. The A/D index is the weakest, but the momentum indicators above are not close to giving a sell signal. Although a small pull-back appears imminent, I suspect that we’ll see higher prices before we have a more important short-term correction (which should be preceded by all oscillators going negative).
An Overview Of Some Important Indexes (Weekly Charts)
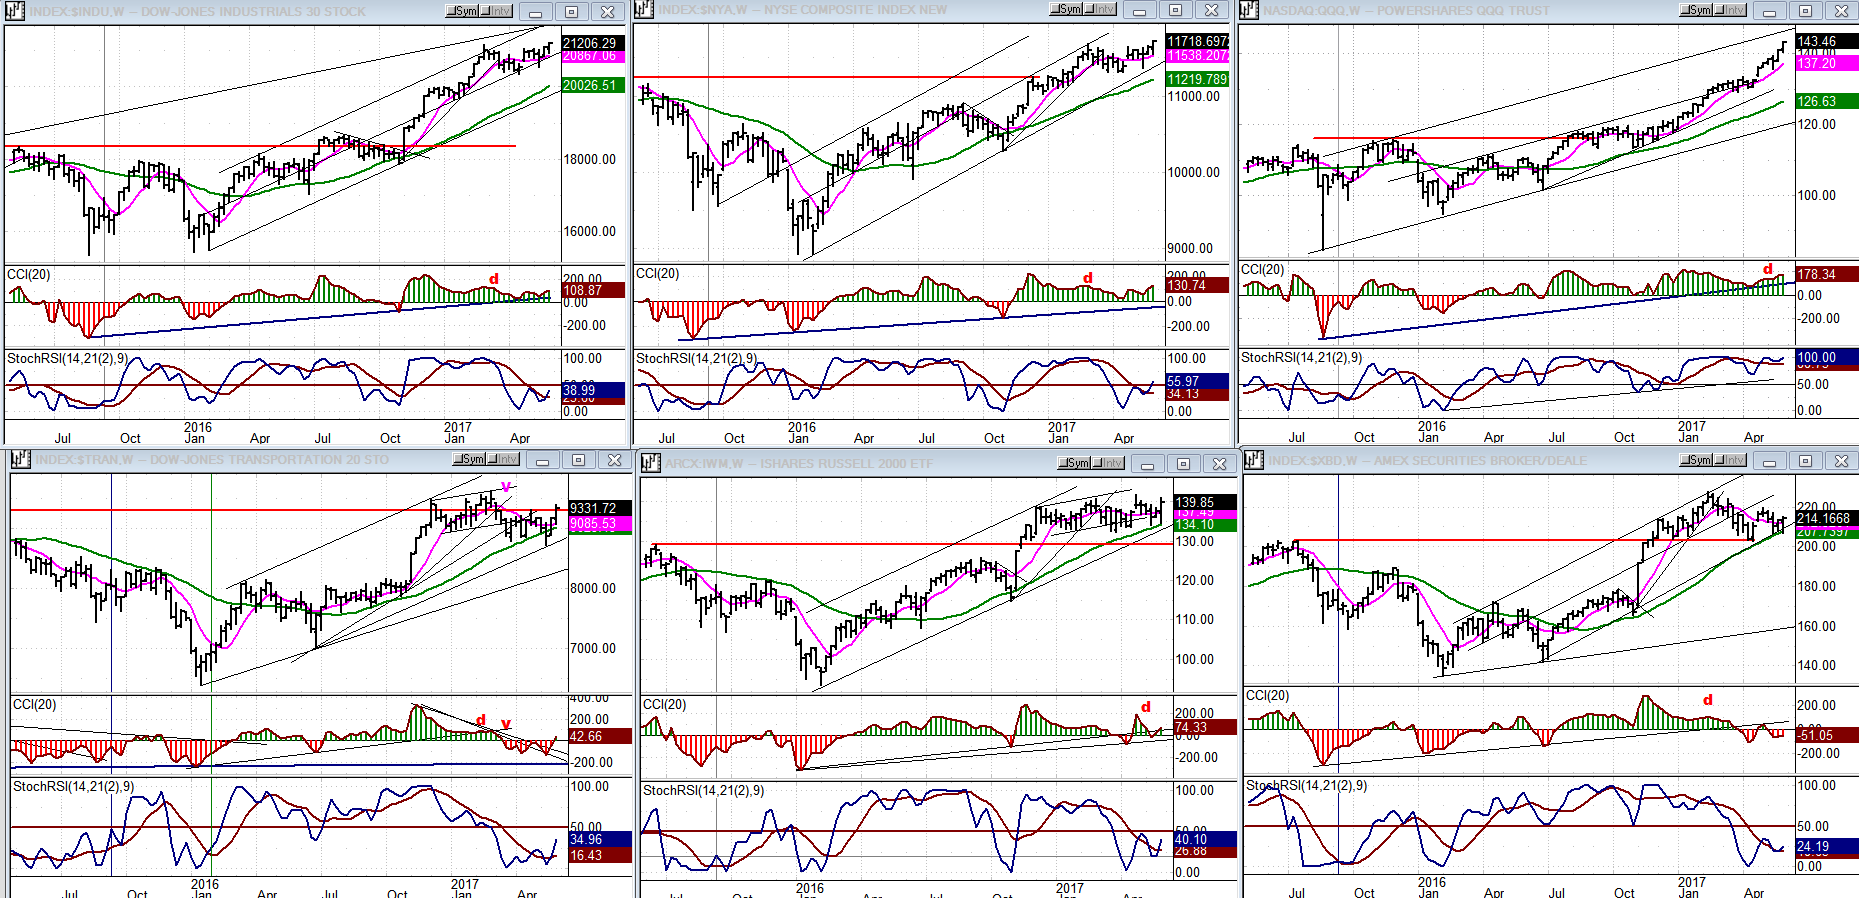
The stronger indexes in the upper tier are beginning to follow the lead of the QQQ, which is still beating its drum and is apparently unstoppable (at least for now). They have moved to a new high, which puts them outside of their congestion area. If a new uptrend has started, they should continue to move higher.
The bottom tier is rallying also with IWM (center) also getting ready to make a new high. TRAN has had a good rally but remains the weakest of the lot still trading below its 2014 high.
UUP (Dollar ETF)
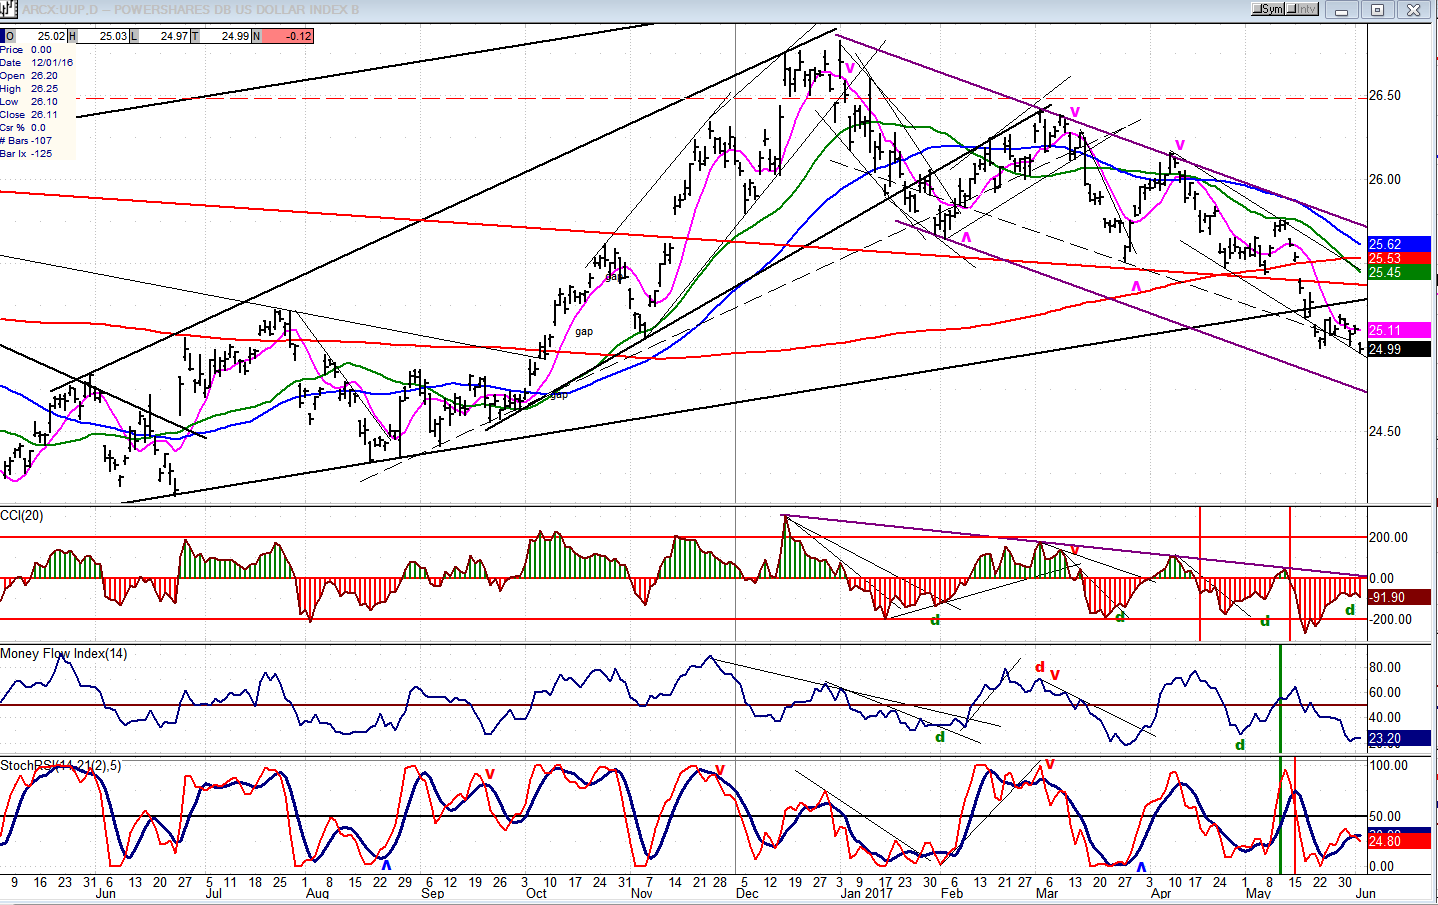
By contrast, the dollar continues to lose ground and could be on its way to the 24.50 projection. Until we see some firming, there is no sign that the correction is over.
GDX (Gold Miners ETF)
It is remarkable that, with so much weakness in the dollar, GDX has not moved higher. For that matter, the recent market strength has not pushed it lower, either. It is becoming independent, and currently could be forming a triangle pattern. The direction of the break-out should determine the next short-term trend. Even if we break to the upside, real strength necessary for an extended move will not be apparent unless we can trade aggressively above 25.50.

Note: GDX is now updated for subscribers throughout the day, along with SPX.
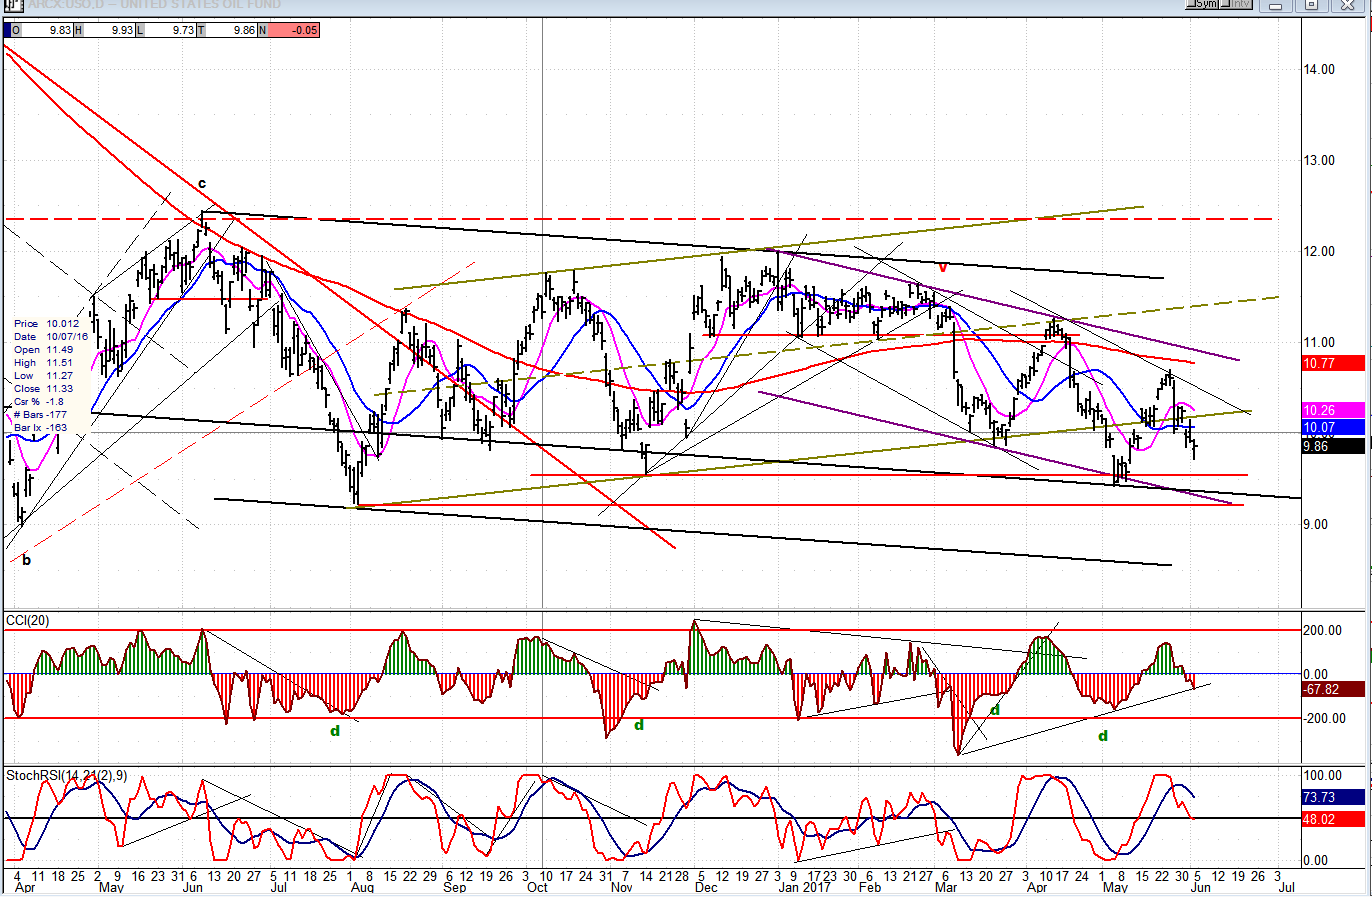
USO (US Oil Fund)
USO continues to trade within a large base and within its intermediate bearish channel. Like UUP above, there is no sign of strength, but this could change if it does not make a new low and begins to challenge the former near-term high.
Summary
Last week, SPX re-tested support and moved to new all-time highs. With all indicators showing positive momentum, the correction appears to be over with a new uptrend starting. The latest re-accumulation area gives us a count to about 2500. Unless some negativity creeps in over the next few weeks – which seems unlikely because of the current cyclical pattern -- that target looks achievable.
********
For a FREE 4-week trial, send an email to [email protected], or go to www.marketurningpoints.com and click on “subscribe”. There, you will also find subscription options, payment plans, weekly newsletters, and general information. By clicking on "Free Newsletter" you can get a preview of the latest newsletter which is normally posted on Sunday afternoon (unless it happens to be a 3-day weekend, in which case it could be posted on Monday).
The above comments and those made in the daily updates and the Market Summary about the financial markets are based purely on what I consider to be sound technical analysis principles. They represent my own opinion and are not meant to be construed as trading or investment advice, but are offered as an analytical point of view which might be of interest to those who follow stock market cycles and technical analysis.

When Andre Gratian was a stock broker years ago, a friend introduced him to technical analysis of the market. Consequently, it is not an exaggeration to say that Andre fell in love with this approach! Ever since then, it has become an increasingly important part of his professional life. Gratian has studied the works of Wyckoff, Edwards & Magee, Edward J. Dewey (cycles) and many others. However, one of my most profitable undertaking has probably been to study Point & Figure charting, which he finds invaluable in analyzing stocks and indices. If he were restricted to one methodology, this is the one that he would choose. This well-rounded background has given him what he feels to be a special insight into the stock market, facilitating the recognition of meaningful patterns and the ‘turning points’ in all trends, whether they be short or long term. Andre feels very comfortable discussing the stock market and passing on meaningful information to others. His subscribers include individuals and money managers throughout the world. Moreover, his Newsletters are currently published on several financial sites, here and abroad.


