Technical Analysis Of The Markets


Current Position of the Market
SPX Long-term trend: Uptrend continues with a serious loss of upside momentum in weekly indicators.
SPX Intermediate trend: Correction over. May be heading for about 2500, or fall slightly short of it.
Analysis of the short-term trend is done on a daily-basis with the help of hourly charts. It is an important adjunct to the analysis of daily and weekly charts which discuss longer market trends.
Tech Shake Out!
Market Overview
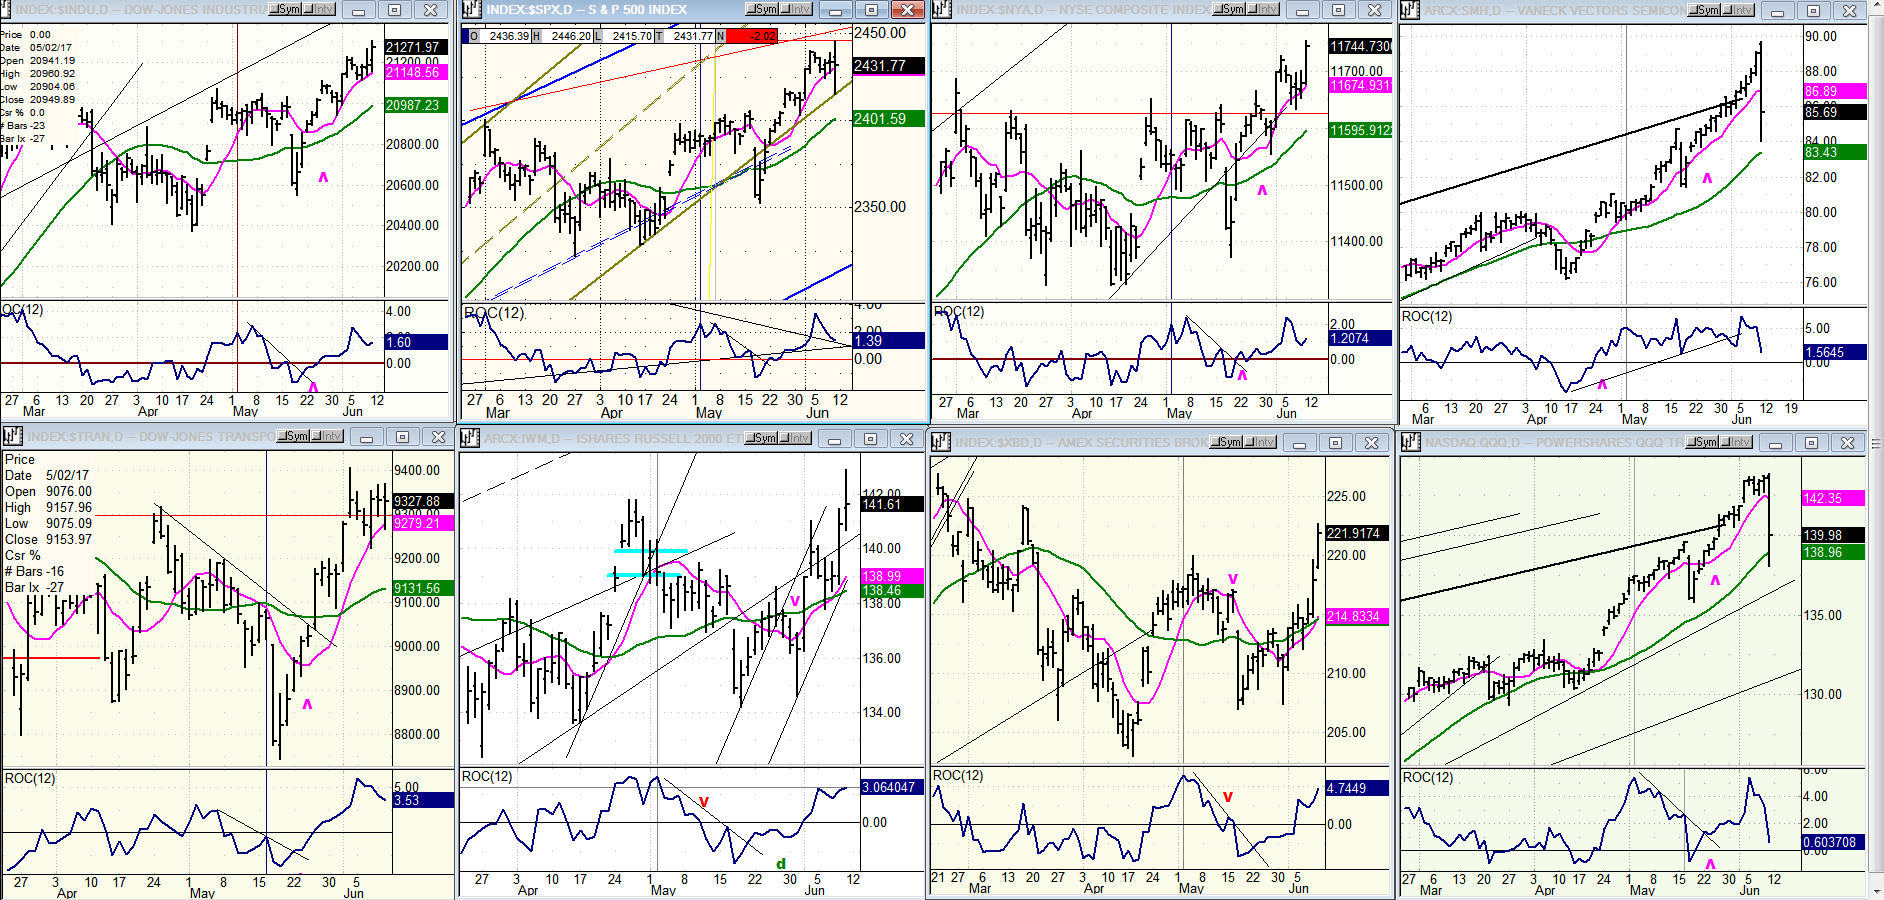
Signs that we are approaching an important top are becoming more and more evident. The most recent one came on Friday when traders decided that tech stocks had run out of oxygen and instantly brought them down to a lower altitude. Here are the hourly charts of two of them: SMH on top, and QQQ on the bottom.
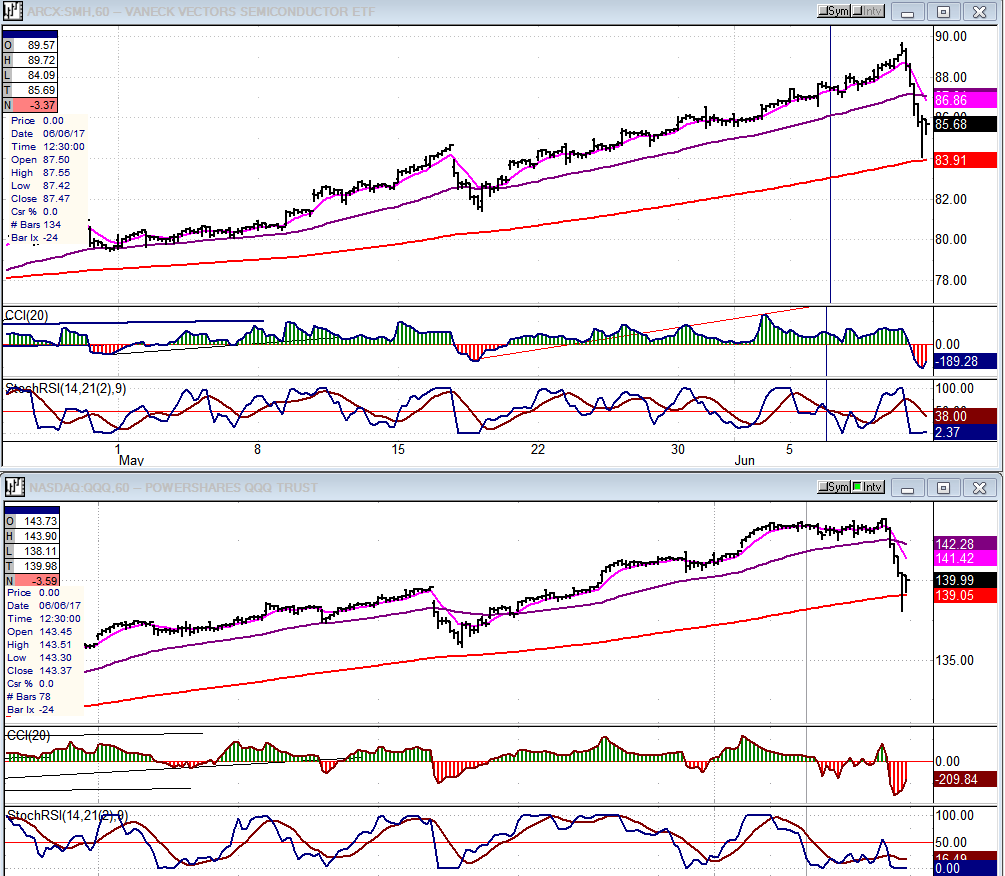
It would be reasonable to suspect that after this, these may have some difficulty making new highs. Their recovery was worse than the major averages which went along with the spontaneous correction with less enthusiasm, and recovered far better. This would suggest that the DOW and SPX still have a little more oomph left in them, but my projection to 2500 could turn out to be a little out of reach.
Until proven oherwise, I still believe that this impending correction, when it arrives, will be of intermediate nature, as opposed to the top of the bull market. However, I will keep an open mind as it unfolds.
Analysis: (These Charts and subsequent ones courtesy of QCharts.com)
Weekly Chart
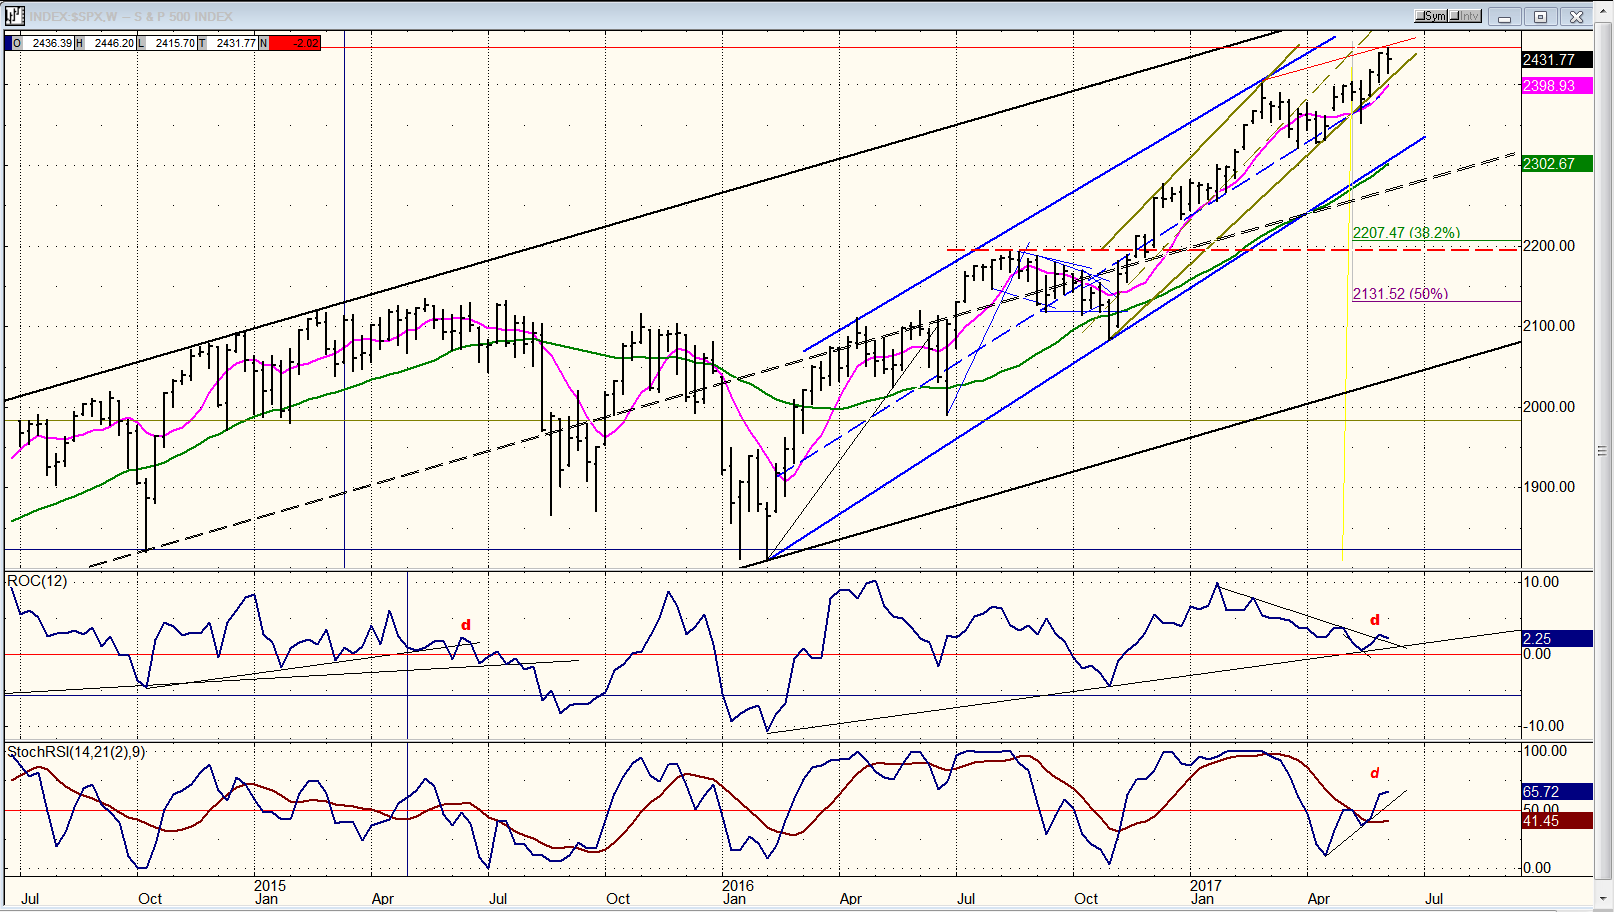
I want to start our analysis by displaying an updated weekly chart of the SPX. This is the best time frame in which to evaluate the market mood for the intemediate and long-term trends. The fact that the SPX has been able to rise so close to the top of the bull market channel (black) from 2009 suggests that there is still little long-term price deceleration taking place. By contrast, there is strong evidence of an intermediate loss of upside momentum. This is best seen in the two oscillators below: the ROC (rate of change) on top, and SRSI on the bottom. There is a considerable amount of negative divergence showing in both, in spite of the fact that the index made a new high last week.
Besides the bull market channel, there are two more progressively small channels identifying the trend to-date. The blue intermediate channel from 1810, in which SPX has been hugging its mid-channel line for the past 8 weeks, and the greenish short-term channel from 2084, in which it is hugging the bottom channel line which has already been breached once. It’s obviously only a matter of time before price starts to trade outside of first, the smaller, and then the medium-size channels.
Since we are now presuming that the trend adjustment will be for the rally from 1810, a normal correction of that magnitude would measure a minimum .382 retracement from the low, or to about 2200. With that that price corresponding to a srong support level, it should be our estimated target. We can always revise it as the decline progresses, if warranted.
Daily Chart
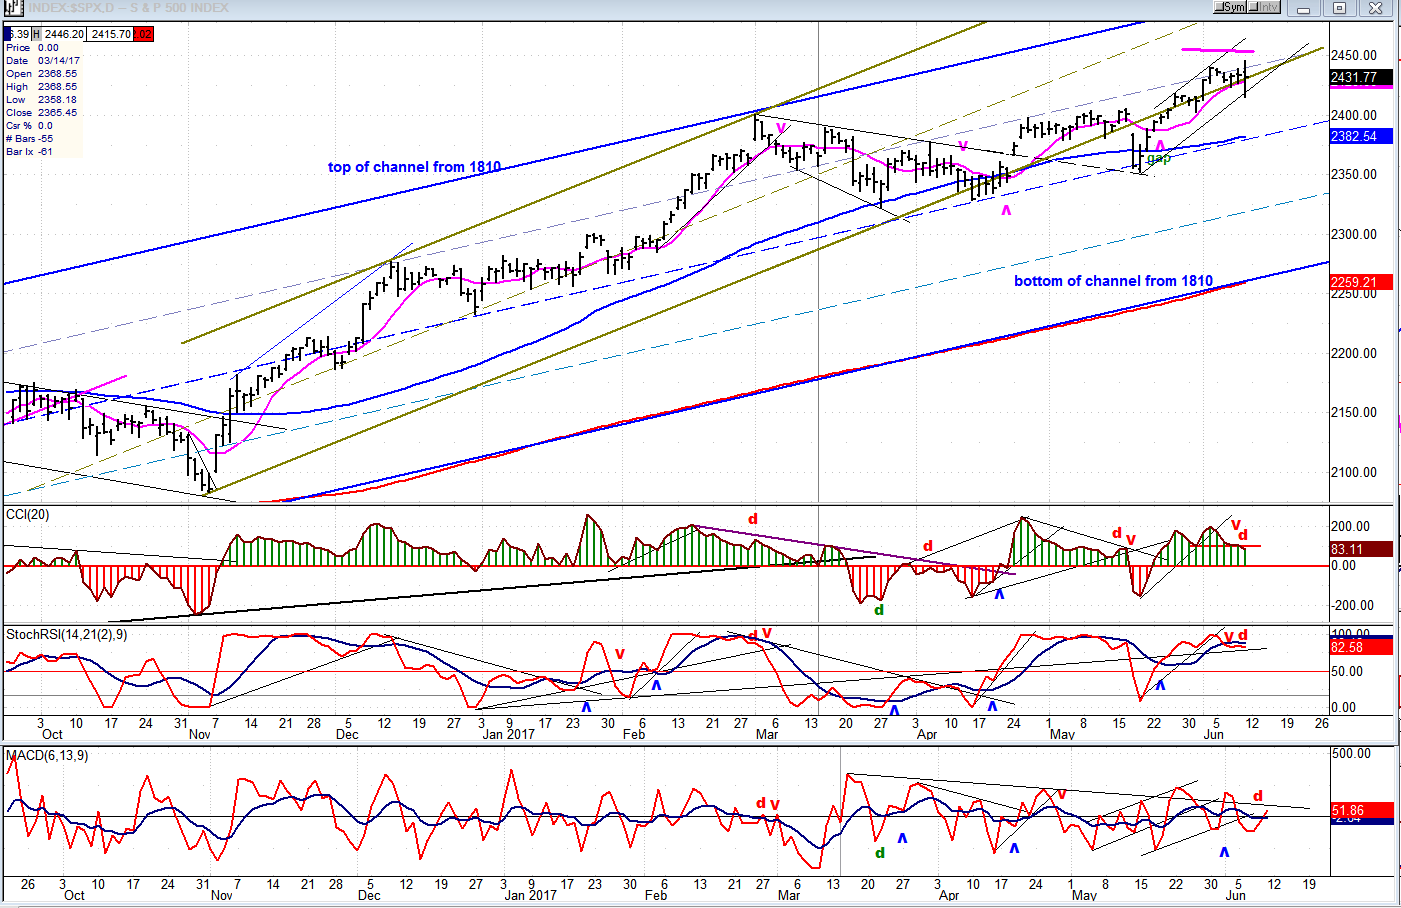
The daily chart has its own problems. The blue and greenish channels have been reproduced on this chart, but keep in mind that the price relationship to the same trend lines will vary from weekly to daily, and even more so to hourly. Last week, SPX was trying to push up into the the first quartile of the blue channel. It tried all week, but failed, with the highest and lowest points of the week coming on Friday. It’s attempt at staying inside the greenish channel from 2084 also appears to be a losing proposition; it has been gyrating around the bottom channel line and has breached it twice, being saved from a larger decline by finding support on the mid-channel line of the blue channel.
Friday’s action has created some uncertainty about what lies ahead. If this is only a short-term correction, SPX should find good support between 2400 and 2410, and then resume its uptrend to (or close to ) the stated objective. For the past three weeks, the index has been trading within a minor channel. On Friday, that channel was breached, and the next time the price falls below the channel line, what happens next will give us more clarity.
The oscillators are losing their upside momentum, with SRSI showing the first sign of weakness by making a bearish cross and showing negative divergence. The CCI, above, has also turned down over the past few days, and the lowest (A/D) oscillator is the weakest, having preceded the other two by already trading below its zero line. As long as the momentum oscillators remain positive and the A/D indicator stabilizes, the uptrend should remain in place. A confirmation that it has turned down will come when all oscillators become negative.
Hourly Chart
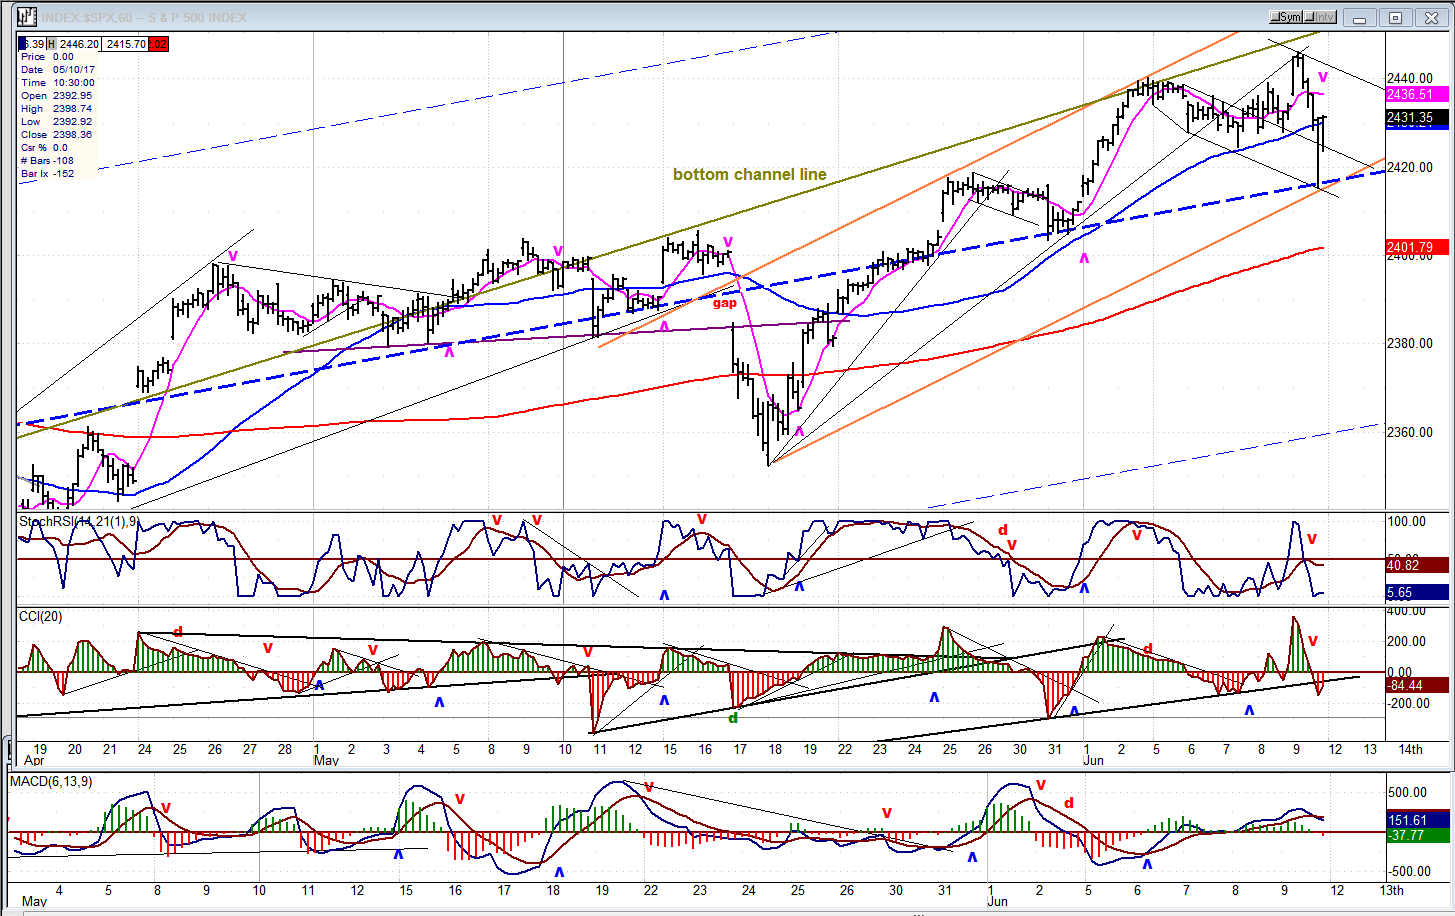
This chart has the same exact trend lines that are shown on the two other charts above. You can see that SPX has found repeated support on the mid-point line of the blue channel (including Friday) when it had the assistance of two other lines, including the orange trend line of the minor up channel (orange) of the rally. During the next few days, we should decide if this is only a short-term correction, or something more serious.
Normally, a reversal comes after the oscillators show negative divergence. This time, they did not, but some positive divergence is showing between the A/D indicator and the momentum oscillators. This could suggest that, despite its spontaneity and violence, we are only seeing a short-term correction and not a significant reversal.
An Overview Of Some Important Indexes (Daily Charts)
Friday’s violent reaction in the tech sector cannot be assessed correctly by looking at a weekly chart, particularly on this scale. I am therefore showing daily charts of our major leading indexes, and have added a couple more. I have already posted above, hourly charts of the SMH and QQQ (far right) and, within the entire group, they present a sharp contrast to how the others (non-tech) reacted to the sell-off in their section. From this, we can probably infer that there is no evidence that this was representative of the entire market, and that we will need more proof that it has made its final high of the intermediate trend which started from 1810.
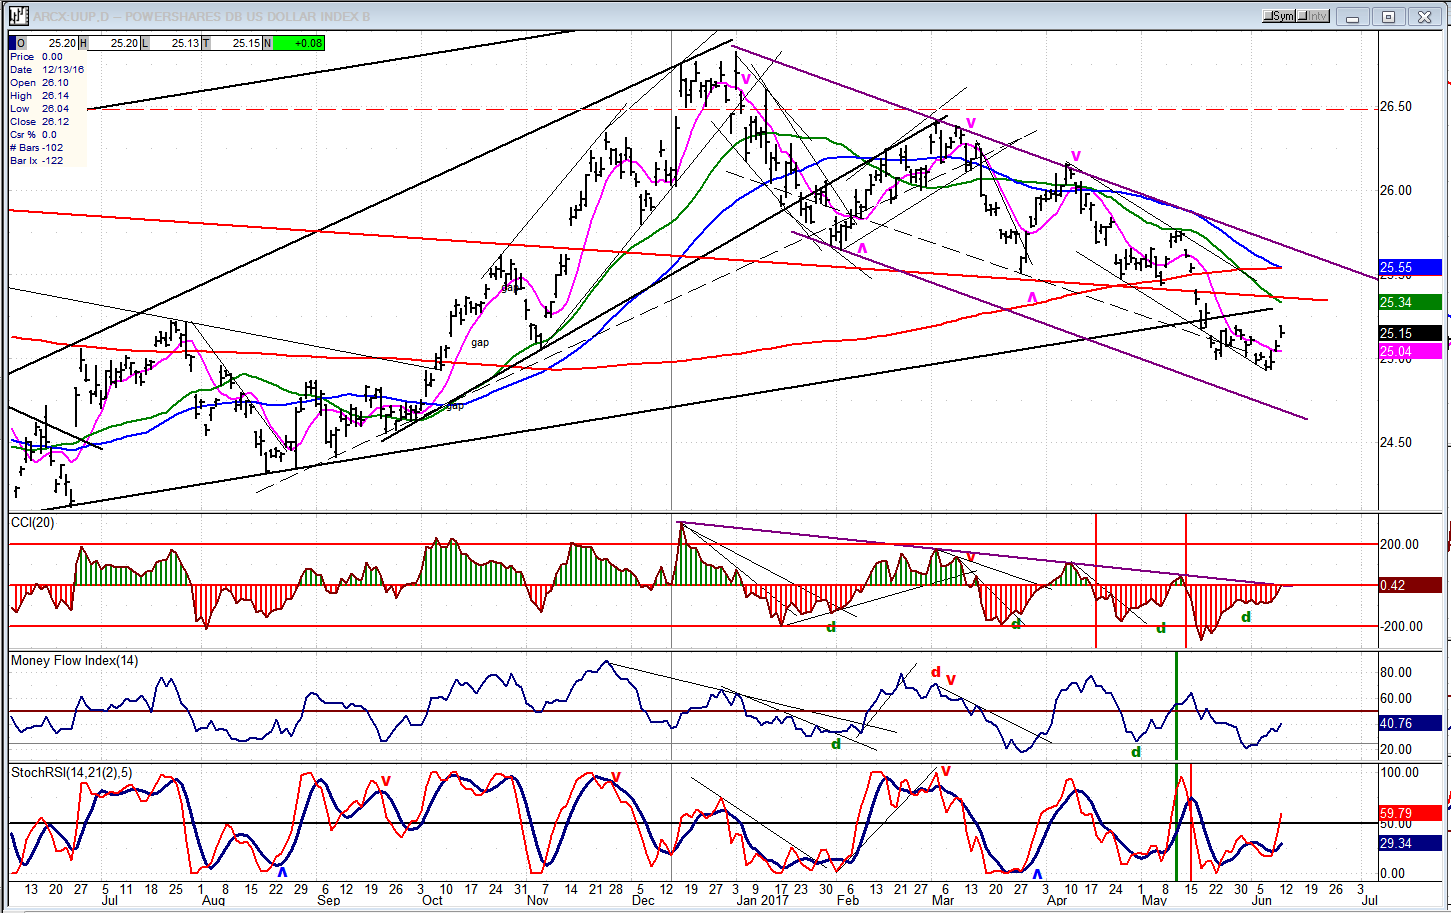
UUP (Dollar ETF)
UUP has found support where it should have. If you look on the left of the chart, you can see that it held in the area of the July 2016 peak. But that does not mean that its correction is necessarily over. It will have to show much more strength, and will have to successfully challenge the considerable overhead resistance before that can be determined. It could still falter in this bounce and fill the 24.50 P&F target before having a genuine reversal.
GDX (Gold Miners ETF)
GDX recently made a futile attempt at breaking out of its broad consolidation pattern which is now about six months old. A clean break-out which surpasses its former peak would strongly imply that it has resumed its longer-term uptrend -- which is obviously not yet the case. The question is: “How much more time is left before it is in a position to do it?” Perhaps not as long as SPX remains in an uptrend.
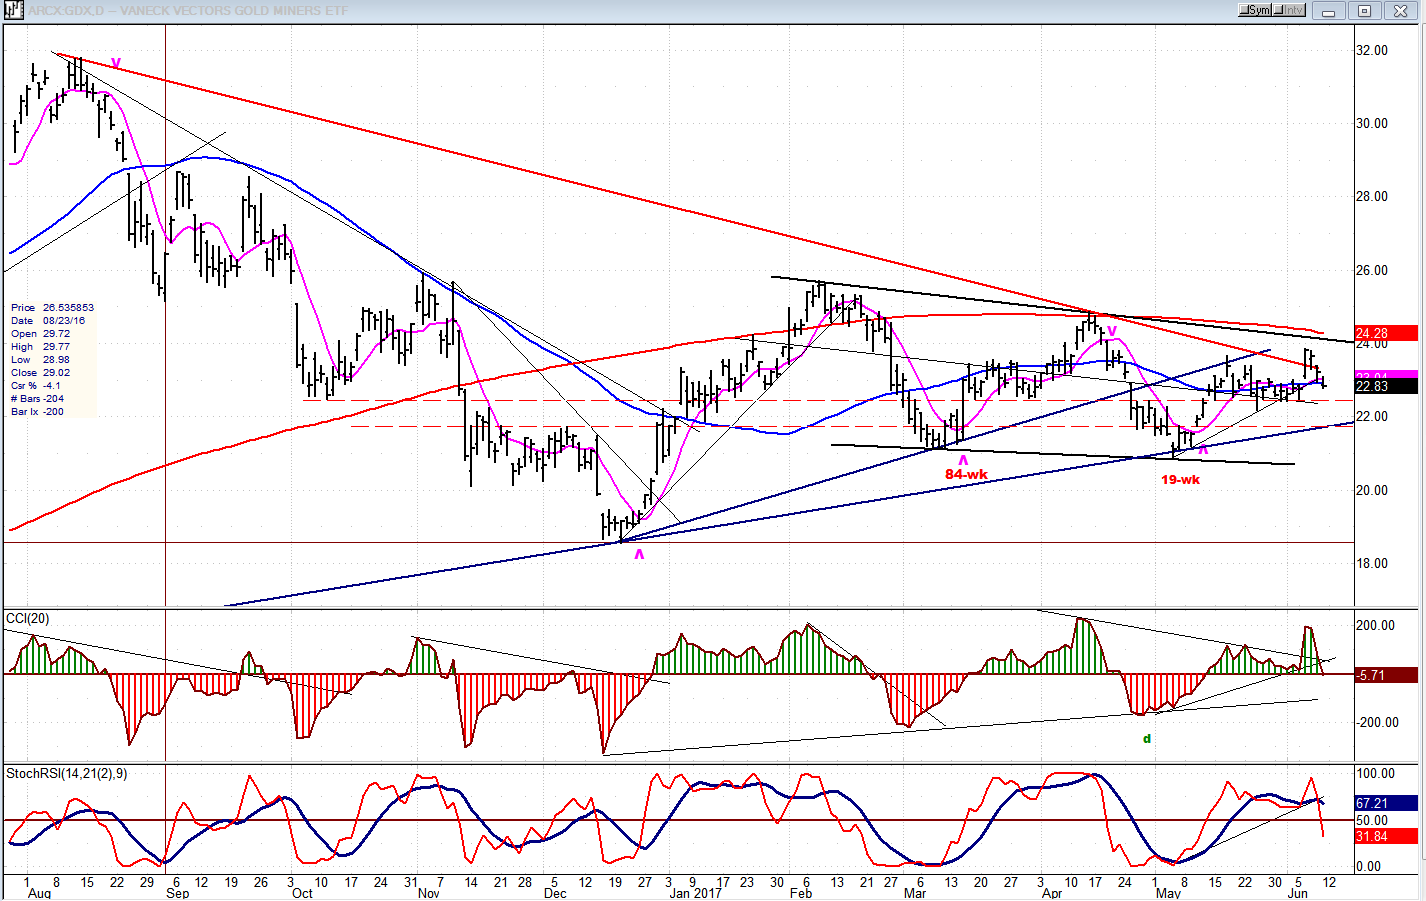
Note: GDX is now updated for subscribers throughout the day, along with SPX.
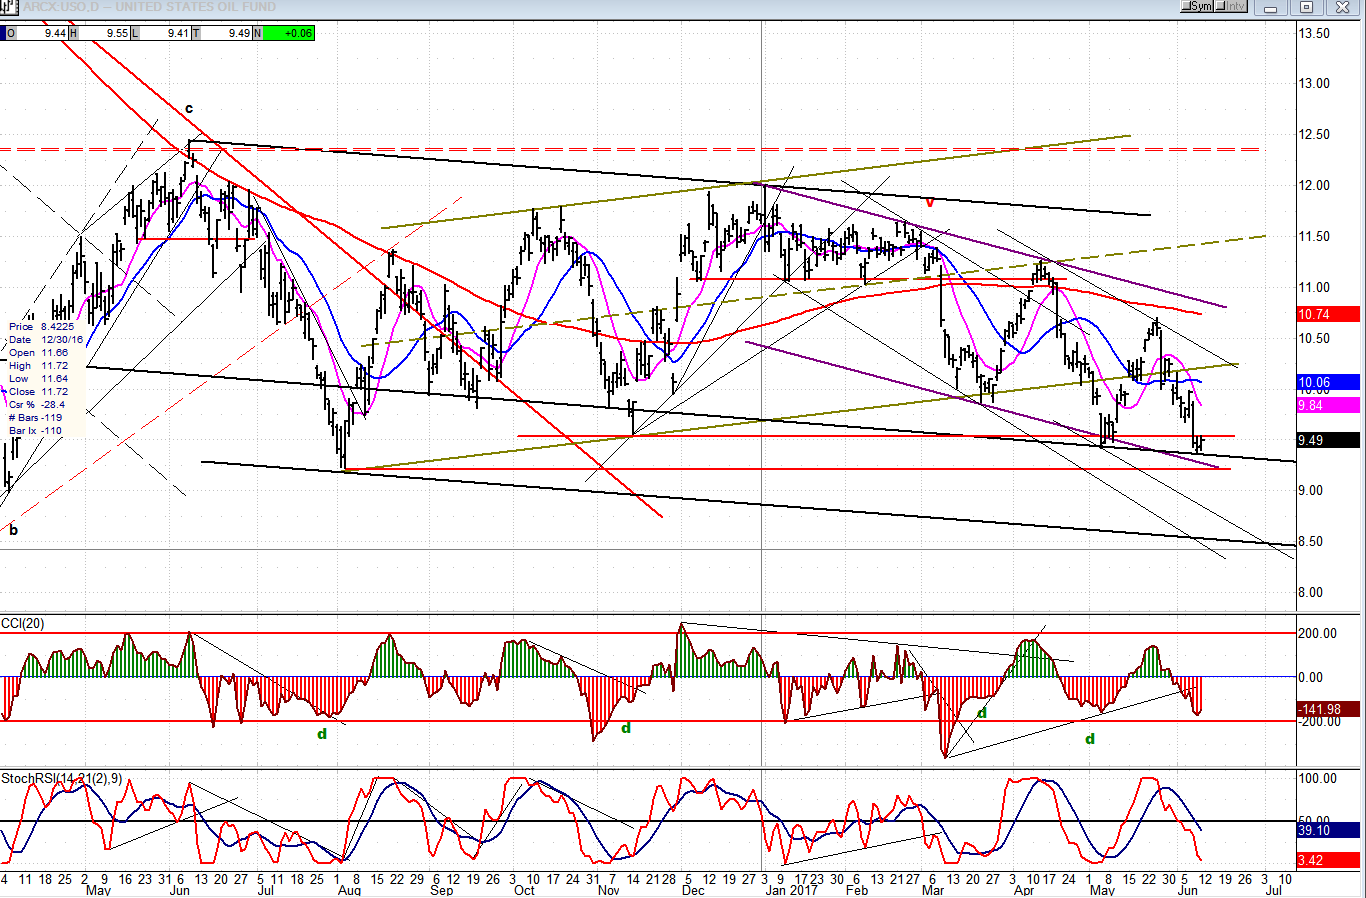
USO (US Oil Fund)
After over a year of base building, USO finds itself close to the low of the pattern. We’ll need to see more (some) sign that buyers are returning before we can again look for a potential break-out of the base.
Summary
Friday’s spontaneous profit-taking in the overbought tech sector affected SPX more than it did the DJIA, because the former contains many more high flyers. However, considering the general market’s “yawn-ish” response to the sell-off, it is too soon to decide that the rally from 1810 is over. But the upside target for the final high may have to be revised downward after we have more clarity.
********
For a FREE 4-week trial, send an email to [email protected], or go to www.marketurningpoints.com and click on “subscribe”. There, you will also find subscription options, payment plans, weekly newsletters, and general information. By clicking on "Free Newsletter" you can get a preview of the latest newsletter which is normally posted on Sunday afternoon (unless it happens to be a 3-day weekend, in which case it could be posted on Monday).
The above comments and those made in the daily updates and the Market Summary about the financial markets are based purely on what I consider to be sound technical analysis principles. They represent my own opinion and are not meant to be construed as trading or investment advice, but are offered as an analytical point of view which might be of interest to those who follow stock market cycles and technical analysis.

When Andre Gratian was a stock broker years ago, a friend introduced him to technical analysis of the market. Consequently, it is not an exaggeration to say that Andre fell in love with this approach! Ever since then, it has become an increasingly important part of his professional life. Gratian has studied the works of Wyckoff, Edwards & Magee, Edward J. Dewey (cycles) and many others. However, one of my most profitable undertaking has probably been to study Point & Figure charting, which he finds invaluable in analyzing stocks and indices. If he were restricted to one methodology, this is the one that he would choose. This well-rounded background has given him what he feels to be a special insight into the stock market, facilitating the recognition of meaningful patterns and the ‘turning points’ in all trends, whether they be short or long term. Andre feels very comfortable discussing the stock market and passing on meaningful information to others. His subscribers include individuals and money managers throughout the world. Moreover, his Newsletters are currently published on several financial sites, here and abroad.


