Technical Analysis Of The Markets


Current Position of the Market
SPX Long-term trend: Uptrend continues with a serious loss of upside momentum in weekly indicators.
SPX Intermediate trend: Correction over. May be heading for about 2500, or fall slightly short of it.
Analysis of the short-term trend is done on a daily-basis with the help of hourly charts. It is an important adjunct to the analysis of daily and weekly charts which discuss longer market trends.
Higher Highs Still Likely
Market Overview
The wave of profit-taking which occurred over the past 10 days was pretty much confined to the overbought tech sector which, by the end of the past week had pretty much stabilized. The DJIA essentially ignored the whole thing and went on to make a new all-time high. SPX, which includes many of the high flyers, underwent a consolidation/correction that appeared to be complete by Friday’s close. If so, it should now be ready to progress to its next target of about 2455. This projection was first determined by the congestion pattern established just above 2330, and it should be confirmed if we can resume the uptrend on Monday.
The market action of the past week has done nothing to change my original estimate that an intermediate top is near but still ahead of us. The Weekly chart continues to be in an uptrend with negative divergence displayed by its indicators. The same can be said for the daily trend. A positive opening on Monday morning would most likely trigger a buy signal on the hourly chart and generate another attempt at reaching the projection level mentioned above while, a the same time, extend the life span of the uptrend.
Analysis: (These Charts and subsequent ones courtesy of QCharts.com)
Daily Chart
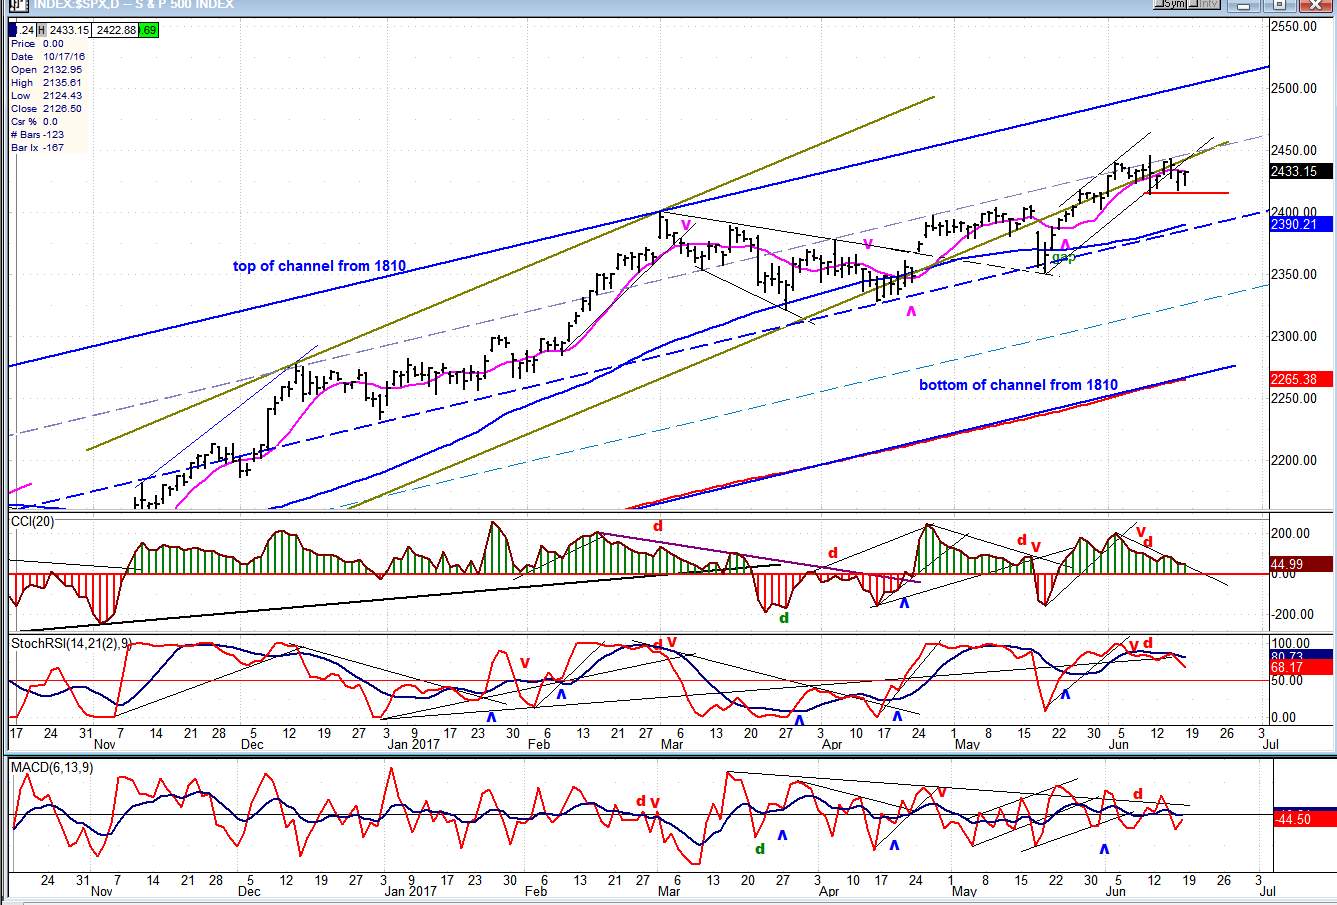
SPX continues to be confined to the second quartile of a large, intermediate (blue) channel which originated at 1810. The profit-taking of the past few days has created a consolidation pattern that can serve as a platform from which it can propel itself to a new high next week. This push should be limited to about 2355, complete the minor uptrend which started at 2353, and be followed by another minor corrrection. While it is possible that this will be the final high, it is more likely that there will be one more high after that.
There is another factor which has limited the upward reach of the index. A trend which started at 2084 formed another, less important (greenish) channel which concluded at 2400, but the correction which folowed was not able to make a significant exit out of that channel and, since April, price has gyrated within a small range around the bottom channel line.
The action of the index described above will make it very simple to determine when it has made a top. The next correction which fails to find support at the larger channel’s mid-point (dashed blue line) will confirm that the high was reached and that an important correction has started. Until this happens, we can assume that the index will continue to crawl upward, within the parameters mentioned above.
The oscillators at the bottom of the chart are also telling us that the index is still in an uptrend, and will remain so until they have all turned down and become severely negative. The most likely scenario will be for the 2355 high to be followed by another minor correction. Only until after the next rally ends (2480-2500?) will the uptrend from 1810 be likely to end.
Hourly Chart
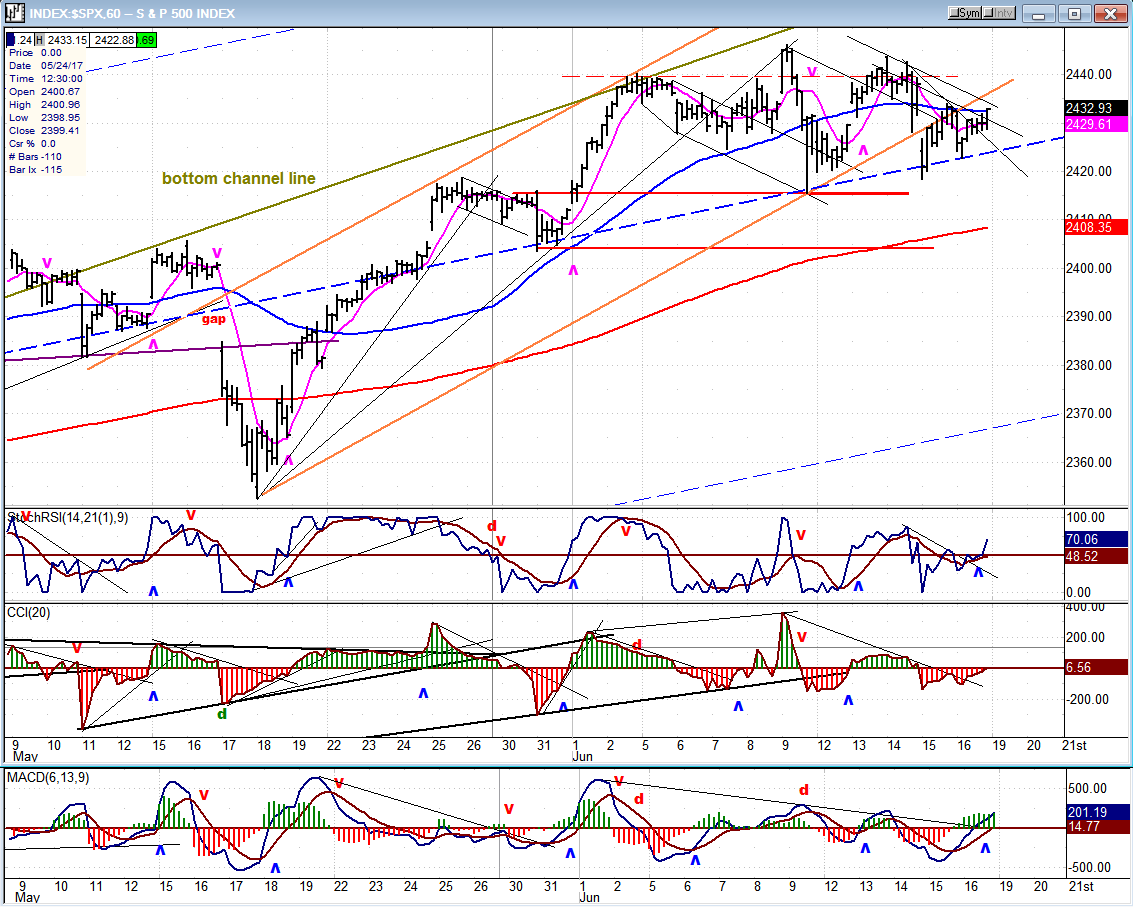
The 2446 projection was met with some expectation that it would be followed by a move to 2453, but this was cut short by the spontaneous selling which took place in the tech sector. After an a-b-c correction, we are now set to move to that slightly higher target to complete the move which started at 2353 – if we can get past the minor downtrend line and above the former peak at 2334.
On Friday, there was a little spurt of buying at the close which augurs well for a follow-through on Monday morning. The A/D oscillator closed on its best level of the day and, along with SRSI, closed positive. If we can get CCI to follow their lead at Monday’s opening, we should be on our way to about 2455.
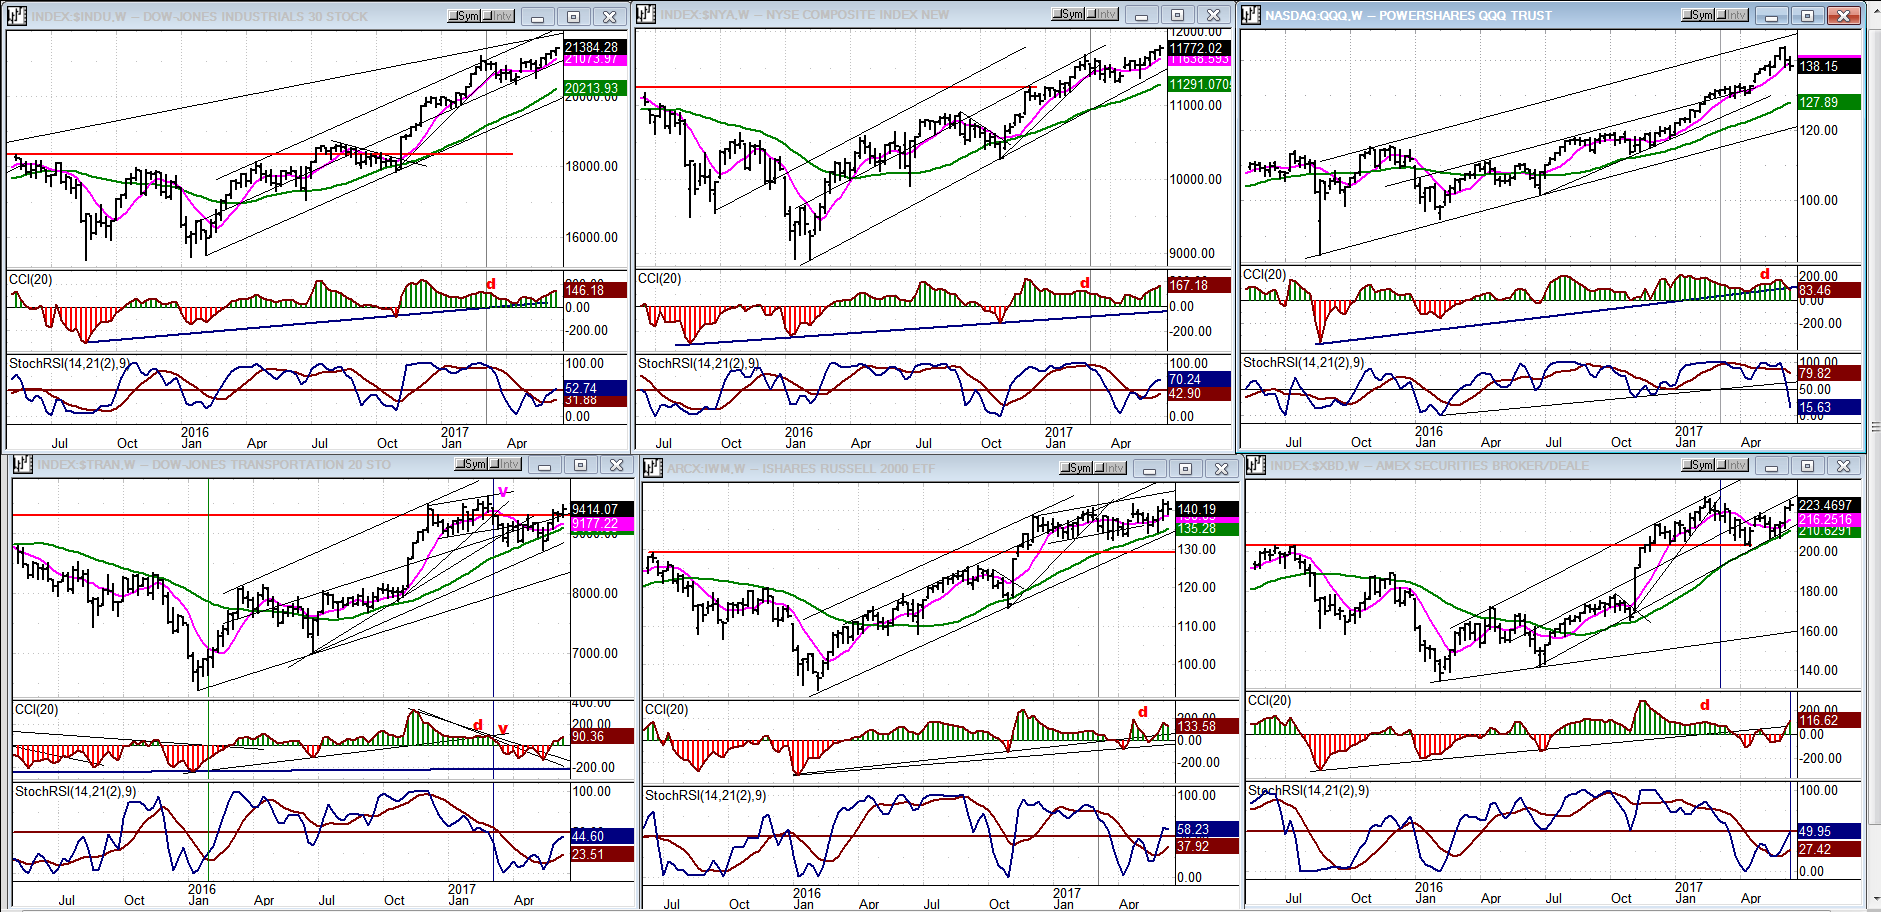
An Overview Of Some Important Indexes (Daily Charts)
The odds that SPX will make a new high are pretty good, considering that DJIA, NYA (top left and center) and IWM (bottom center) did so last week. XBD (bottom right) almost did. Even TRAN (bottom left) made a valiant effort to do the same, but came up short. There was still too much pressure on the techs for QQQ to participate in the bullishness, and it may be done, along with the FAANGs for what’s left of the uptrend.
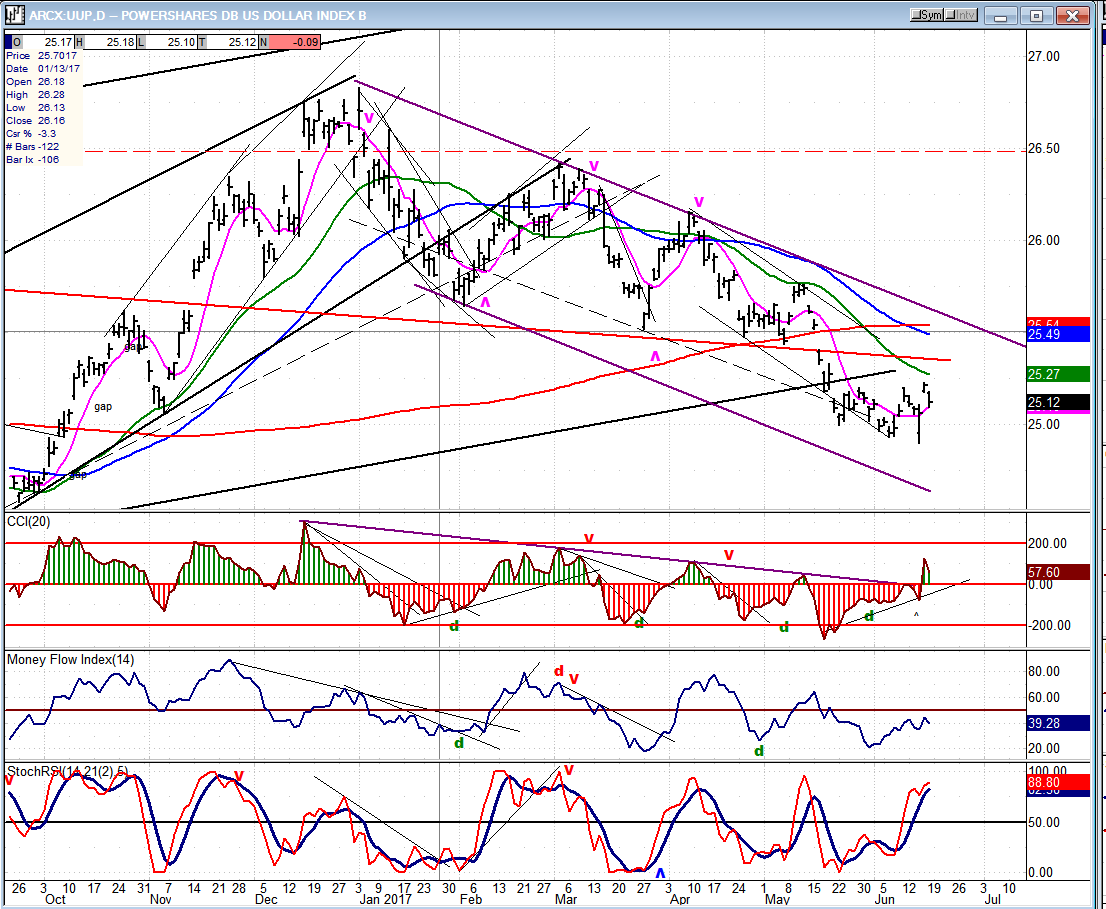
UUP (Dollar ETF)
UUP was due for a bounce, but its rally looks limited by nearby overhead resistance, and more basing action should be necessary before it is ready to challenge the top line of its corrective channel.
GDX (Gold Miners ETF)
If GDX can remain above 21 for the rest of its correction, it will have built a nice base on its P&F chart from which to launch its July rally. This is when the next 10-wk cycle should bottom, but there’s a cluster of less important cycles due to make their lows before the end of June which could soften the impact of the weekly cycle.

Note: GDX is now updated for subscribers throughout the day, along with SPX.
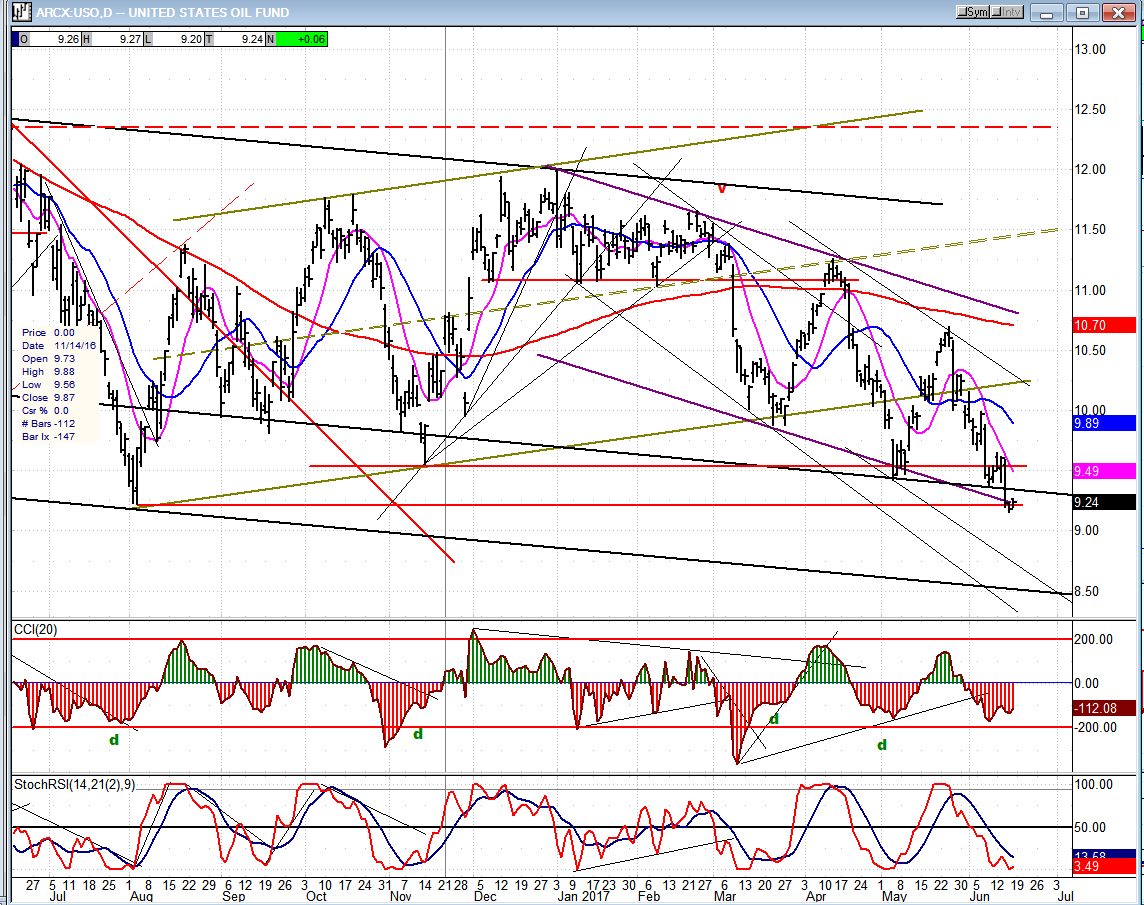
USO (US Oil Fund)
Is there any hope for USO to get back into a meaningful uptrend? Perhaps, but I would not hold my breath until it does. The oil glut continues and the action of oil stocks is saying that it’s not going to end anytime soon!
Summary
Although SPX was more affected than the Dow (which closed at a new high on Friday) by the tech correction it, too, is expected to continue its uptrend for a while longer. I believe that the 20-wk cycle, due to bottom in August, will put an end to the rally from 1810 and trigger a multi-month correction. This probably gives SPX about a month to make its final high between 2480 and 2500 before rolling over. Nevertheless, let’s keep a close watch on its action after the next target of 2455 is reached is reached.
********
For a FREE 4-week trial, send an email to [email protected], or go to www.marketurningpoints.com and click on “subscribe”. There, you will also find subscription options, payment plans, weekly newsletters, and general information. By clicking on "Free Newsletter" you can get a preview of the latest newsletter which is normally posted on Sunday afternoon (unless it happens to be a 3-day weekend, in which case it could be posted on Monday).
The above comments and those made in the daily updates and the Market Summary about the financial markets are based purely on what I consider to be sound technical analysis principles. They represent my own opinion and are not meant to be construed as trading or investment advice, but are offered as an analytical point of view which might be of interest to those who follow stock market cycles and technical analysis.

When Andre Gratian was a stock broker years ago, a friend introduced him to technical analysis of the market. Consequently, it is not an exaggeration to say that Andre fell in love with this approach! Ever since then, it has become an increasingly important part of his professional life. Gratian has studied the works of Wyckoff, Edwards & Magee, Edward J. Dewey (cycles) and many others. However, one of my most profitable undertaking has probably been to study Point & Figure charting, which he finds invaluable in analyzing stocks and indices. If he were restricted to one methodology, this is the one that he would choose. This well-rounded background has given him what he feels to be a special insight into the stock market, facilitating the recognition of meaningful patterns and the ‘turning points’ in all trends, whether they be short or long term. Andre feels very comfortable discussing the stock market and passing on meaningful information to others. His subscribers include individuals and money managers throughout the world. Moreover, his Newsletters are currently published on several financial sites, here and abroad.
More from Gold-Eagle


