Technical Analysis & Trading Signals


Introduction
From the feedback and comments I receive everyday from readers and subscribers, I have come to realize that most traders do not have the ability to differentiate between TA (technical analysis) and a trading signal. The unfortunate result is a poor return on their investments, and worse yet, a gradual loss of confidence in themselves, and eventually questioning if the whole TA thing is nothing more than voodoo.
Trade what we see, not what we think.
Just another cliché? Absolutely not.
The thinking (technical analysis)
The thinking part belongs to TA. By using what we know, we try to lay out a road map for the markets, to know where we are coming from, and where we are going. There are many methods and approaches to TA, and each has its own limitations. Elliott waves, Gann, The Delta phenomenon, cycle analysis, time and price retracement, the Bradley model, on and on…..welcome to the supermarket of technical analysis! Without insulting to any of these folks, I always insist that TA is nothing more than an educated guess. Sometimes the markets are very accommodating, and sometimes they are not.

Here is a simple example of TA in real time.
The $HUI rallied to resistance on Friday, and what I expect is a pullback to form a "handle" in what technicians call a "cup with handle" pattern. Upon a breakout of this pattern, price will head to the next resistance, which is at around the 230 level, where it may form another cup with handle. This common pattern occurs in all time frames, specifically in a bull market when a sell off is met with enthusiastic buyers to bring prices back where the sell off began, and upon a little struggle between the bulls and bears, the bulls win and we have a breakout, then onwards to the next level.
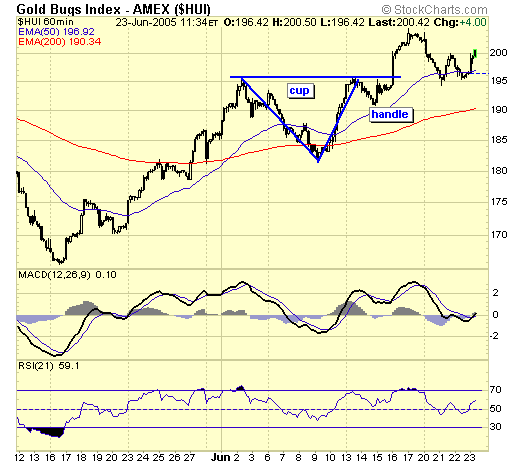
This is the $HUI's hourly chart, again, in real time.
The sharp pullback from the 195 level was met with strong buying at the 183 level, resulting in an intraday cup with handle, and a subsequent breakout, with a price target of 207.

This is the $GDM from a long term perspective.
The five year sell off began in 1996 and ended in 2001, and it only took three years for buyers to push the index back up to resistance, the level where the sell off began. And since meeting resistance in Dec 2003, the market has been building a handle, creating whipsaws for both bulls and bears. This struggle between bulls and bears will continue, until the bulls win. (according to the pattern) And what a breakout it will be!
Summary
So, with this fantastic piece of TA, when and where do we buy? Will the market accommodate us by doing exactly, according to my clever little lines and patterns? This is where trading signals take over. TA is the road map, and trading signals are the traffic lights. Once we know where we are going, we must obey the traffic lights so that we will reach our destination in one piece. Going thru red lights or stalling at green lights may not get us killed, but it will disrupt our journey, and personally, I've been there and done that, many times. Now I am an advocate for road safety and safe driving. Lets check out the traffic lights…
The seeing (trading signals)
I have five trading signals from my trading model.
BSBS, BRSS, TLBBS, TLBSS, TLB. (anyone wishing a complete list of signals and acronyms I use can download from my website, address above)
I let these signals guide us in and out of the markets. Like traffic lights, we go on green, and stop on red.

Again, in real time, we had a TLBBS (buy signal) on 5/24. This was the first buy signal from the sell off which began in March, with the presumption that it was just a tradable bounce.
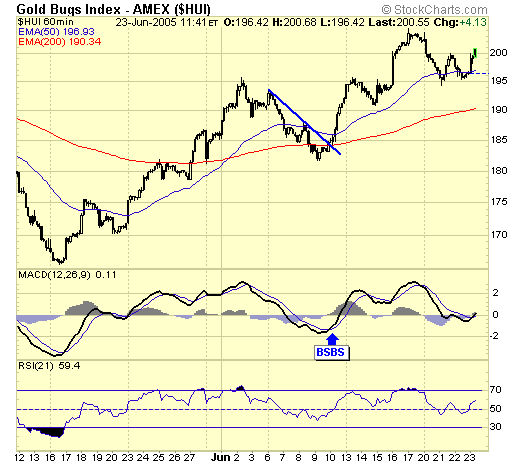
Then on Friday 6/10, the hourly chart gave another buy signal (BSBS), and alert was sent out to subscribers.

Now, with this week over, we have a confirmation of a weekly BSBS, which is a major buy signal. This third buy signal means that we have a buy signal in all three time frames, the first time it ever happened since the bull market began. Anyone who is not 100% invested by now and wishes to buy or add should do so on weakness and pullbacks, as I do not expect another signal anytime soon.
Summary
The markets are dynamic and subject to constant change, an axiom I preach and practise. My TA has turned me bullish, as the outlook is very promising indeed. But I did not buy because I was bullish, I bought because I had buy signals. In fact, I was bearish when the first buy signal occurred, expecting nothing more than a tradable bounce. I was still somewhat hesitant at the second buy signal, not expecting a whole lot. Then this week, the cycle reversed up, the weekly BSBS is confirmed, COT model has just bottomed, the yield spread has begun to widen again…..enough bullishness to yell "to da moon". But I won't. Respect and obey the traffic lights, and we'll reach our destination.
Speaking from my own experience in this journey of financial investing, it is always the "thinking" which gets me into trouble, and the "seeing" which gets me out.
Trade what we see, not what we think.
Markets need not to be predicted, or forecasted; just followed.
Peace and profits,
Jack Chan at www.traderscorporation.com
23 June 2005

Jack Chan is the editor of Simply Profits, established in 2006. Chan bought his first mining stock, Hoko Exploration, in 1979, and has been active in the markets for the past 37 years. Technical analysis has helped him filter out the noise and focus on the when, and leave the why to the fundamental analysts. His proprietary trading models have enabled him to identify the NASDAQ top in 2000, the new gold bull market in 2001, the stock market top in 2007, and the US dollar bottom in 2011.
More from Gold-Eagle


