Technical Warnings For Gold?


 Last week's trading saw the gold market forming its high in Tuesday's session, here doing so with the tag of the 1906.90 figure. From there, a sharp decline was seen into later in the week, with the metal dropping all the way down to a Thursday low of 1871.80 - before bouncing off the same into late-day Friday.
The Near-Term Picture
As mentioned in recent posts, there was the decent potential for a June correction for gold, due to the configuration of several of the short-term cycles that we track - one of which is the 34-day cycle, shown again on the chart below:
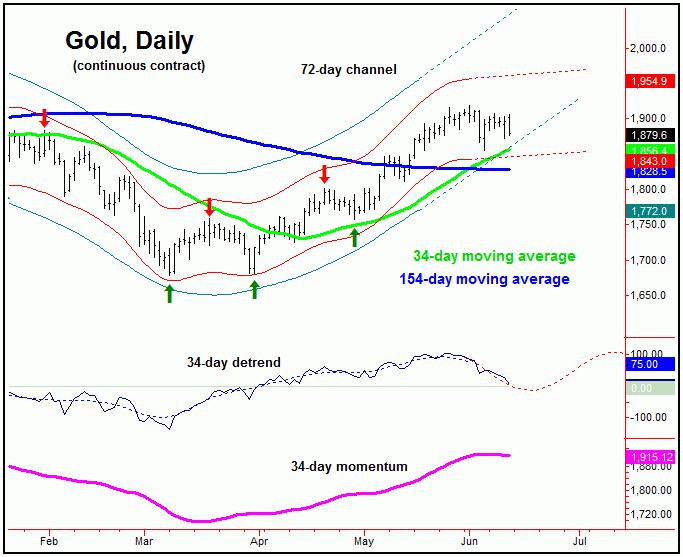
In terms of price, gold did see a sharp decline off the highs to start the month of June, with the metal dropping from a peak of 1919.20, down to a more recent low of 1855.60. That decline was the largest percentage dip seen since dropping into the late-April bottom, thus meeting any normal low-end expectations for a short-term correction.
With the above said and noted, the low of 1855.60 may well end up as the bottom for the expected decline. Even said, since the 34-day moving average will normally act as a magnet with the 34-day component, the downside 'risk' is still to this moving average in the next week or two, where the next 34-day trough is projected to occur.
For the very short-term, the strength seen off the 1855.60 swing low is primarily the result of a smaller 10-day wave that we also track, and which is shown below:

With the above said and noted, the upward phase of this 10-day cycle is deemed to be in force, though is currently being stymied (at least somewhat) by the downward phase pressure from the larger 34-day wave. With the position of the latter, we could see continued choppy action in the next week or two, at least until the next trough for that 34-day cycle forms.
Mid-Term Picture for Gold
For the mid-term picture, the larger-degree cycles are deemed to be pointing higher into late-Summer, with that move higher coming, in part, from our larger 310-day wave:
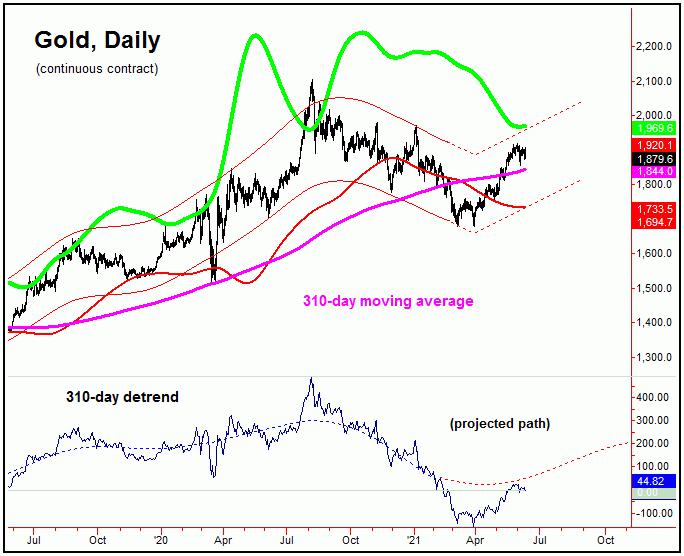
Stepping back then, we can see that our larger 310-day component is projecting overall higher prices in the coming months, which favors any short-term correction phases - such as with the 34-day cycle - to end up as countertrend. With that, the overall uptrend is projected to remain intact into late-Summer, before setting up for a sharp correction into what looks to be the Autumn of this year.
Technical Problems
Even with the overall uptrend projected to remain intact for the months ahead, there are some technical warning signs that are worth honorable mention. The main one of these comes from our Mid-Term Breadth index for the gold market, which is shown below:
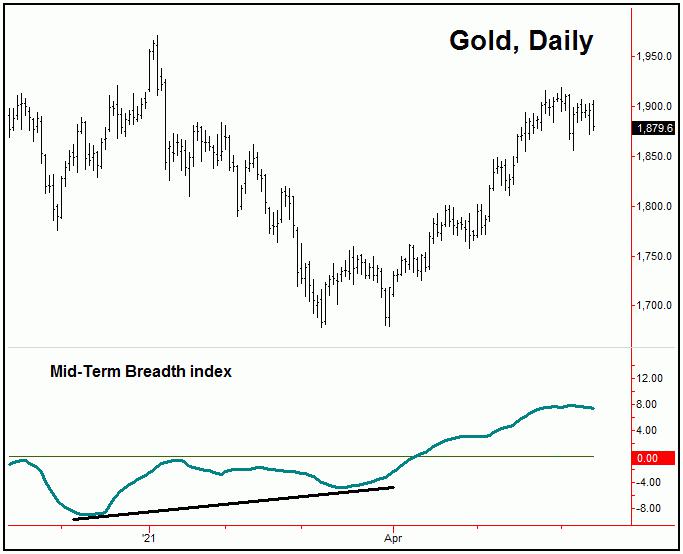
Our Mid-Term Breadth index for gold turned higher - off a divergent low - back in March of this year, which I noted to be a bullish technical indication at that time, due to the expectation of a larger-degree low forming. Obviously, prices responded, rallying some 240 points into the most recent swing high.
Having said the above, our breadth index has recently begun to turn to the downside, which is noteworthy, considering the position of our 34-day time cycle. Even said, I don't view this to be a problem for the larger uptrend - at least until the point where some sizeable divergence should develop.
The Overall Bottom Line
All said then, as mentioned in past articles, any short-term corrections are expected to end up as countertrend affairs, giving way to higher highs, upon completion. At some point around late-Summer of this year, technicals will start to take on a much greater importance, something we will be watching with keen interest as we move closer to that timeframe. More on all as we continue to move forward.
Jim Curry
The Gold Wave Trader
http://goldwavetrader.com/
http://cyclewave.homestead.com/
*********


