Trends Still Mixed But . . .


 Just over midway through the first month of 2016 and – as reported last week – the trends are still mixed; but a different mix. The precious metals had started the year so bullish, have gone stagnant. Gold is stuck around the psychological $1100 level and silver seems unable to get away from $14.00 – with a bias to the down-side and infrequent spikes higher. On Wall Street the bulls have returned to carry the DJIA steeply higher out of a near double bottom. A flight to safety away from equities early last week had the yield on the 10-year Treasury bond spiking to a new recent low, but now the bear has returned. WTI crude is the opposite, bullish again after having dipped well below $30/bbl.
Volatile changes in direction, often without clear evidence of why thy are occurring, seems to be the ‘new normal’ for 2016. However, these fickle and spiking markets without major adjustments in the fundamentals are a troublesome sign that people have become extremely nervous. They over-react to anything out of the ordinary – and given the unstable nature of the world there are so many frequent events and news flashes that can send a markets or all markets off on a tangent at any time. Too many shaking fingers resting on hair triggers!
In the recent past we saw Greece take a sudden sharp political turn as many voters found cohesiveness in anti-austerity, changing their political landscape overnight. A similar trend is developing in most European countries as many people react much against their liberal roots by becoming stringently anti-migrant. Will even socialist countries like Sweden and Denmark and others now march off to the extreme right in a replay of Germany in the late 1920? In the political sense, if not the economic one too. That would make 2016 a landmark year.
The strong dollar is a major bogeyman called upon by economists of all colours to warn of problems in emergent economies; while as many see it as a cause of major concern for the developed sectors of the globe. Yet it seems stuck in a sideways rut with no clear direction, up or down. Is the role the dollar is playing merely a public face for deeper seated concerns around Syria, the Ukraine, the South China sea or the lack of economic growth almost everywhere as spokesmen avoid mentioning a group of 800 pound gorillas cavorting around the sitting room?
How long before the heavyweight gorilla in the shape of out of control migration – and migrants! – repeat the recent Greek tragedy one by one across the map of the rest of Europe? This time with no leverage from European power centre to exercise control over run-away events, because the new trends are political, not economic. The first half of 2016 sees a number of elections in European countries, as well as a few referendums. September is a big one, with local elections in two German states and a new parliament to be elected in another possible flash point, the Netherlands.
Early signs that political upheaval is murmuring in the wings could suddenly change the nature of the play centre stage as power blocks try to adjust their stance to the migrant problem. Ongoing efforts by the authorities to try and control this problem while also countering the reaction of their citizens could be making new headlines. The markets will not like what is happening.
Euro-Dollar Chart
2016 is still without a euro surprise, the currency churning sideways against the US dollar despite oft-repeated warnings of Eropean weakness and problems. The trend remains within its new bull channel KL, (K: $1.1347, L: $1.07123) without testing the sides. There was a another dip lower late last week, in reaction to a ‘resurgent price of crude’, barely making it back above $30 as cold weather swamps the US eastern seaboard.
With ample room still to continue sideways and with an end to US winter cold in the near future, fresh oil from Iran could begin a chain reaction that has the euro back in a rising trend. First support is still at line D ($1.0698), while resistance is at line Q ($1.1145). Technically, the euro bull is quietly growing horns; however, with the major new political and economic trends and old flash points still simmering, that is about all that can be said in this regard.
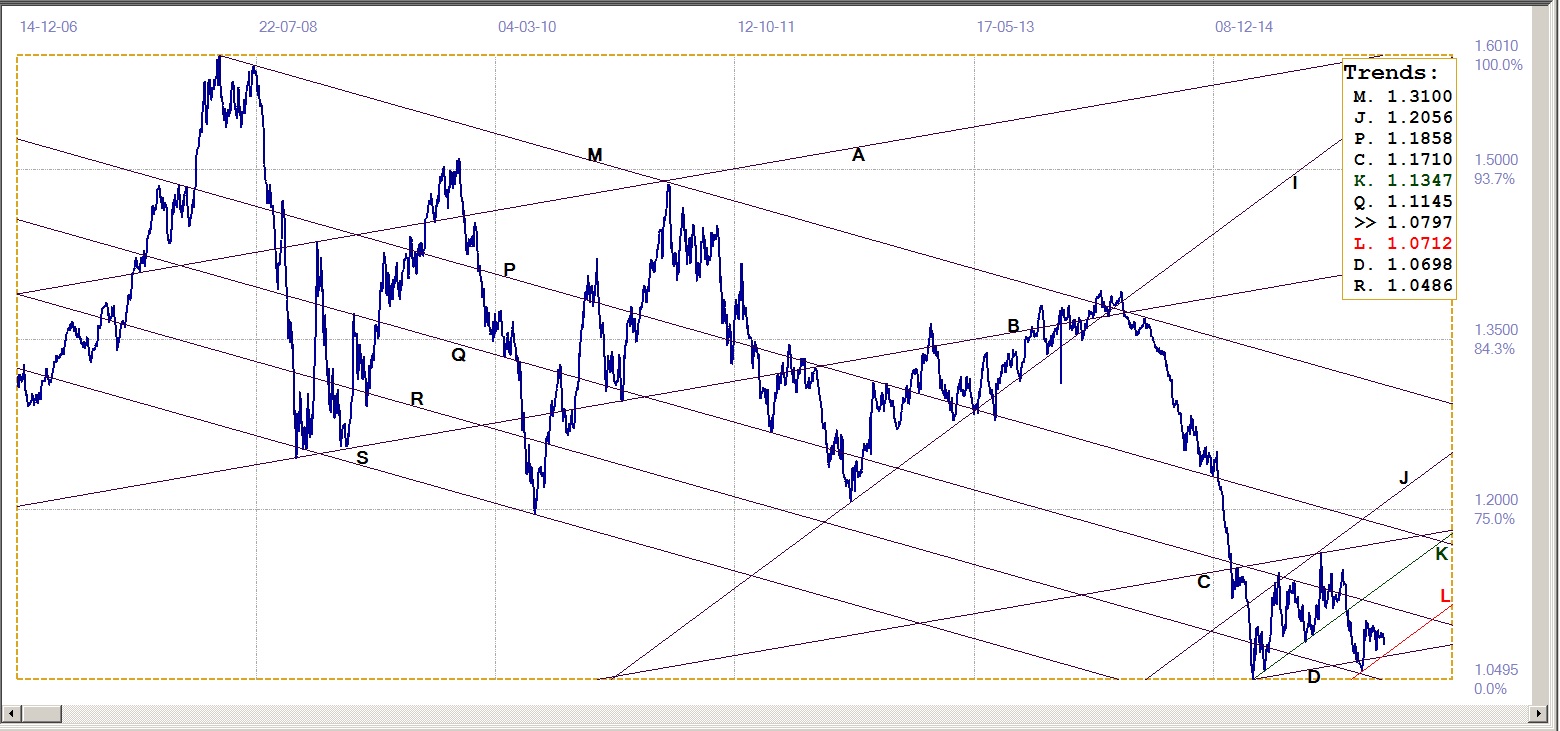
Euro-dollar, last = $1.0797 (www.investing.com)
Dow Jones Industrial Average (DJIA)
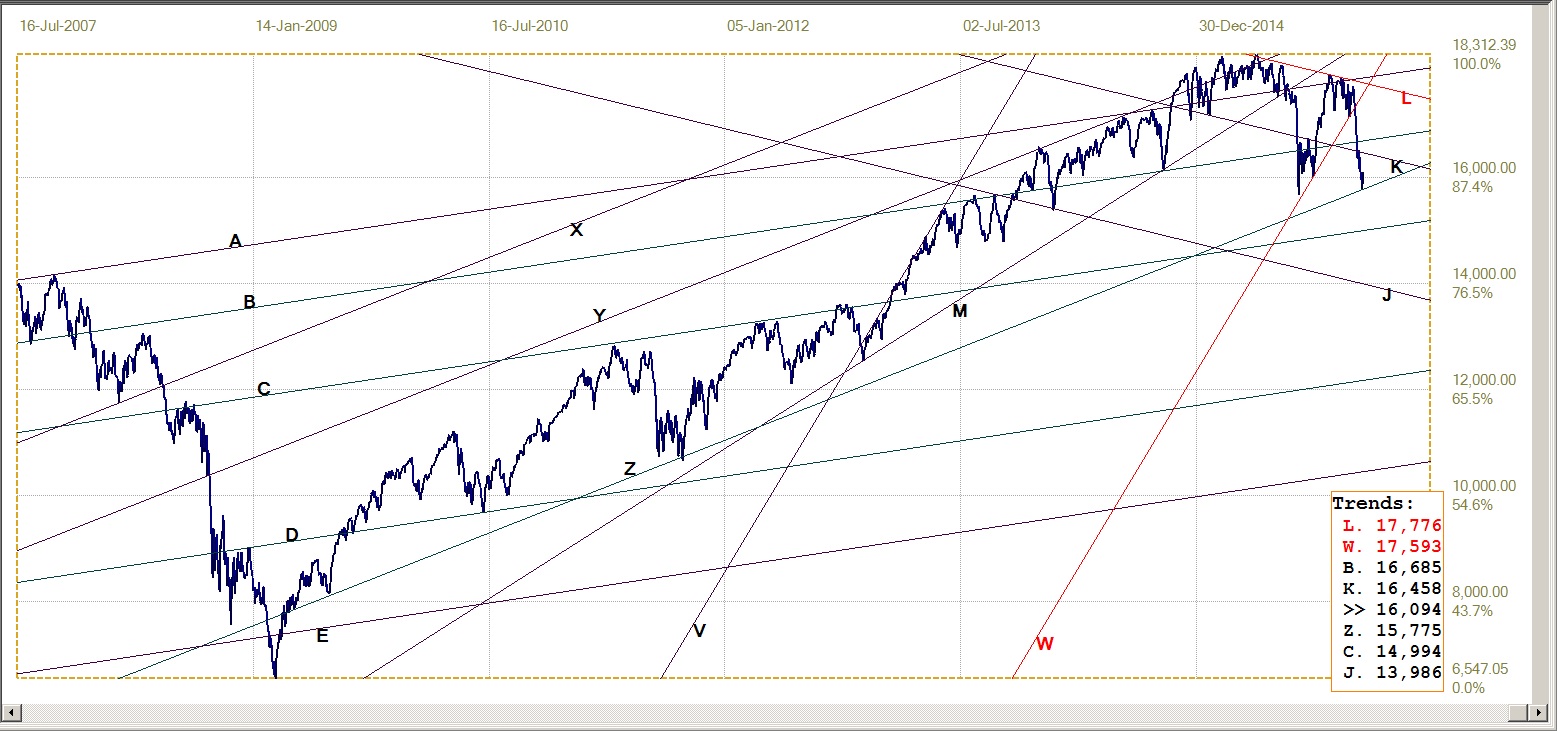
Dow Jones Industrial Index, last = 16094 (money.cnn.com)
The 10% decline in the DJIA since the close of 2015 found support at the bottom of main bull channel XYZ (15775) on Thursday, triggering a nice rally on Friday to end the week on a positive note. But the reported reason for this reversal – the price of crude recovering above $30 because of the cold spell in the US, to trigger a spike in local demand – is not going to last through 2016!
It would appear they key to what will happen lies in the support at line Z; as long as channel YZ holds, the outlook remains bullish, even if the support is repeatedly tested. A clean break below line Z signals a resumption of the bear trend.
Gold PM fix - Dollars
The initial recovery early in 2016 when gold extended the break above resistance at line Z ($1044), is creeping higher along the steep support of line L ($1105), just failing to hold. Channel JKL has been adjusted a number of times in recent reports as the ratio plays around important values. Moving line L further to the right, keeps the ratio at 398:602, close to the often seen 400:600 ratio, but with more potential to move towards the right before reaching the exact ratio.
It is still considered that support along line L could play a significant role in how the gold price develops for the next few weeks. Whether that supposition will hold true remains to be seen. At least the price is still frequently testing the $1100 barrier.
Gold price – London PM fix, last = $1096.25 (www.kitco.com)
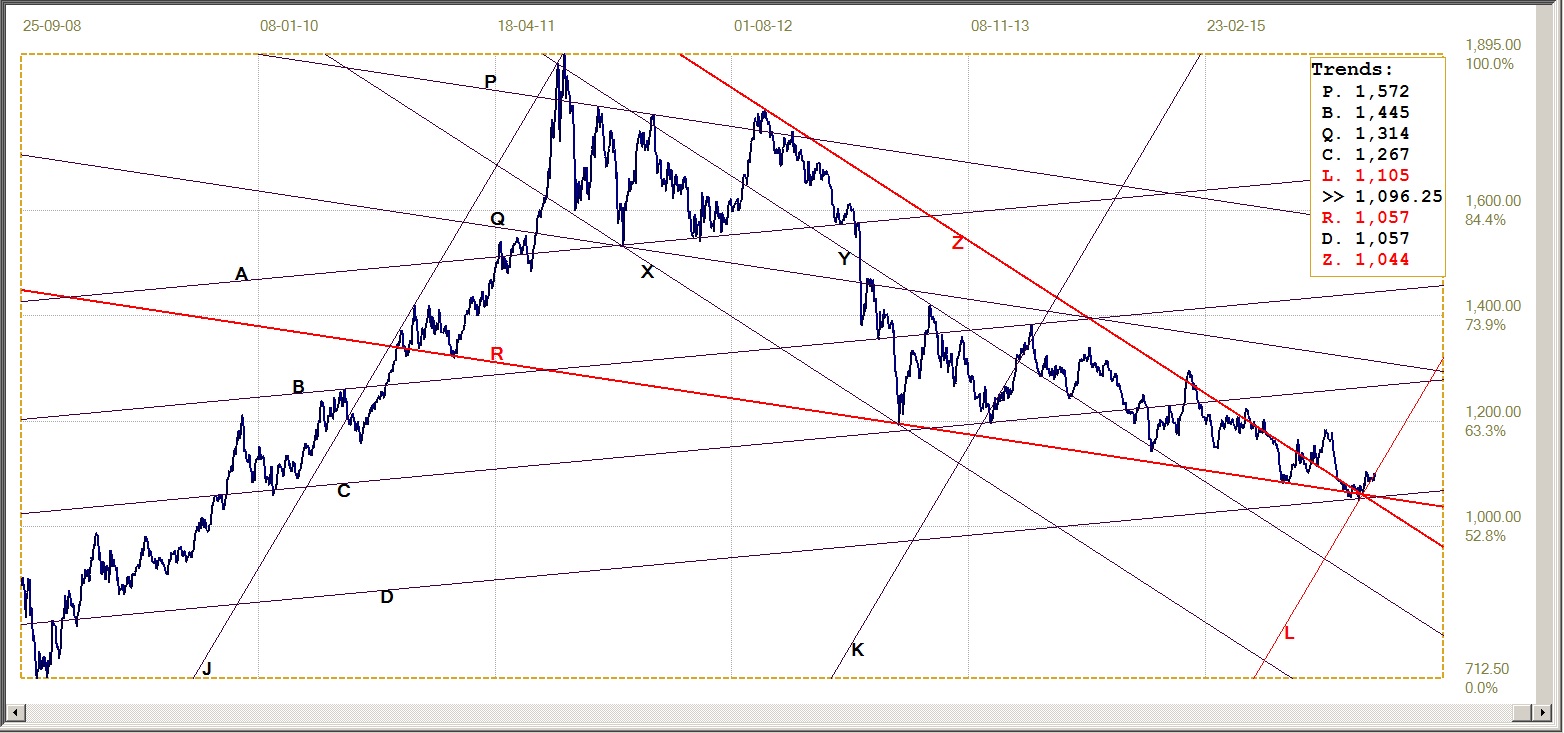
Gold PM fix - Euro
Euro gold price – PM fix in Euro, last = €1013.5 (www.kitco.com)
The recovery this year after the break below the long term triangle AS (€1006) and briefly below support at line Y (€979) has now broken back to just above line S, as gold is holding level while the euro felt the strength of the dollar. Or could it be the euro is showing the effect of growing political turmoil across Europe in the wake of the migrant wave?
The tecnical outlook for gold remains positive at least while the metal outperforms the European currency relative to the US dollar. But the precious metals remain on shaky ground while they suffer from frequent intra-day waterfall attacks that seem to attract no offical attention – which of course is no surprise.
Silver Daily Fix Chart

Silver daily fix, last = $14.17 (www.kitco.com)
Here is another example of a channel that was adjusted to accommodate the recent change in the price. The ratio of channel JKL changed from 496:504 to 498:502, a little closer to the common 500:500 ratio of a channel that is evenly divided, with the potential for line L to shift even more to the right.
If the channel were to hold in place soon – and a similar channel on the gold chart – this should imply that the prices of these two metals are getting close to where a new and probably sustained bull trend can be anticipated. The channels are steep, and while the new trends need not be explosive, they will bring much happiness.
U.S. 10-year Treasury Note

U.S. 10-year Treasury note, last = 2.057% (www.investing.com)
The yield surprised with a break below triangle NF (2.101%). Does this imply that the foreigners – China et al – are not selling in quantity, as often reported; or does it mean that the Fed is waiting with pockets full of US dollars to buy everything that hits the market? Whichever, the yield smacked lower to break just marginally below support at line Z (2.00%) and immediately turned bearish again, to end right at the market support of channel KL (2.057% for Monday, 25th Jan.)
The rally in the 10-year Treasury at the same time the US dollar index held firm to its rising trend is also interesting; more often these two markets move in opposite directions, as if intended to steady the price of the Treasury in foreign currencies – not offering enticement to take profits, nor scaring investors into selling. This week should be interesting as the yield reacts to the presence of this market support.
West Texas Intermediate crude. Daily close
The bear market continued, with the price of oil falling well below $30/bbl early last week to frighten investors on Wall Street and triggering a flight to safety in 10-year and other Treasuries. Then, when the price of WTI crude rebounded in reaction to an anticipated spike in local demand as cold weather flooded the eastern US, the price shot back above $30 to reach $32/bbl on Friday. The price of Brent reacted in knee-jerk fasion to the gyrations in the WTI price and this had similar effects to the Wall Street reaction on the global stock markets.
The question now is whether the ability of Iran to add its production to the global oil supply will (eventually?) outweigh the spike in US demand? Logic says that the jump in the price is largely a local and temporary event and that within a few days or at most weeks, the shortfall in demand, symptom of a declining global economy, should see the price of crude slipping lower again.

WTI crude – Daily close, last = $32.19 (Investing.com)
©2016 daan joubert, Rights Reserved
chartsym (at) gmail(dot)com


