U.S. Gold Exports Jump 70% In September
 share
share
 share
share
 share
share
 share
share
 share
share
According to the USGS most recent data, total U.S. gold exports increased significantly in September. Not only did U.S. gold exports surge in September, they were 70% higher than the previous month. This was probably due to increased demand as the price of gold declined $80 during the month.
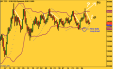
U.S. exports started off very strong in January, reaching 80 mt (metric tons) with the majority heading to Hong Kong. However, gold exports fell to 47 metric in February and dropped even further in March at 30 mt. If we look at the chart below, U.S. gold exports continue to remain weak from April to August until the spike up in September:

As we can see, total gold exports for each month were less than 30 mt. However, when the price of gold fell to a new low, gold exports increased to 50 mt. The majority of gold exports in September were shipped to Switzerland, the U.K. and Hong Kong:
China also received a direct shipment of 3.3 mt of gold while Thailand imported 3 mt, Italy 2.6 mt, Singapore 2 mt, and the UAE 1.5 mt. What is interesting here is the 2.6 mt of U.S. gold exported to Italy. Italy has imported gold scrap from the U.S., but not much in the way of gold bullion.
Matter-a-fact, I went back and looked at the past ten years of USGS Gold Yearbooks and only found one entry listing U.S. gold bullion exports to Italy in 2009 at a paltry 21 kilograms, which is 653 troy ounces. Compare that to the 2.6 mt or 83,590 troy ounces of gold exported to Italy in September.
U.S. gold exports for the first nine months of 2014 are down compared to the same period last year. From Q1-Q3 2013, total U.S. gold exports were 573 mt compared to the 370 mt in the first three quarters of 2014. However, the price of gold fell to a new low in November, thus gold exports from the U.S. may continue to be strong for the remainder of the year.
The Delay In Releasing THE U.S. GOLD MARKET REPORT
I mentioned over a month ago that I had planned to publish my first paid report, THE U.S. GOLD MARKET REPORT. The report has 25 charts-graphs and is 38 pages long. I had my web designer working on setting up the new PAID REPORTS PAGE and just when I it was about to go live with it, I found a glaring error in one of the major aspects of the report.
Initially, I thought the U.S. suffered a large cumulative gold deficit between 1981-2013. I came up with a large deficit using figures provided by the USGS Gold Year books. The USGS receives its data from the U.S. Census Bureau.
The USGS publishes annual gold import-export data and during some years, exports were very large. Coincidentally, years showing large exports also listed significant net withdrawals of gold out of the NY Fed. I assumed part of the gold exported from the U.S. included gold withdrawn from the NY Fed.
I called up Micheal George, the USGS gold specialist and asked him if foreign held gold withdrawn out of the NY Fed was included in the total U.S. gold exports. He told me that any foreign held monetary gold withdrawn from the NY Fed was not included in the U.S. gold export data.
So with that understanding, I continued with the report. However, when I was about to publish the report, something just didn’t seem right, so I spent some time researching the details on the foreign held gold at the NY Fed. I went back to some older USGS Gold Year books in the 1970’s and found out that the USGS actually provided a breakdown in commercial and monetary gold exports.
Unfortunately, the USGS no longer provides a separate accounting of monetary gold exports.. so its very difficult to know how much of the annual net withdrawals of foreign held gold at the NY Fed are exported or sold into the market. And.. its even more difficult and convoluted than that… I will get into this into more detail in the revised report.
So, some of the 4,000+ metric tons of foreign held gold at the NY Fed withdrawn between 1981-2013 were indeed included in the total U.S. gold exports. So, now I have decided to totally revamp THE U.S. GOLD MARKET REPORT including data going back until 1971.
I have to say, the more I research these older USGS Gold Yearbooks, the more fascinating data I uncover. For example, in 1974, the U.S. exported 3.3 million ounces of monetary gold. Of this amount, 2.58 million oz of monetary gold were shipped to Saudi Arabia. This is quite interesting due to the fact that the U.S. Arab Oil Embargo started in 1973.
Furthermore, it’s truly amazing how much gold the U.S. exported since 1971… and this doesn’t even include foreign gold held at the NY Fed. It will take some time to go through all this data, but I believe it will provide the precious metal investor a very interesting report on the dynamics on one of the largest gold markets in the world.
Please check back for new articles and updates at the SRSrocco Report. You can also follow us at Twitter below:
share
share
share
share
share

Independent researcher Steve St. Angelo (SRSrocco) started to invest in precious metals in 2002. Later on in 2008, he began researching areas of the gold and silver market that, curiously, the majority of the precious metal analyst community have left unexplored. These areas include how energy and the falling EROI – Energy Returned On Invested – stand to impact the mining industry, precious metals, paper assets, and the overall economy. He has written scholarly articles in some of the top precious metals and financial websites. Visit his website SRSrocco Report.
More from Gold-Eagle