Gold Sensing Seasonal Sluggishness
 share
share
 share
share
 share
share
 share
share
 share
share
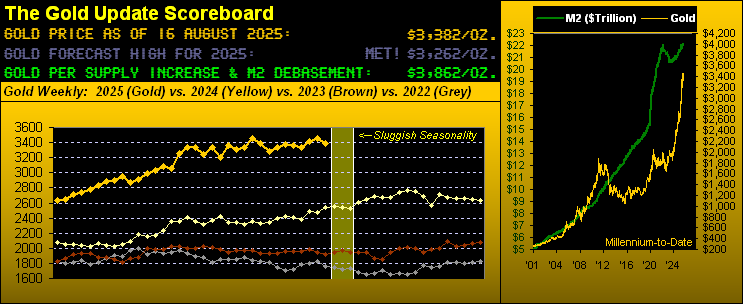
When we blow it, we’re obliged to show it. For after last week’s scintillating song and dance about a “Double Shot of that Golden Love”, Gold this past week succumbed as a fallen dove, now further facing a stint of “sluggish seasonality” per the shaded strip in the above graphic encompassing these last four years.
“Well, don’t beat up on yourself too much, mmb, as you did leave the door open for a down week…”
And “down” indeed was this past week’s direction, Squire, Gold settling yesterday (Friday) at 3382, price sporting just its 11th lower week of the 33 year-to-date, and therein the fifth worst of those 11 downers by both percentage (-2.2%) and points (-77). But to Squire’s observance, let’s update our cautionary graphic from a week ago of John Bollinger’s Bands on Gold by the day since April. This is the original graphic then presented, onto which we’ve added the past week’s five trading days:
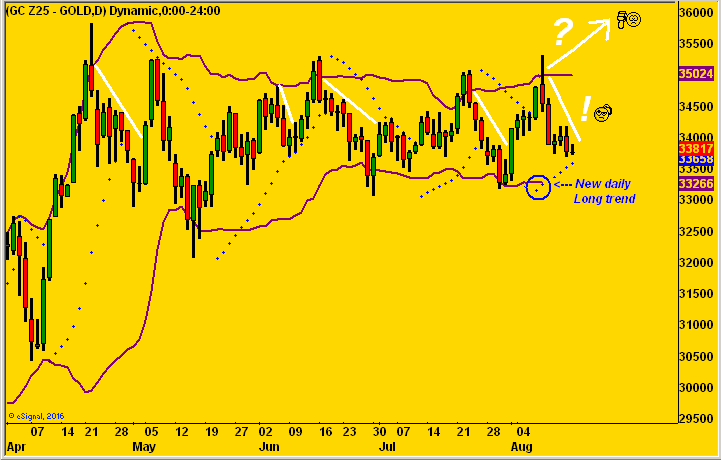
You’ll recall a week ago our opining that — despite Gold having pierced the upper band — that this time price would break even more to the upside (the “?”) rather than decline (the “!”) as otherwise has been its wont as you can see per the prior “white lines” following such upside piercings. So technically the upper band as a barrier again prevailed, as did fundamentally the 180° reversal on the initial Swiss Gold “Trump Tariff!” price spike. Note too in the graphic that Gold’s recently new daily parabolic Long trend (the rightmost blue dots below price) appears to be nearing its end.
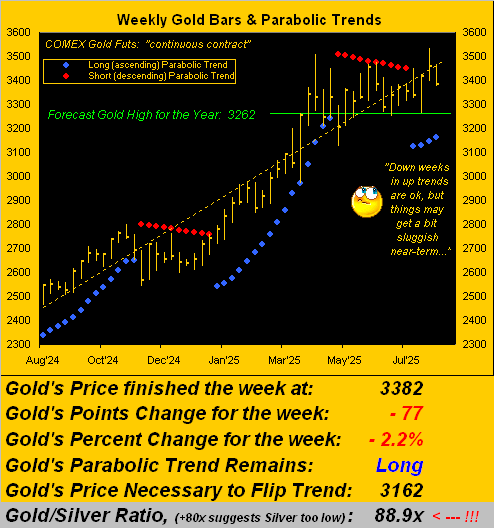
Fortunately as we turn to Gold’s bars from a year ago-to-date, the blue-dotted weekly parabolic Long trend is still easily in force, price today at 3382 substantially above the “flip-to-Short” level for the coming week of 3162, albeit as entitled, “sluggish seasonality” may be ensuing:
Indeed as highlighted by the shaded band in our opening Gold Scoreboard, we are entering what through the years has been a period of “sluggish seasonality” for Gold: century-to-date, the median net change for Gold across these next three calendar weeks has been 2% either way. ‘Tis that time of year when the so-called “Dog Days of August” remind us from mid-month onward that vacations still linger ahead of the markets’ September hand-wringer. For even as the “Casino 500” (its “live” price/earnings ratio now 46.3x) ascends ever further up into the Stoopid Zone, the amount of money requisite today to move the mighty S&P one point is but 50% of that just two months ago on 16 June.
‘Course, that won’t be on CNBS, but we are very wary of just how thin (emboldened) markets have become, which adds of course to the case for a massive “correction” (mildly put) come the fall (double entendre). Query: do you know where your equities’ stops are?
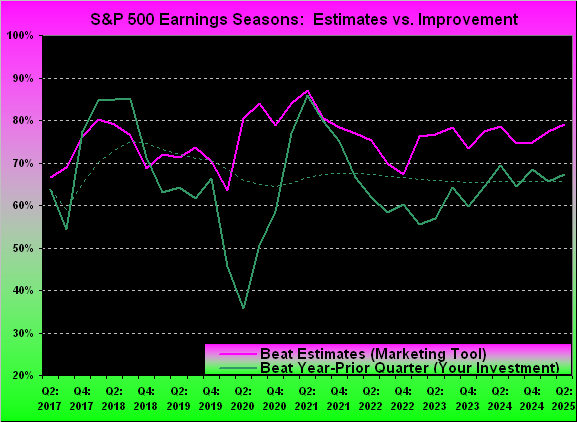
“But Q2 Earnings Season just finished and it was pretty good, eh mmb?”
Squire, ’twas fairly ok. As usual, the FinMedia fawned all over the beating of estimates (marketing tool) rather than comparatively assessing results vis-à-vis the prior year’s like quarter (your investment).
Specific to the S&P 500, 79% of the 435 reporting constituents exceeded analysts’ estimates, the largest percentage since Q2 of 2024. As to the far more important reality of companies actually having made more money for shareholders, such ignored stat of 67% so did: that’s one pip above the 66% average for such year-over-year quarterly improvement across the past nine years. Here’s our chart by the quarter since 2017 for the percentage of reports beating estimates versus actually improving, (the dashed green line being the evolving average thereto):
And thus speaking of stocks, let’s straightaway segue to the Economic Barometer along with the S&P 500 (red line) from a year ago-to-date. The S&P seemingly is making new highs by the day (regardless of constituents’ earnings support, and often the lack thereof), whilst the Econ Baro after its recent up binge is suddenly suffering a bit of a twinge. The Baro took in 15 metrics this past week … of which only five bettered their prior period. Thus from the “Math Dept.” it stands to reason that rising stock prices + frail metric improvements = higher price/earnings ratios (meaning for those of you scoring at home that ’tis difficult for economically-challenged earnings to keep pace with higher stock prices). ‘Course in this Investing Age of Stoopid, nobody cares (yet). Have a nice day:
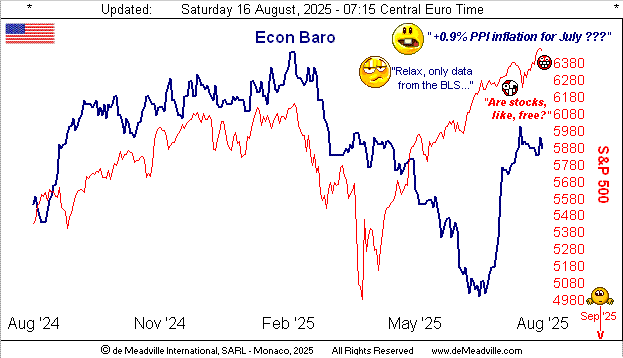
Moreover, therein came came the “Whopper of the Week“: per the above graphic, wholesale inflation for July as measured by the Bureau of Labor Statistics’ Producer Price Index roared in at +0.9% for both the headline and core readings, in turning bringing the headline 12-month summation to +2.9%, that for the core to +3.3%, and both annualized strictly by July to (deep breath…) +10.8%! As penned Friday in the website’s Prescient commentary: “…July’s very inflationary PPI ought make it clear for no rate cut perhaps through the balance of this year…” (Sorry Michelle).
Yet notwithstanding the BLS arguably losing data credibility, the Federal Reserve leans more toward the Bureau of Economic Statistics for its Personal Consumption Expenditures inflation read: ’tis due 29 August. Then the next Open Market Committee Policy Statement comes 17 September, even after the BLS inflation data for August. But if the data again is hot, do they … (don’t say it) … raise? ‘Twould be marvy timing to match with a September S&P crash. On verra… Reprise: do you know where your equities’ stops are?
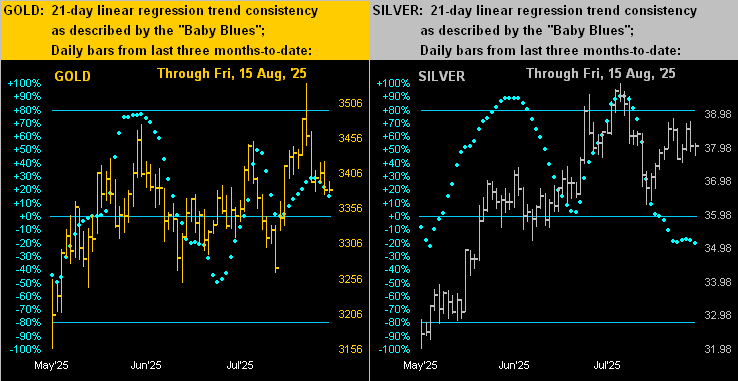
We know where our “Baby Blues” are for the precious metals: they’re out of puff. To our two-panel graphic of the daily bars from three months ago-to-date on the left for Gold and on the right for Silver. The baby blue dots reflect regression trend consistency, for which neither metal presently is positive, nor are the respective structures of their rightmost bars:
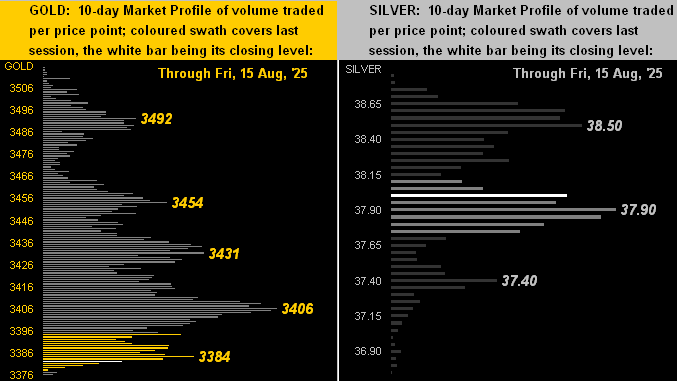
Then too we’ve the 10-day Market Profiles for the yellow metal (below left) and white metal (below right). Although the price of Gold obviously is down in the dumper, Silver sees mid-Profile support at the depicted 37.90 level. But to avoid a Silver slip, Gold need get a grip:
To wrap, we’ve already reviewed inflation’s “Whopper of the Week“. Let us thus close with our favourite “Headline of the Week“, courtesy of Bloomy just last evening. Ready?
- “Wall Street Wrestles With Hedging Conundrum as Valuations Swell”.
Cue a pet quip of ours: “They’re just figuring this out now?” ‘Tis to laugh, but let’s try to help those floundering in Manhattan’s financial canyons. The S&P 500 settled yesterday at a near-record high 6450 with the aforementioned p/e ratio of 46.3x and paltry yield of 1.201%. What that means for you WestPalmBeachers down there is in purchasing the S&P right now, you are paying $46.30 for something that earns $1, (plus some dividend change for your usage of gas station toilets), along with the thrill of your $46.30 being halved upon the next -50% market “correction”; (recall we’ve already had two such “corrections” thus far this century). Instead, one can opt for the U.S. Treasury’s 3-month Bill currently yielding an annualized 4.112% and return of the Bill’s face value. So what’s the conundrum, eh?
“Well, you’d have to trust the U.S. Treasury’s solvency, mmb…”
Good point, Squire. So alternatively…
Got yours?
Cheers!
…m…
www.TheGoldUpdate.com
www.deMeadville.com
and now on “X”: @deMeadvillePro
********
share
share
share
share
share

Mark Mead Baillie has had an extensive business career beginning in banking and financial services for two years with Banque Nationale de Paris to corporate research for three years at Barclays Bank and then for six years as an analyst and corporate lender with Société Générale.
For the last 22 years he has expanded his financial expertise by creating his own financial services company, de Meadville International, which comprehensively follows his BEGOS complex of markets (Bond/Euro/Gold/Oil/S&P) and the trading of the futures therein. He is recognized within the financial community of demonstrating creative technical skills that surpass industry standards toward making highly informed market assessments and his work is featured in Merrill Lynch Wealth Management client presentations. He has adapted such skills into becoming the popular author each week of the prolific “The Gold Update” and is known in the financial website community as “mmb” and “deMeadville”.
Mr. Baillie holds a BS in Business from the University of Southern California and an MBA in Finance from Golden Gate University.


