Gold Forecast: Gold & U.S. Stock Cycles (Update)


 As mentioned in my last article back in late-December, Gold was setting up for a key short- term correction, coming from several smaller tracked waves - though a move anticipated to end up as countertrend, before turning higher again into February. This February, 2026 window is of key focus for this particular market, though with a focus on this Spring for U.S. stocks.
First, a look at the Gold market.
Gold's 10-Day Cycle
For the very short-term, our smallest-tracked wave in the Gold market is the 10-day cycle, which is shown on the chart below:
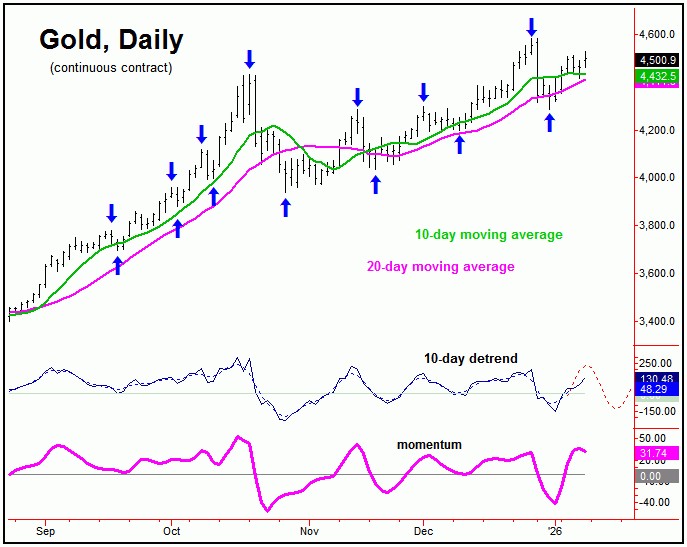
The last upward phase of this 10-day cycle in Gold saw prices spiking all the way up to a high of 4584.00 (February, 2026 contract), made back on 12/26/25 - just a few days after my last article for Gold-Eagle.
From my 12/22/26 article: "this 10-day wave is now some 9 trading days along - and with that is into extended topping range. In terms of price, any reversal below the 4334.70 figure (February, 2026 contract) would infer this cycle to have turned south, a number which is expected to rise soon, with the latest reversal number always posted in our Gold Wave Trader report."
As mentioned above, the last upward phase of our 10-day wave was very extended into late-December, and was due for a sharp correction. Just following that article, our downside 'reversal point' for this wave had moved up to the 4469.90 figure (February, 2026 contract), and was noted our Gold Wave Trader report. This number was taken out to the downside on 12/29/25 - thus triggering the last short-term decline.
In terms of price, from this downside reversal point of 4469.90, Gold proceeded to drop another 185 points, into the most recent low for this 10-day wave, which was later confirmed to be the 12/31/25 trough of 4284.30 - and was also noted in our Gold Wave Trader report. From there, Gold has seen a sharp rally into last week, with the metal running up to a Friday high of 4527.00.
In terms of time, the current upward phase of this 10-day wave is now 6 trading days along, and with that is back into topping range. Having said that, It is too early to confirm a new downside 'reversal point' for this wave, though one should ideally materialize in the next trading day or two, depending on the action.
Gold's (Dominant) 34-Day Cycle
From my 12/20/25 article: "the upward phase of this 34-day cycle has been in force in past weeks, and is also into extended range for a peak. The next decent correction should come from this particular cycle, and does have the potential to peak with the current upward phase of the smaller 10-day component. The next correction phase of this 34-day cycle should see a minimum drop back to the 34-day moving average."
Back in late-December, our 34-day cycle was also in topping range, and with that was on the lookout for a sharp correction - with Gold being so extended from its 34-day moving average. Here again is that 34-day wave:
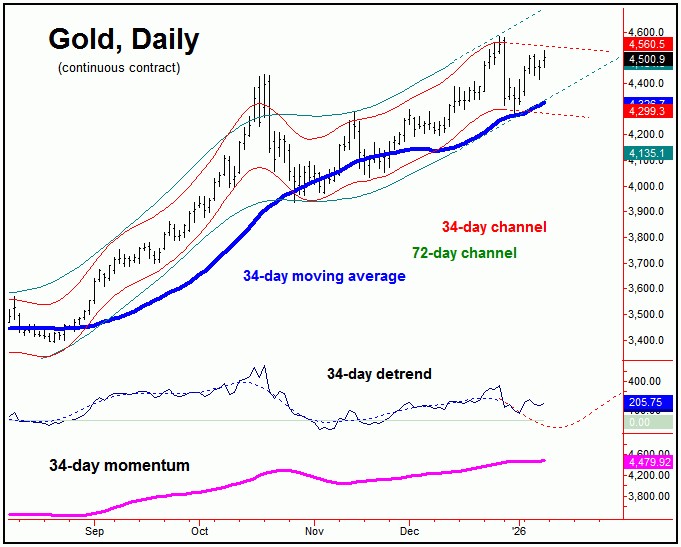
Following my rule that a cycle will normally revert back to a moving average of the same length, Gold saw a late-December peak giving way to a near 'crash-like' drop in the days that followed, a decline which took prices near the 34-day moving average (within a few points), which was also at or near the lower - and rising - 72-day cycle channel.
In terms of patterns, the correction of this 34-day wave was anticipated to end up as countertrend, with support noted at the aforementioned lower 72-day channel. With that, a countertrend correction with this 34-day cycle has been favored to give way to a push back to higher highs into February (potential 4700), before setting up a slightly more significant peak, coming from our bigger 72-day wave.
U.S. Stocks Moving into Mid-Term Topping Window
From the comments made in past articles, the last mid-term low in U.S. stocks came from our 360-day time cycle, which bottomed in early-April of last year.
Here again is this 360-day cycle on the S&P 500 index (i.e., SPX):
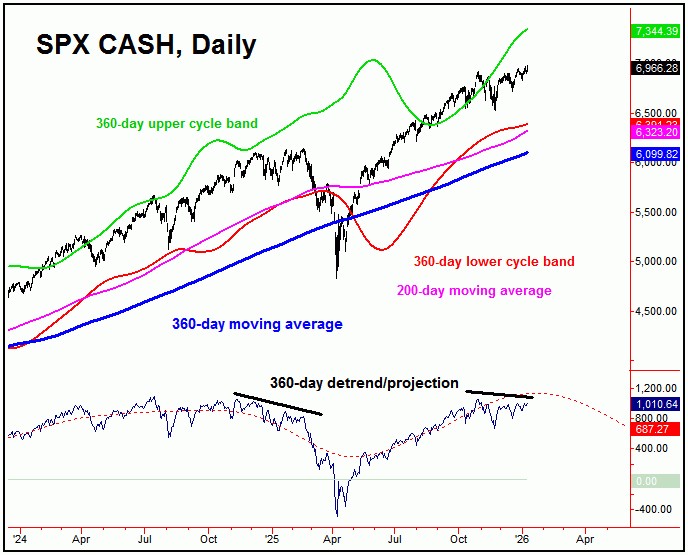
As mentioned in past articles, this 360-day wave on the SPX was seen as pushing higher into the Spring of this year, where the next larger-degree peak is projected to form. In terms of price, there is the potential for a push up to the 7300-7500 SPX CASH region into that window - which would also be a key resistance level.
As noted in past articles, several short-term corrections were expected to play out in U.S. stocks, which we saw from late-Summer into mid-Autumn of last year. Having said that, each of those declines were expected to end up as countertrend, due to the position of our larger 360-day cycle.
As noted, there is a focus now on early-Spring of this year, to eventually top this 360-day cycle. Of particular note is that - with the new high in price - the detrend that tracks this wave is now showing a divergence. With this detrend now diverging from the new price high, we are in a countdown to the next mid-term price top - though the ideal path favors this peak to form later this Spring.
For the bigger picture, from whatever top that does form with our 360-day cycle, the probabilities should favor a sharp decline of some 17-30% in the following months, ideally setting up the next major low for U.S. stocks later in the year. From there, what follows should be an even-larger percentage rally of some 40-50% or more, playing out into the late-2027 to Spring of 2028 timeframe. Stay tuned.
Jim Curry
The Gold Wave Trader
Market Turns Advisory
http://goldwavetrader.com/
http://cyclewave.homestead.com/
*******
More from Gold-Eagle


