Why NED Davis is Dead Wrong About $660 Gold


John LaForge, commodities strategist at Ned Davis Research says gold is going to $660 an ounce.
In an appearance on CNBC on Thursday, LaForge said that the end of the current “supercycle” for gold could push the precious metal down to $660 an ounce, or about 40% lower than where it is currently trading.
LaForge said that in the 1980s, the price of gold fell about 65% from peak-to-trough as the precious metal endured a 20-year bear market. And after hitting $1900 an ounce in 2011, gold should see a similar peak-to-trough decline in the current cycle.
“We know that commodities run in supercycles, and they eventually die. And gold looks like it’s dying,” LaForge said.
“So $660 is certainly in the cards.”
Of course, Mr. LaForge is just looking to get attention for NED Research by making such wild forecasts. His motives are murky and his prediction is flawed for a number of reasons.
While I agree that understanding cycles is key to price forecasting and successful investing, I am not sure that John understands the current gold super cycle or has taken into consideration the distortions caused by central bank stimulus and market intervention. Everything is indeed cycles and waves, including our natural environment, political system, etc. But understanding these cycles is the challenging part.
Mr. LaForge and NED Research are assuming that gold has finished its super cycle and already peaked. The correction over the past few years has certainly been brutal, but let’s see if you agree with his thesis that the gold market has peaked and is heading for $660.
In the following points, I will argue the reasons why the gold market has not yet peaked. Instead, we are in a counter-trend correction within the long-term bull market.
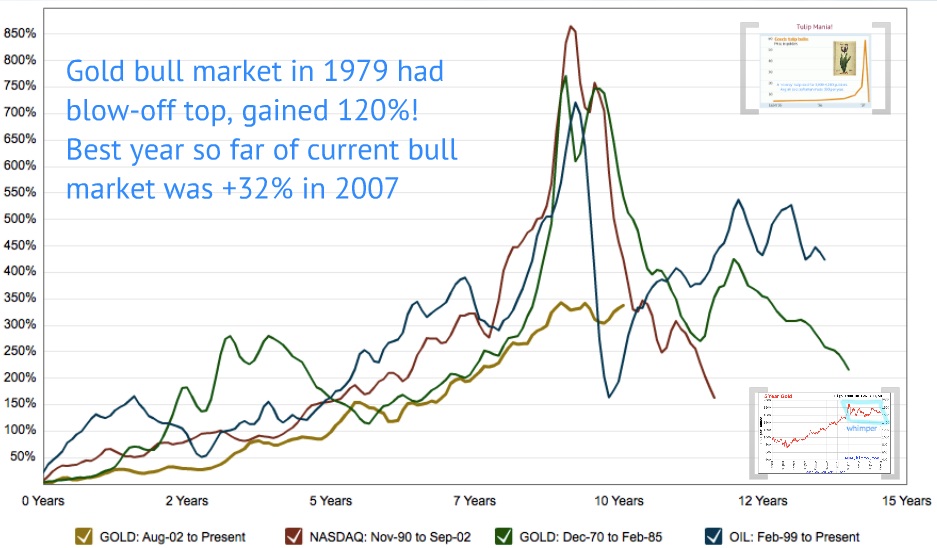
1) Gold Gained Over 2,000% During the 1970’s – The current gold bull market has advanced only around 500-600% during the current bull market ($300 to $1900 gold). Bull market cycles in general tend to generate gains well in excess of 500% before they are over, as shown in the chart below. This suggests that gold has not yet completed its bull market cycle. We are more likely in a severe correction within a long-term bull market than at the end of the bull market.

2) Gold Has Not Come Close to the Inflation-Adjusted High from 1980 – That would put gold around $2,400 according to official inflation statistics or $8,890 according to the inflation statistics used by John Williams of ShadowStats.com. Either way, one would expect the current cycle to climb somewhere well above $2,400 before claiming that a top has occurred. Certainly, all of the conditions that caused the 1980 spike are much more severe today.

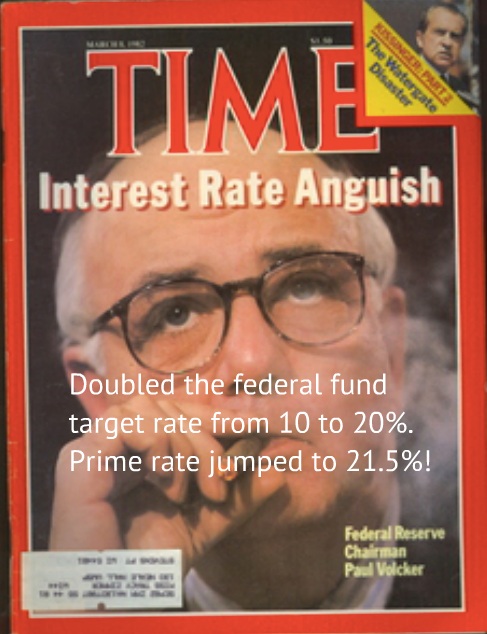
3) Paul Volcker Doubled the Fed Funds Target Rate from 10% to 20% in 1980 – He did this in order to slow inflation and hold the monetary system together. The prime rate climbed to 21.5% during this time! This move crushed the gold market and led to the sharp decline that followed. Contrast this to today when the FED has kept interest rates near zero for years and has only talked of making incremental increases in meetings and notes. Even the hint of raising rates today sends the stock market into a tailspin. Raising rates too high, too fast would also make the Federal debt unmanageable. So, while the gold market might be pricing in a rate hike in the near future, things are different from 1980 and not nearly as conducive to such drastic policy changes. Absent such a rate hike, should we really expect a repeat of the 1980 plunge in the gold price?
4) Gold Bull Markets End with a Bang, Not a Whimper – The gold price rocketed 120% higher in 1979 with what analysts call a blow-off top. By contrast, the best year of the current bull market was a 32% gain in 2007. This is not indicative of a top in the gold market.
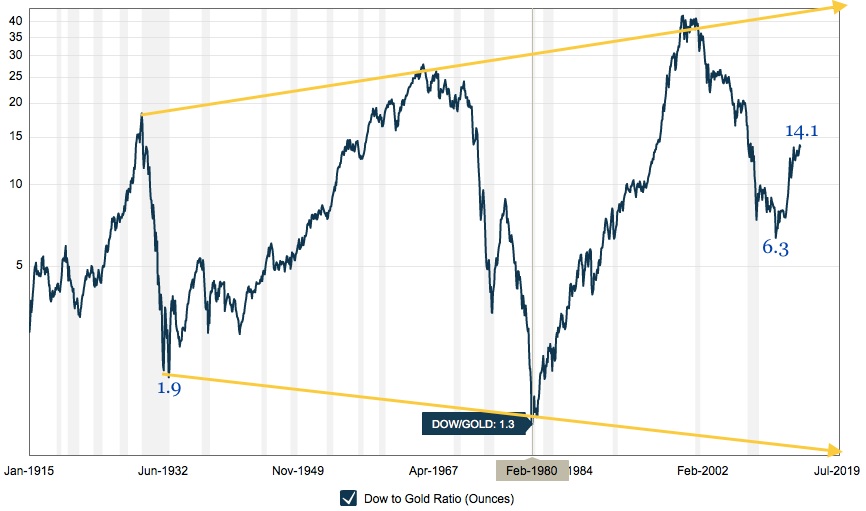
5) Dow to Gold Ratio Drops Toward Parity at End of Gold Bull Cycle – The ratio of the DJIA to the gold price typically reverts toward parity at the peak of the gold market. This is the point where gold becomes overvalued versus stocks and one ounce of gold can buy one unit of the DJIA. It dropped to 1.9 at the end of the gold bull market in 1932 and dropped to 1.3 at the end of the gold bull market in 1980. This Dow-to-Gold ratio has been trending towards higher peaks and lower troughs historically. So, one might expect it to finally drop to 1 or lower during the current bull market. At such a point, talk of the end of the gold bull market and a sharp plunge of 65% might be warranted. But this ratio has thus far only dropped to 6.3, suggesting that gold has quite a bit of appreciating to do versus stocks before it is overvalued or at the end of its bull cycle.
6) Participation in the Gold Market Remains Very Low – Bull markets tend to end with mania, where everyone and their brother is scrambling to buy gold at any price. Even in 2011 when gold was trading above $1,900, participation remained very low (estimated at under 2% of the population). People were still lining up to sell their gold and cash in, notbuy as much as possible.

* * * *
These items above are not signs of a top in a bull market. They suggest that we are in the midst of a major correction within a larger bull market cycle, not a new bear market in gold that will take the price back to $660. If anything, we should be witnessing signs of a hyper-cycle that takes the gold price and all of the indicators above well past prior bull markets. We are experiencing record levels of debt, unprecedented bailouts, QE and monetary stimulus, artificially low interest rates for years on end, unfunded liabilities in the trillions, derivatives in the hundreds of trillions and a de-dollarization environment that threatens the dollar as world reserves for the first time in decades.
Yet, gold is trading near the all-in cost of production for many miners. There is little to no profit margin, as gold is selling on the COMEX around the same price that it takes mining companies to dig it out of the ground. What other markets display this type disconnect? Can you buy a loaf of bread below the cost for the baker to make it? Can you buy oil below the cost to drill and refine it? Can you buy a home below the cost to build it or a car below the cost to manufacture it?
I will readily admit that the correction in the gold market has lasted longer than I had anticipated and brought prices lower than most gold analysts predicted. Even the anti-gold banks such as Citibank had a price target for gold of $1,655 in 2014.
Can the price of gold go lower? Yes. The price is set on paper markets, using leverage and borrowed money, with participants that have bottomless pockets and multiple ways to manipulate the price and profit from less sophisticated investors. Market manipulation has been exposed and confirmed in so many financial markets that it should not be all that hard to imagine that it occurs in the gold market as well.
Given this understanding, the price can disconnect from reality and do anything in the short term. But I am not a day trader and I am not too concerned about the short term. Prices can not persist at or below the cost of production for long. Companies close their mines, supplies drop and prices bounce back. New markets are opening that diversify price discovery and reduce the ability of big banks to manipulate prices. Opportunistic investors sense value and step in to buy at oversold levels. Free market pricing has a way of re-asserting itself, in one form or another.
Furthermore, the nature of our fractional reserve, debt-based fiat monetary system dictates that banks and their government puppets will continue to print money in order to keep their system afloat, enrich their inner circles and keep their power intact. What is not so certain is that they will continue to find eager buyers of their debt in the international markets, that China will continue to hold large amounts of dollar-denominated assets or that oil-producing nations such as Saudi Arabia will continue to demand dollars for their oil in international markets.
While nobody can predict what gold prices will do, we can be fairly certain that NED Research is tossing around outlandish price forecasts in order to get attention and drum up business. It is working in the short-term I suppose, since here I am writing about them. But one has to question the credibility of a research firm which believes that the gold price will fall 40% or 50% below the cost of production. My money says we are at or near the bottom, but only time will tell.
If you would like to receive our price forecasts, monthly newsletter and portfolio of the stocks we believe will outperform, click here to join the Gold Stock Bull Premium Membership.

Jason Hamlin is the founder of Nicoya Research and has been publishing investment research at goldstockbull.com since 2006. His background is in data analytics for the world’s largest market research firm. Jason consulted to Fortune 500 companies around the globe, including Nestlé, Johnson & Johnson and Del Monte. Jason eventually left the corporate world and leveraged his analytical skills to trade stocks successfully full-time. Jason is a contrarian, cycles investor and student of Austrian economics. He is a proponent of sound money, limited government, decentralization of power and the non-aggression principle (NAP). His website is at nicoyaresearch.com. You can reach Jason at: https://nicoyaresearch.com/contact-us/.


