Case Study : TGB


Our service is to provide entries and exits to the three sectors of metals, energy, and technology for both investors and traders, using funds and ETFs, for simple execution, low maintenance management, and most of all, diversification. However, individuals with high net worth may wish to expand their exposure to include individual stocks, and as an extended benefit to our loyal subscribers, we can provide a case study of these stocks, time permitting, in a "bottom up" approach.
What is a "bottom up" approach?
It is a simple process of beginning from a shorter term time frame, and work our way up to a longer term time frame. Most investors make a common mistake by doing the exact opposite: they plunge heavily into a stock based on their long term outlook, without considering the current technical merits, thus end up suffering a substantial drawdown, which could result in a loss and subsequently, missing a potentially lucrative investment. Lets begin…
Short term
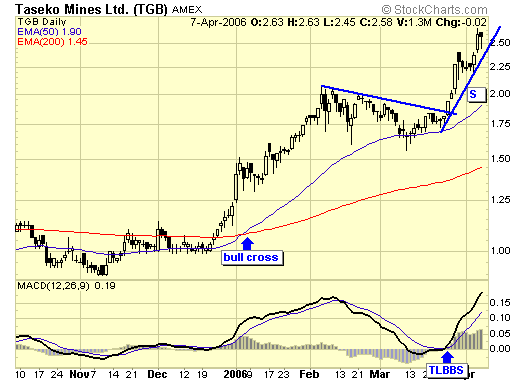
Current analysis - TGB had a bull cross in early 2006, therefore, we are back in a bull market on the daily chart, and in a bull market, we look for buy signals.
Current signal - TGB has a TLBBS on 3/27 at around $1.90, coinciding with our buy signal of 3/24 on the metals sector. Traders should stay long and only take partial profits on violation of support. (TLB of S)
Intermediate term
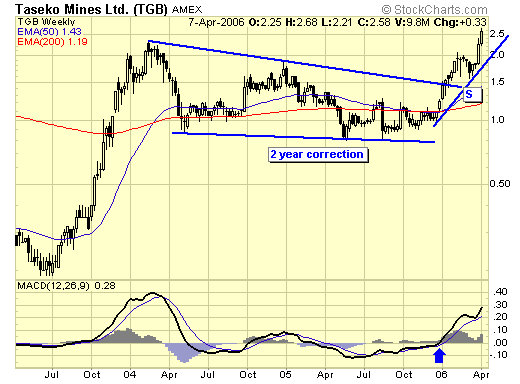
Current analysis - TGB is in a bull market, after having survived a two year correction.
Current signal - a TLBBS in early 2006, traders should stay long until a TLB of S.
Long term
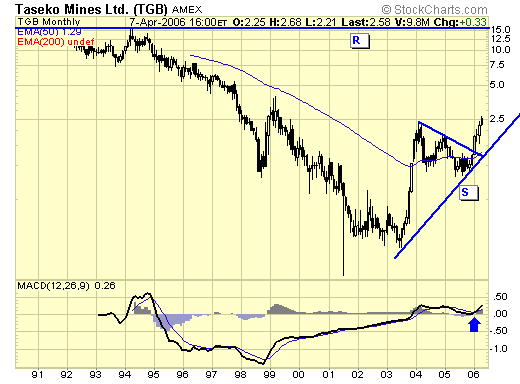
Current analysis - TGB bottomed in 2003 after a multi year bear market, long term target is major resistance at $15.
Current signal - a TLBBS in early 2006, investors stay long until a TLB of S.
Summary
Analysis from all time frames are bullish. We have buy signals in all time frames.
A core position should be held using the monthly chart for long term gains. Partial profits can be taken using the daily and weekly chart exit signals. New money can buy or add to positions using the daily chart buy signals. Symbol is TKO for Toronto. Enjoy the ride.
Disclosure: employees and staff at Traderscorporation may or may not own stocks featured in these case studies. These case studies are analysed from a technical perspective, due diligence is suggested.
Jack Chan at www.traderscorporation.com
12 April 2006

Jack Chan is the editor of Simply Profits, established in 2006. Chan bought his first mining stock, Hoko Exploration, in 1979, and has been active in the markets for the past 37 years. Technical analysis has helped him filter out the noise and focus on the when, and leave the why to the fundamental analysts. His proprietary trading models have enabled him to identify the NASDAQ top in 2000, the new gold bull market in 2001, the stock market top in 2007, and the US dollar bottom in 2011.


