Gold Market Update
A great way to make yourself popular is to tell people what they want to hear, and the trick is to make yourself scarce before the wheel comes off, or at least slip quickly into the background when it does. Thus you’ll find no shortage of articles out there telling you what a great investment gold is and the countless reasons for buying it. They are “playing to the gallery” which is normal near a market peak. However, most of the evidence that we are examining points to an imminent reversal and retreat - not a bearmarket though as the bullmarket in gold is thought to have much further to run and will probably end in a spectacular parabolic blow off with prices at dizzying heights compared to today, but this is still a long way ahead of us - over a shorter time horizon we may first have to deal with a significant correction.
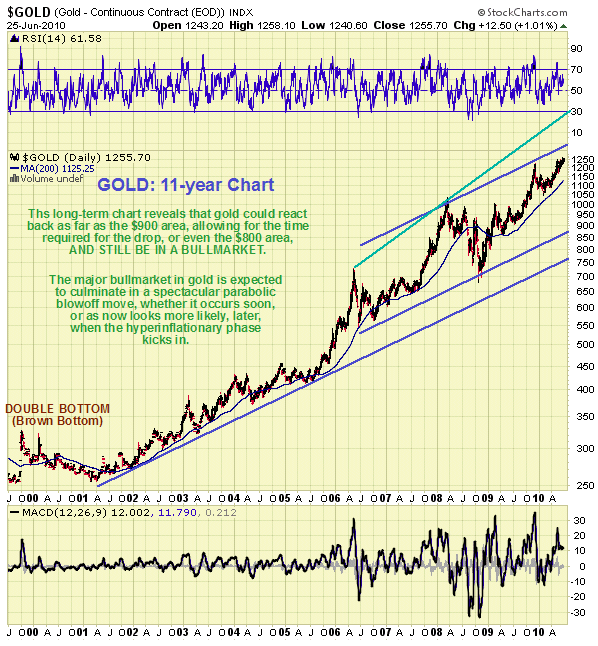
Let’s start by putting things in context by looking at gold’s long-term chart from the start of its bullmarket way back in 2001. Gold still looks robust on this chart and there is in fact no sign at all of an end to its bullmarket. However, we can also observe how it is once more approaching the top return line of a large uptrend channel. This is what stopped it in its tracks back last December and from other evidence looks like it is about to do so again. This is a most useful chart as it makes clear that gold could react back to the $900 area, or even the $800 area, with its long-term bullmarket remaining intact. Thus, if gold does react back heavily soon, we should not be thrown by it, but instead look to build positions increasingly the further it reacts back.
Now let’s look at the much shorter-term 6-month gold chart to see how things have been shaping up in the recent past. While gold’s cheerleaders have predictably been making a great song and dance about its rising to new highs over the past week or so, as we can see the gains have in fact been incremental, which is reflected in the weak momentum revealed by the flaccid MACD indicator shown at the bottom of the chart. In addition, a bearish Rising Wedge appears to have developed which portends a breakdown and potentially severe drop. While a clear break above the top line of the Wedge may negate it, a breakdown from this pattern will be a bearish development which will be viewed as a sell signal. Either way resolution of this pattern must occur soon as the price is now approaching the apex of the Wedge, by soon we mean within a week or two.
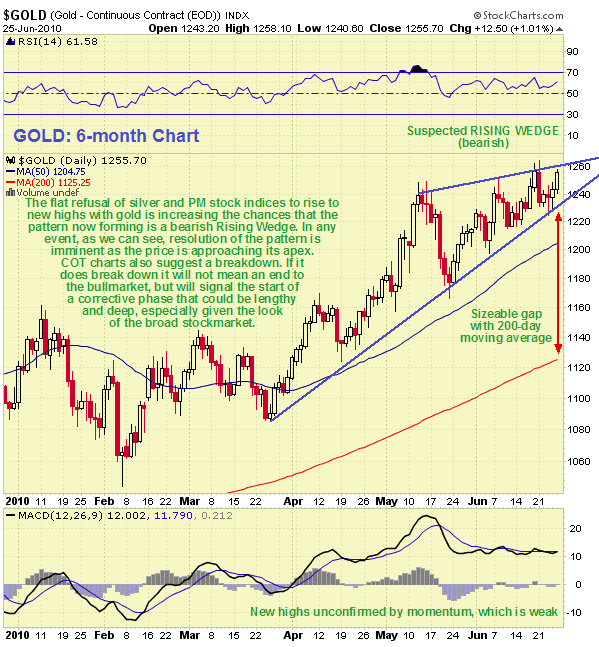
Factors giving added significance to the potential bearish Rising Wedge in gold are of course the continued non-confirmation of gold’s new highs by silver and the gold stock indices, which have stubbornly refused, at least up to now, to break out to new highs. They continue to labor under their respective walls of overhanging supply, and whilst it is clear that they have by now worked off most of it, this won’t do them any good if demand suddenly dries up and they turn tail and plunge. This non-confirmation is getting to be an old story but it continues to be a hugely important factor that we would be most unwise to lose sight off.
The silver non-confirmation may be examined in the Silver Market update, here we will look at it on the 3-year chart for the HUI index. This chart shows that while the index is now in position to break out upside, which would be expected to lead to a strong advance, it could be completing a large Double Top, and if it is it could plunge, especially if the broad market caves in, the prospect of which we will be looking at below. Fortunately, with a clearly defined uptrend in force from February of this year, investors and traders can adopt a mechanical approach, which is to get out or employ protective measures such as options should this uptrend fail. If it does things could turn ugly fast.

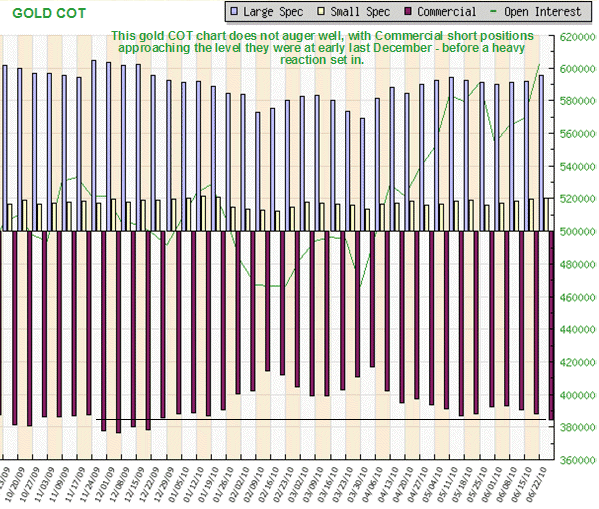
Gold’s COT chart is regarded as bearish at this point, with Commercial short positions approaching the levels they reached last December, just before gold topped out and reacted heavily.
The dollar is believed to have started the process of topping out, with the exact high being called on the site within a day of its occurrence, partly on the basis of extreme sentiment readings. However, having reacted back sharply to its rising 50-day moving average, so that short-term oscillators, which were showing an extremely overbought condition, have completely neutralized, a bounce back towards the recent highs looks likely short-term. The long-term outlook for the dollar, beyond a possible panic out of stocks and into Treasuries, is very bleak indeed, especially if the heat comes off the euro.

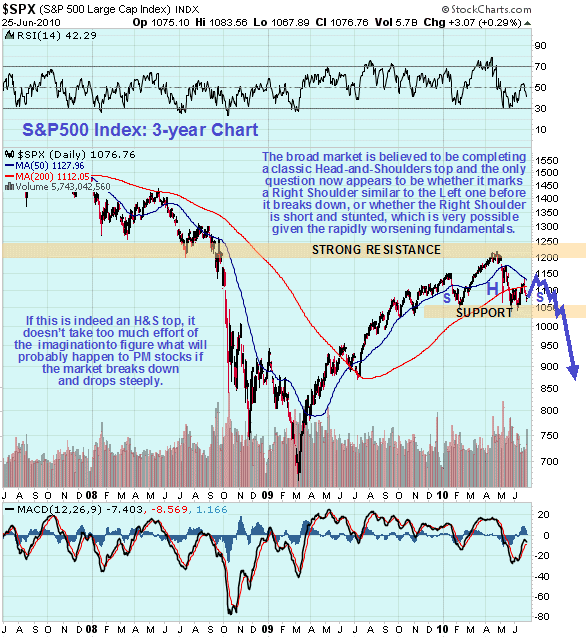
The broad market continues to lazily complete a large Head-and-Shoulders top area. While some commentators are calling this action a reaction in an ongoing bullmarket, our 3-year chart shows that the uptrend from March was a bearmarket rally that ended at an exact Fibonacci retracement level immediately it ran into a zone of strong resistance from the preceding larger top area. In addition, action in May was strongly bearish as the index dropped back from the top of the Head of the suspected Head-and-Shoulders top area with high volume down days and a near 1000 point intraday panic drop in the DJIA, which is hardly the stuff of bull markets. This is why the current pattern is regarded as a probable Head-and-Shoulders area. The neckline of the pattern is horizontal, failure of the support at which is expected to lead to a severe decline that can be expected to drag down other sectors such as the Precious Metals. The only open question now is whether the market completes a symmetrical Right Shoulder to the pattern, which could take some weeks yet, or whether, as is quite often the case, the Right Shoulder is brief and stunted - if it is the breakdown could occur very soon now, or even immediately.
While silver is certainly in position to break out to new highs, which would be expected to lead to a substantial advance, its chart at this time should certainly give cause for concern to the more cautious and prudent investor.
Silver still stubbornly refuses to confirm gold’s breakout to new highs, as do the major PM stock indices, and remains stuck in the zone of strong resistance beneath its highs of 2008. While it is in position to break out upside now, being as it is tantalizingly close to its highs, and with its moving averages correctly aligned for such a development, gold appears to be flagging and marking out a potential bearish Rising Wedge, and the broad market is believed to be topping out with the prospect of a severe decline once it breaks down. All this being so it is clear that silver may be marking out a sizeable Double Top area. However, most of the evidence that we are examining points to an imminent reversal and retreat - not a bearmarket though as the bullmarket in silver is thought to have much further to run and will probably end in a spectacular parabolic blow off with prices at dizzying heights compared to today, but this is still a long way ahead of us - over a shorter time horizon we may first have to deal with a significant correction.

As we know from experience silver has a nasty habit of dropping like a rock once it decides to go into retreat. Therefore anyone long silver or silver stocks here should consider protective measures. Although resistance is obvious and well defined on the silver chart, support levels and trendlines are not so clear. Traders and investors should therefore utilize proxies. Fortunately there are clearly uptrends in both gold and the HUI index which are shown in the Gold Market update, failure of which would be expected to lead not only to a substantial retreat by gold and PM stocks, but also of course a breakdown and severe drop in silver.
Due to the massive collateral damage that is likely to be inflicted on silver if the broad market breaks down, the section on the broad stock market included in the Gold Market update is reproduced here for convenience.
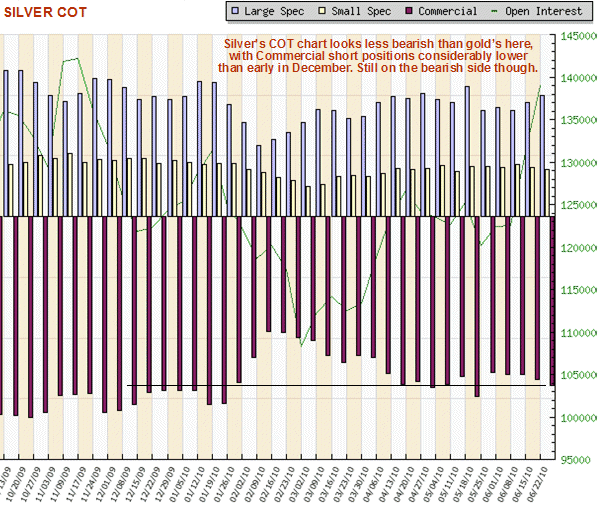
While the Commercial short position in silver shown on its COT chart is now on the bearish side, unlike gold it is not so close to the bearish levels it was at early last December.
Before anyone writes to inform me about market manipulation and J P Morgan etc - save your energy, I know about it.
Clive Maund, Diploma Technical Analysis
[email protected]
www.clivemaund.com
Copiapo, Chile, 27 June 2010


