Inflation And Price Trends 1920 To 2012


Ever since the creation of the Federal Reserve in 1913, prices somewhere in the economy are either inflating or deflating. There are two major areas for inflation to flow into:
- Financial Asset Valuation (Economic Growth or Deflation)
- Consumer Prices. (Officially rising Consumer Prices (CPI) no Longer Exist in the Dollar Economy)
Congress's housing bubble is a perfect example of the inflationary cycle. The Federal Reserve (a creation of Congress) created new dollars by purchasing US Treasury debt; Congress then legislated economic incentives with guaranteed loans at subsidized low rates, and income-tax advantages, to entice people to purchase homes, via bank loans. The housing bubble of 1999 to 2007 is not the first time our law makers have done this, as we can see in this Barron's quote from 1954:
"The Housing Act of 1954 will turn out to be one of the worst pieces of inflationary legislation ever placed on the statute-books. For the first time, non- veterans will be able to buy a $10,000 house with a down payment of $500, the Federal Housing Administration insuring a 30-year mortgage of $9,500 on such a house. This is a triumph of the Nation's Home Builder's Association and a defeat of commonsense. Unfortunately, there is no reason to hope that mortgage money lenders will resist the practical consequences of this legislative monstrosity. Throughout the' first half of' 1954, most of them have been eager to make VA mortgage loans to home-buyers at no down payment at all." - Barron's The World at Work, 05 July 1954, Page 7
Can you imagine; in 1954, $500 was a down payment for a $10,000 house? These were the same houses on which mortgages were written for hundreds of thousands of dollars just fifty years later.
Prices rise as the artificial demand created by the new dollars is focused on a single segment of the economy - housing in this case; and "growth" is created as dollars created for the housing boom spread throughout the economy. Unfortunately, "growth" (engineered-appreciating housing prices) rises faster than the ability of people to service their mortgages. Mortgage defaults eventually become the major factor driving prices in the housing market, causing housing prices, and the mortgages (financial assets created to finance the purchases) to deflate. As a reaction to the deflation in housing, money now flows out of the housing market into consumer prices (commodities), and yes; into gold and silver as fear of counter-party default arises.
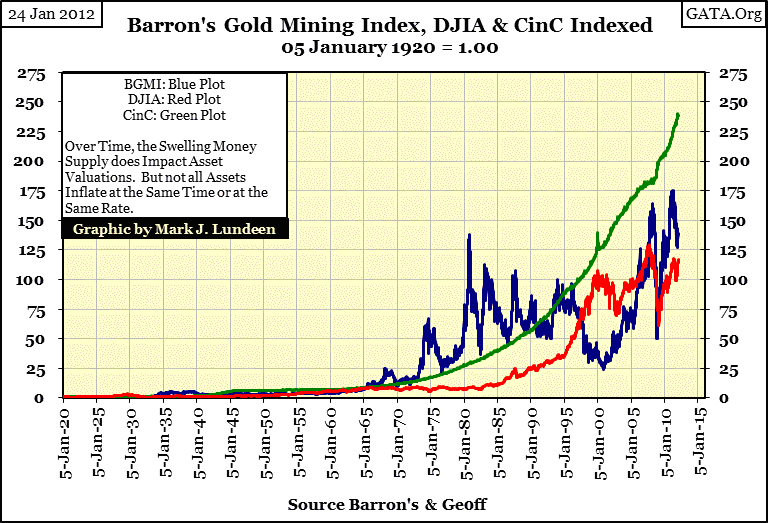
So, inflation does drive the valuation of gold and silver, but only after a financial bubble has been inflated elsewhere in the economy. This means that the original flow of inflation has little or no impact on precious metals' valuation, until the original inflationary bubble begins to deflate. Looking at the chart below, it's obvious that gold and silver have a long way to go before their bull markets come to an end. Since 1980, when gold and silver's last bull market topped, endless dollars have been "injected" into the economy, inflating massive bubbles in financial assets worldwide. To date, these bubbles have been maintained by the "policy makers" so their deflationary effects on financial assets, and the inflationary consequences in gold and silver valuations have been largely contained. However, when the Federal Reserve loses control of short and long term interest rates; and it will, rising interest rates will result in panic buying of real assets with no default risk. Until then, believing that precious metals are near their bull market top is nonsense.
Plotting CinC against the Dow Jones and Barron's Gold Mining Index (BGMI) provides an excellent example of how bull markets in precious metals and mining shares are only inflationary reactions. Below, using weekly closing data, CinC (Currency in Circulation), Dow Jones, and BGMI are indexed to 1.00 = January 1920. The Dow Jones is a proxy for financial assets, the BGMI for consumer prices & precious assets, with rising CinC the rocket fuel propelling them. Although there are periods in the chart below when the Dow Jones and the BGMI rise and fall together, without a doubt, these two asset classes are counter-cyclical to each other as CinC tends to flow first into the Dow Jones, and then blows back into the BGMI.
My next chart plots the Dow Jones and the BGMI as ratios to CinC, using the same data as above and dividing by CinC. Note the green horizontal line; this provides an inflation reference. When the Dow Jones or the BGMI rise up and break through the green line, they are appreciating faster than the Federal Reserve is expanding CinC, producing real inflation adjusted profits to investors. When the Dow Jones and BGMI decline and drop below the green line, investors are suffering inflationary loses, even though these indexes may be rising in nominal terms. For example, the Dow Jones January 2000 high (11,722), when adjusted for CinC inflation, was actually 12% higher in inflationary terms than its all-time nominal high of October 2007 (14,164).
The following fact is very interesting; note how the three major bull markets for the Dow Jones since 1920:
- 1921-1929
- 1945-1966
- 1982-2000
were * ALL * followed by bull markets in the Barron's Gold Mining Index. The bull market in the Dow was the inflationary * Action *, which was followed by the inflationary * Reaction * of rising valuations in gold mining shares. Okay, the BGMI 2001-2012 bull market has yet to rise above the green CinC line, but if history is any guide to the future, (and it usually is), it's only a matter of time before it does!
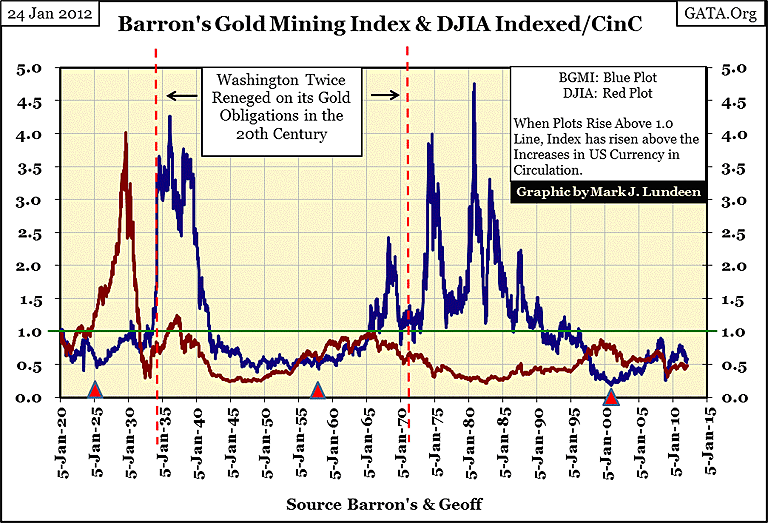
The second thing to note is that the only Dow Jones bull market that actually delivered gains in excess of the rate of inflation (increases in CinC) was the Roaring 20s bull market. All other 20th century Dow Jones bull markets may have seen significant dollar gains, but in terms of expanding CinC, they never matched the Federal Reserve's rate of inflation. This has not been true for the BGMI, whose bull markets in the 1930's and from 1958-80 both exceeded the rate of inflation by a very large measure. Unlike the gains of the Dow Jones' post 1920s bull markets, bull markets in the BGMI returned significant inflation adjusted profits to investors.
The financial media is totally ignorant of what drives gold mining shares, and gold and silver upward. They believe that war, economic, or natural disasters are the prime movers of precious metal assets, but this is just not true! Note how the BGMI collapsed during WW2, did nothing during the Korean War, and then peaked long after the US involvement in the Vietnam War ended in 1973. What drives the price of the BGMI, and ultimately gold and silver, is Washington's reckless management of the US Dollar for domestic political purposes. It's no accident that after each of Washington's 20th century's gold defaults (1934 & 1971) the BGMI entered a sustained bull market.
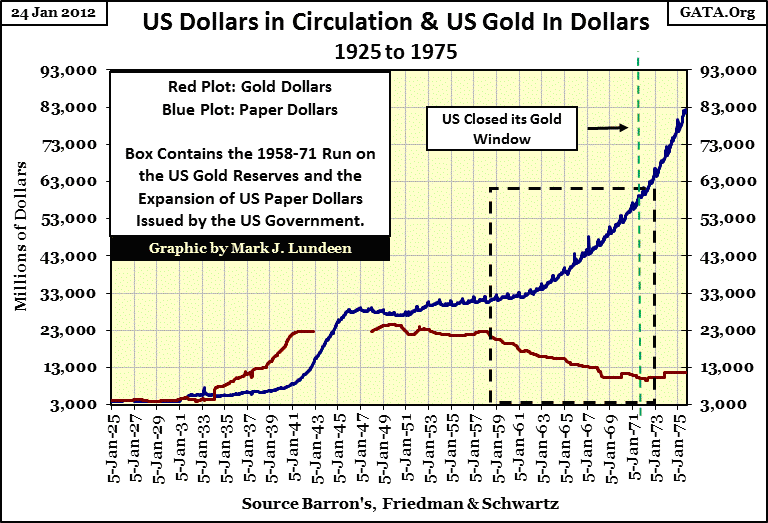
I've placed a triangle below the start of each of the three post-1920 BGMI bull markets. And yes, the triangle placed on 2001 marks the beginning of a significant BGMI bull! I say that because previous BGMI bull markets all started quietly enough; years pass before mining shares come to the attention of the general public. Take the beginning of the BGMI 1930s' bull; it began in 1925 when the US Treasury and Federal Reserve came to the rescue of the Bank of England. The beginning of the 1960s & 70s' BGMI bull market started in 1958, when a run on the US Treasury's gold reserves began as a reaction to the explosion of CinC (paper dollars in circulation). See the chart below.
Currently, Washington is risking both the US dollar by bailing out Europe's ailing Union and its banking system,exactly as it did with Britain and the Bank of England in 1925, as well as recklessly expanding CinC, just as it did in 1958. Considering the consequences from past malfeasance in US monetary policy, the future looks particularly bright for a huge bull market for the BGMI, as well as for gold and silver.
At least our economy is growing; GDP goes nowhere but up year after year. But what exactly is economic growth? One naturally associates economic growth with the increase in wealth generated by the economy, and so by proxy, the increase in prosperity for the general population. When we hear of increases in Gross Domestic Product in the media, it brings to mind increasing prosperity; but is this so? Well it should be. However it doesn't really seem to be true for the average worker or small-business entrepreneur in the past decade.
Let's take a look at GDP, in its government function as a unit of measurement for "growth" in the economy:
Gross domestic product (GDP) refers to the market value of all final goods and services produced within a country in a given period.
So, GDP doesn't directly measure how many widgets are manufactured, or how much labor is used in servicing widgets, or how beneficial people find the widgets produced. What GDP does measure are price increases, and nothing else. In 2012, economic "growth" is more dependent a printing press than anything you can do at work.
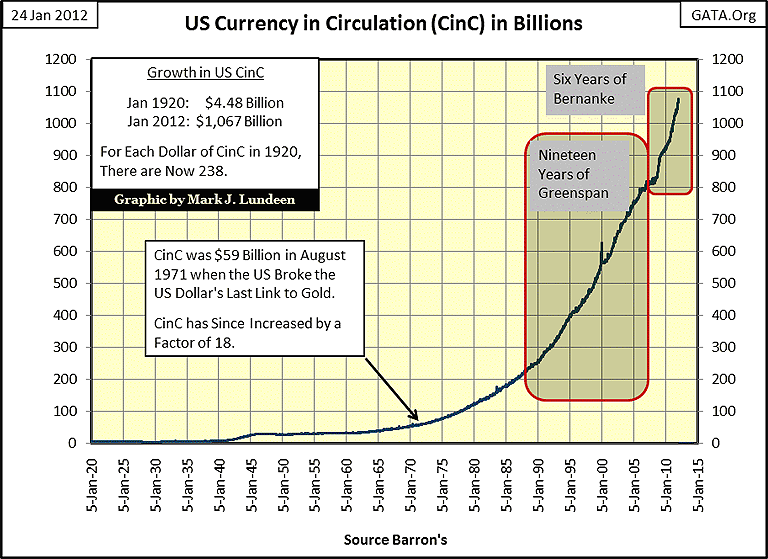
Looking at the increase in Currency in Circulation since 1930 (CinC = paper dollars & coins) in the chart below, it's obvious that "growth" in Gross Domestic Product for the past eight decades is more a function of inflation spilling from the Federal Reserve than actual increases in output from factories, or services available within the American economy. It's also apparent that inflation, (rising CinC), outstrips the economic growth measured by GDP. I'd ask an economist what this gap represents, but I know he'd only lie to me. So, I suspect that the gap between the two plots (Green CinC & Blue GDP) is most likely the measurement of parasitic consumption of wealth by the Federal government and its banking system.
Most people born after 1950 are aware that the 1970s was an inflationary era, but the 1950s also experienced horrible consumer price inflation, due to the inflationary financing of World War Two. From 1940-45, the United States saw the largest percentage increase of dollars placed into circulation in its history.
Most people in 2012 have no idea of the benefits gained by linking money creation to the available supply of gold in the economy. One solid benefit is that the gold standard kept the money supply free of economic parasites, which isstill the major objection of politicians, bankers and academics to using gold as money. Back in 1950, most working adults over 50 still remembered the blessings of price stability. Below is a quote from Larry Park's FAME.Org.
"Gold is the standard of all great civilizations. --- We [the American Federation of Labor] believe in a financial policy that will neither depreciate our currency at home nor abroad." - January 1896 issue of the American Federationist, the house organ of the American Federation of Labor
Unfortunately, Labor leaders no longer believe in honest money. As a consequence, their pension funds have been looted by corrupt public officials, with their bogus bucks and AAA rated US Mortgages and T-debt.
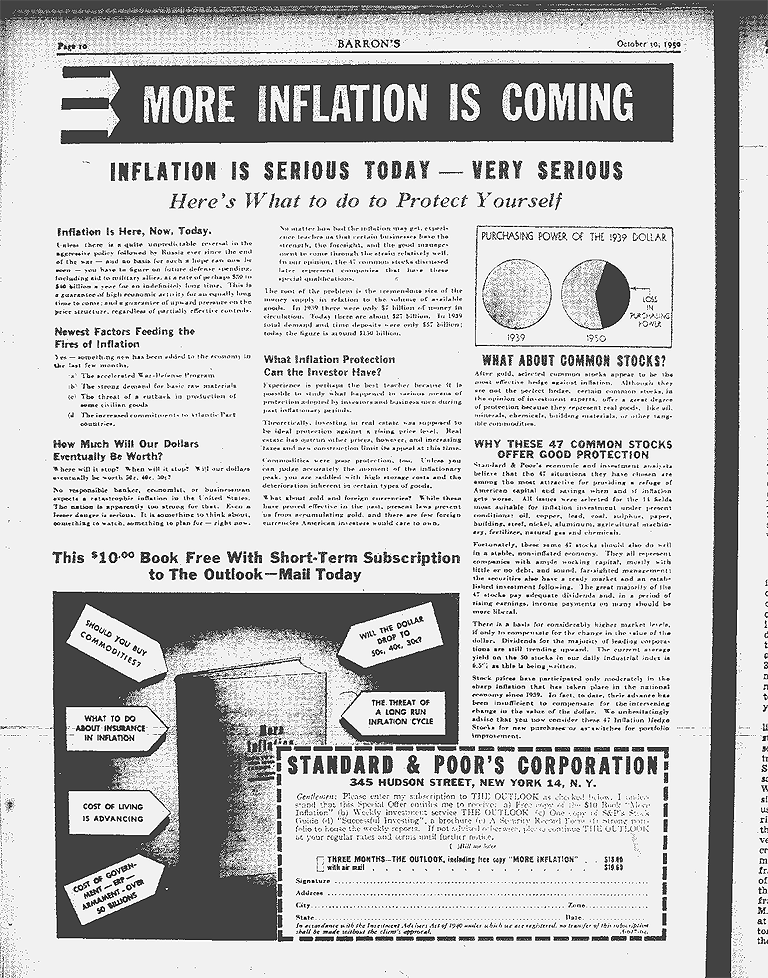
In the late 1940s and early 1950s, as consumer price inflation generated by World War II began seeping into the economy's price structure, people were shocked to see consumer prices beginning to rise, as seen in this October 1950's S&P ad in Barron's.
Printing dollars doesn't produce wealth, though it does allow a select few to consume more than they produce, at the expense of the many. Private sector increases in salaries and wages, in response to rising consumer prices, willnever compensate workers for losses inflicted on them by our corrupt monetary system. But that was the whole pointof taking the dollar off the gold standard.
Mark J. Lundeen
[email protected]
[email protected]


