Market Manipulation; No Fun No More


Governments and their central banks have inflated the global-bond markets into a bubble that will long be remembered, and written about by market historians. Look at the US Treasury bond chart below; since this bond series was issued in August, 1997, US Treasury debt has increased by 200% while bond yields have consistently decreased; bond prices have been increasing for the past fifteen years. In a functioning free-market, free from Federal regulators, (say like for moonshine, heroin or crack cocaine), a 200% increase in supply on the streets could cause the price in these markets to collapse if demand didn't increase to match the increase in supply. But many prominent money managers, such as PIMCO's Bill Gross, and central banks have publically gone on record that they have exited, or will reduce future purchases of US Treasury debt; still the yields for US Treasury Debt continue to decline, as prices rise.
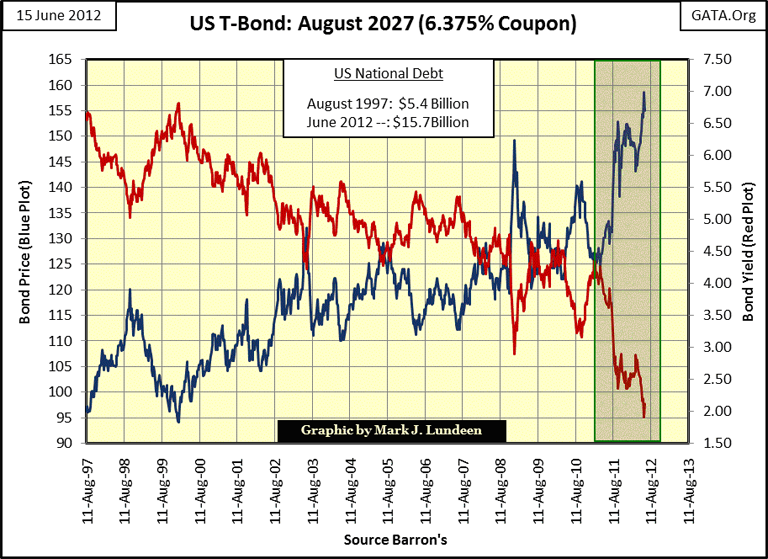
Total US Treasury debt now approaches sixteen trillion dollars, a number best left to astronomers counting stars, not to Earth-bound bankers, academics and politicians managing the supply of US dollars. Check the link above to see how many stars are within so many light-years in, and beyond the Milky Way, our home galaxy. Going out 100 million light-years, out past the Virgo super-cluster, home to many massive galaxies, we find there are only 200 trillion stars. Now compare that vast number to Wall Street's 650 trillion dollar, face valuation of the OTC derivative market. These staggering numbers of unregulated derivatives exist for no good economic purpose, and can only bring devastation to tiny-little Earth. For a bear like me, the following quote from Hamlet, Shakespeare's greatest tragedy seems appropriate:
Polonius: [Aside] "Though this be madness, yet there is method in it." --- [Approaching Hamlet] "Will you walk out into the night's air, my lord?"
Hamlet: "Into my grave."
- Shakespeare's Hamlet: scene 2
Madness (not markets) seems to fix the yields for municipal and corporate bonds as well, and then there is the mortgage rate. Just last week, Barron's reported that mortgage rates fell below 3%. How can yields for a toxic asset class, like US mortgages, decline to record forty-eight year low yields? Since 2007, mortgages haven't had a functioning secondary market, where their prices and yields could be fixed by market forces. So if mortgages are at their lowest yields since 1964, it's only because the Federal government and its agents are now their sole purchasers.
I'm sure they wish this wasn't so. From their perspective, they much prefer how things were done in the good-old-days when your life insurance company, or pension fund was paying top dollar for their junk US mortgages, plus buying a Credit Default Swap (CDS) to hedge their AAA rated investment. Regrettably, today the "policy makers" mustthemselves step into the breach and become the sole source of demand for the post credit-crisis mortgage market. If they didn't, Doctor Bernanke's banking system's worthless reserves would quickly become illiquid. After the 2008-09 credit crisis, we all know what that means! Seeing mortgage rates collapse (and mortgage prices soar) in this ersatz market only means that the Federal Reserve is "injecting liquidity" into the banking system's back door by paying increasingly higher prices for the banks' increasingly worthless mortgage reserves.
The monetary insanity is global. Without the world's currencies being pegged to a finite supply of monetized gold, global "policy makers" now hope that infinite monetary "flexibility" will resolve the problem of their illiquid banking reserves, a problem brought on by their own infinite greed. But the real problem they refuse to consider is that in a world of finite possibilities, infinities by definition become impossibilities; and the world is not far from grasping this dire reality in the financial markets.
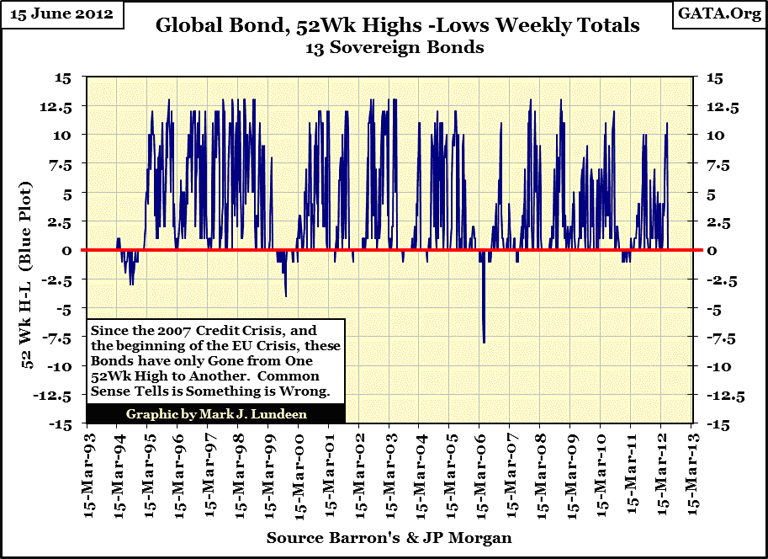
How will we know when we've passed the limit of human gullibility in the global bond markets? When we see the plot below reverse direction, as these bonds begin to make more 52 Wk lows than highs. It would have happened long ago had these bonds not been government bonds, and these governments' banking system reserves hadn't been packed with their own government's un-payable debts. In their struggle for survival, these governments and their banking systems share the same leaky-life boat, so they might go down together.
Japan is a good case in point. Last year Japan suffered from a monstrous earthquake, which was followed by a tremendous tsunami, resulting in a nuclear disaster; a World Series, bear-market triple play. But as the chart below shows, the Japanese sovereign bond market somehow completely ignored this social and economic disaster; but how? Like the Federal Reserve "rescuing" the US mortgage market, the Bank of Japan stepped into the breach, and began buying its own government's bonds with monetary inflation to manhandle the Japanese bond market's yield curve to their liking.

Without a doubt, the "policy makers" have been supporting prices in the US Treasury bond, and stock markets since before 2000. This is admitted to frequently, (if not stated directly) on CNBC. Below is a chart that tells us all we need to know about manipulating the stock market. The "policy makers" simply reverse the historical pattern of rising trading volume with rising share prices, and declining volume with declining share prices. It takes lots of money to do this, but that's not a problem if you're a central bank controlling an inflationary monetary system.

In the shaded areas, note how the red-Dow Jones plot and blue-NYSE trading volume plots violate a well-established, century long market pattern. If we can believe what we are seeing, the investing public and professional money managers are increasing their exposure to the stock market when prices are plummeting, and pulling out of the stock market when prices for the Dow Jones advance. But we know that this can't be true, so these strange patterns are in fact the finger prints of "policy operations", left behind at the scene of the crime by the smartest swindlers in the world.
The thing to watch for now is what trading volume does next time the stock market takes a serious tumble. My guess is that trading volume will once again surge upward as the Federal Reserve's banking system again purchases stocks at prices others refuse to pay. If they are to maintain the stock market at bubble valuations, they have no other choice.
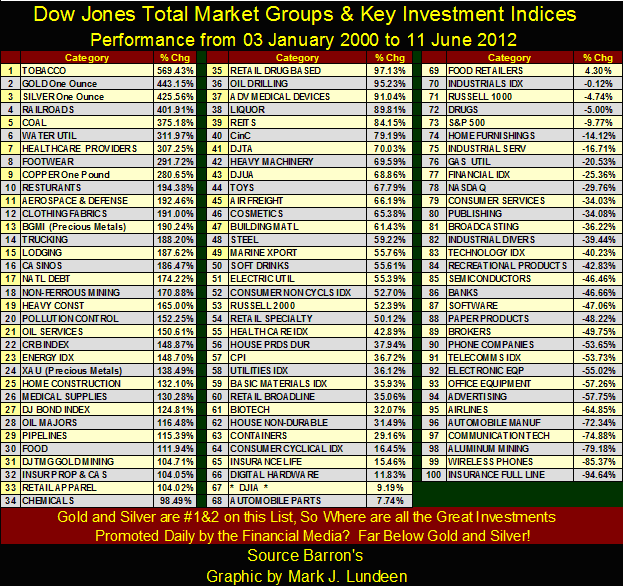
Since January, 2000 which investments have provided investors with inflation adjusted, real returns? I'll give you a hint; it wasn't US T-debt or the stock market.
But most people are completely unaware of our ongoing bull markets in precious metals and mining shares, as most people's investment information comes from "respectable" news sources, not from people like me. Current financial news is reported from a trader's short term perspective of hours, days and weeks; while decade long trends are ignored.
So it's not at all surprising that, for the past twelve years, mainstream financial reporting has kept in-line with current Keynesian economic opinion that paper financial assets are good, while gold and silver related investments arebarbaric; actual objects of ridicule no matter how wrong these professionals have been for the past twelve years.
Their two favorite sectors, high-tech and bank stocks, are located somewhere deep in the third column of the table below (#85, 86 & 87) with double-digit negative twelve year returns. In a bear market, skilled traders can make money playing the advances and declines in a declining stock group, but the typical retail investor cannot. Retail investors can only succeed in making profits by participating in an actual bull market. However, the financial media has convinced investors to avoid the bull market of the early 21st century, natural resources, and continue to play the bull market of the 1990s, high tech and financials.
The chart below is a dose of reality. Ever since the Federal Reserve System was first foisted on the American public, monetary inflation has been a constant factor in the US economy. Since 1920, the Fed has increased the quantity of currency in circulation (paper dollars and base metal coins) by a factor of 250:1. Look at the insert in the chart below. In 1971 when the scofflaws in Washington broke the final link between the US dollar and gold, the Fed had already increased CinC by a factor of 12.5:1 in fifty-one years.
The post 1945 increase in CinC was done in violation of the Bretton Woods Monetary Agreement, an international treaty that had the force of law in the United States, by which the US had agreed to constrict its CinC to only $35 paper dollars for each ounce of gold held in the US Treasury vaults. Nixon terminated the gold peg of this ratified treaty with a mere executive order. Curiously, Congress omitted this flagrant breach of international law when they compiled Nixon's articles of impeachment a few years later. So, since August 1971, forty one years ago, US Currency in Circulation has increased again by a factor of 20:1, a dilution of 95%. Our dollar was once an asset in its own right, when paper money was convertible into gold and silver coin. However it has now become the play thing for the powerful interests that control the Federal Reserve.
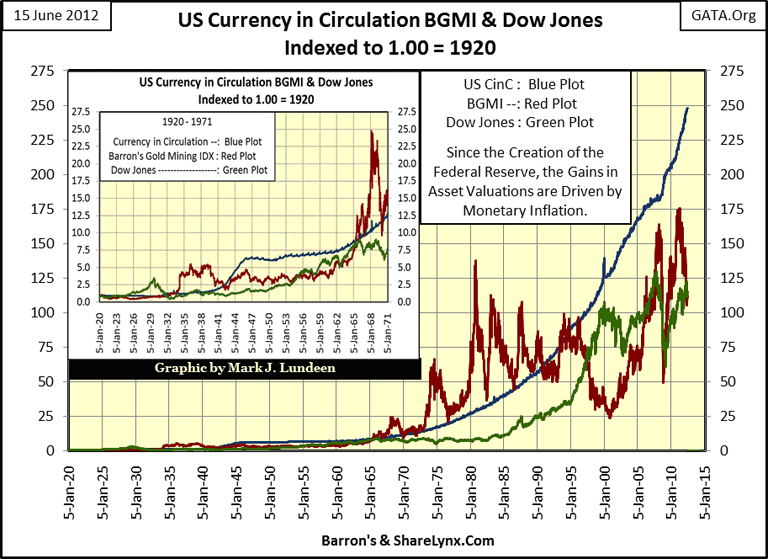
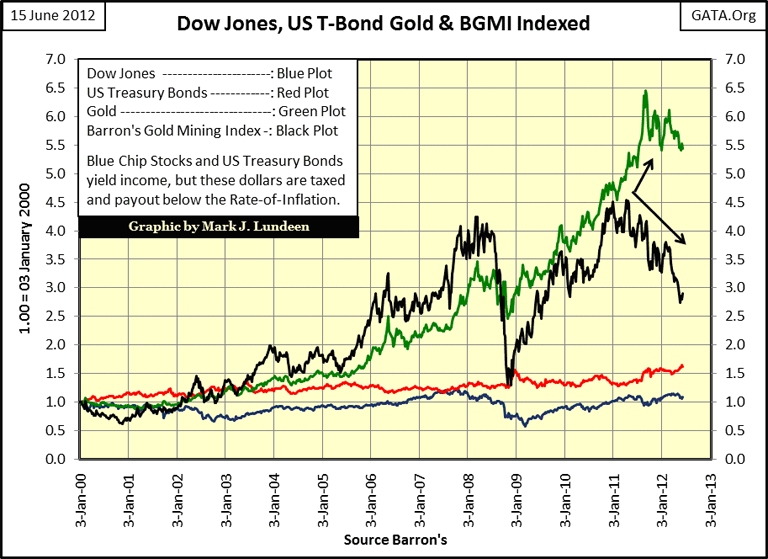
Money today has become an instrument of the inflationist with no connection to any economic reality. Still, dollars flowing into and out of markets drives price trends, and so controls our lives. Take a moment and study the relationships between CinC (blue plot), the Dow Jones (green plot), and the Barron's Gold Mining Index (red plot) from 1920 to the present. While CinC (monetary inflation) only increases, the valuations for the Dow Jones and BGMI are clearly influenced by the number of dollars placed into circulation by the "policy makers."
But there is a difference that we, as investors, need to be aware; since 1920, the only Dow Jones bull market that ever saw gains above the expansion of CinC occurred during the Roaring 20s. The next best bull market for the Dow Jones peaked in 1965, when it touched CinC in the insert for the chart above. But after capital gains taxes were paid on the Dow Jones' inflationary gains, investors were left with a return below the rate of inflation. The giant 1982-2000 bull market's gains never matched the increase in CinC even before taxes, and the current Dow Jones' 2007 all-time high (in inflation adjusted terms), was an inflationary loser even when compared to the Dow Jones' January 2000 high. These "bull markets" were bought and paid for with inflationary dollars courtesy of the Fed.
Now compare the Dow Jones with Barron's Gold Mining Index; it's frequently counter-cyclical to the general stock market, precisely at those times when investors really do need a counter-cyclical investment vehicle to escape from deflating financial assets traded in the stock and debt markets. The BGMI saw a larger bull market in the 1930s than the Dow Jones saw during the Roaring 20s. The same was true during the 1970s. Note too that from 1965 to 1995, with one exception, the BGMI's appreciation never fell below the rate of CinC inflation. Few, if any, market professionals are aware of this amazing fact.
Since 2000, the BGMI is once again moving up. Looking at the ninety-two years of market history above, bull markets in gold mining shares are MASSIVE BULL MARKETS, terminating far above the CinC plot. Unlike the post 1930's Dow Jones' bull markets, bull markets for the BGMI have always rewarded investors with outstanding gains, far above the rate of inflation. Look at the chart. In the next few years I expect the BGMI to do it again, long before the Dow Jones' current bear market comes to its painful conclusion.
So, is the Dow Jones in a bear market? Yes it is!
Here is a chart for the money market. The money market trades 90-day commercial paper that companies in the Dow Jones and S&P 500 use to fund their inventory, and other short term funding needs. When the economy is roaring, we see the blue dollar plot increase, and new BEV Zeroes% in the Red Bear's Eye View plot. But when the economy is slowing, the blue plot declines, and the red BEV plot tells us the precise percentage corporate short term funding has declined from its last all-time high (BEV Zero%).
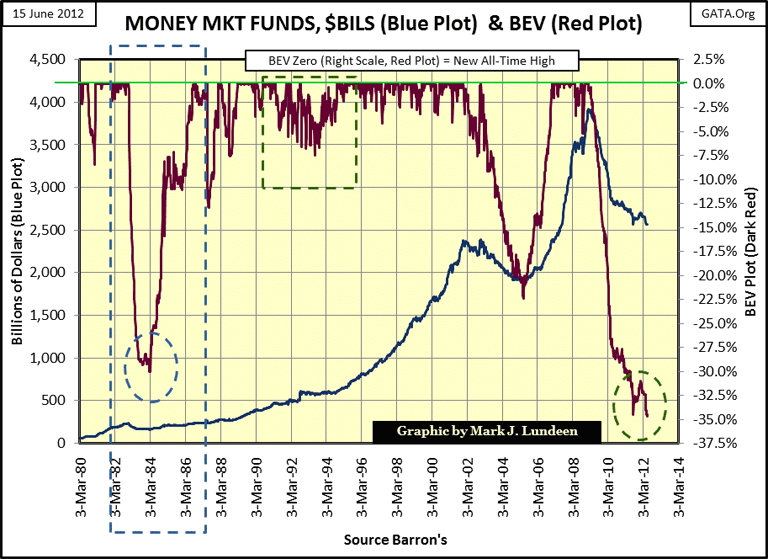
Just last week, the money market saw its largest percentage decline since 1980. There can be only one explanation for this; corporate America's demand for short term funding is collapsing because American business is pulling back on its operations. These companies are not going to manufacture what they can't sell to over-extended consumers the world over. The current collapse began in 2008, just months before President Obama was sworn into office. And as far as the money market is concerned, his economic policies have been total failures in their attempt to stimulate the economy. The unemployment situation of the past four years is also validated by this data.
Considering what is happening with the money market and unemployment, one has to wonder exactly how the earnings for the Dow Jones have risen 218% since a disciple of William Ayres (President Obama) became president. If the accounting rules of 1982 (the accounting standards used at the start of the 1982-2000 bull market) were applied to the books of the companies listed in the Dow Jones today, I would not be surprised that many companies listed in the Dow Jones earnings actually posting negative earnings. Don't go blaming Dow Jones Inc. for this situation. They only publish the statistics sent to them. It's the Federal regulatory agencies who are responsible for setting standards to protect the public from questionable corporate record keeping, and dubious business practices.
Unfortunately, our "regulated markets" are just a continuing scam on a trusting public. People get upset when I say this. They think I'll lose my creditability expressing this opinion, to which I say: I didn't always think this way. But since the Long Term Capital Management fiasco of late 1990s, the list of regulatory failures has been a long and a costly one for the general investing public. I'm shocked that many more people aren't as upset as I am with our ever growing government regulatory bureaucracy that Congress allows Wall Street to staff with people who have no interest in protecting the public.
Market Update
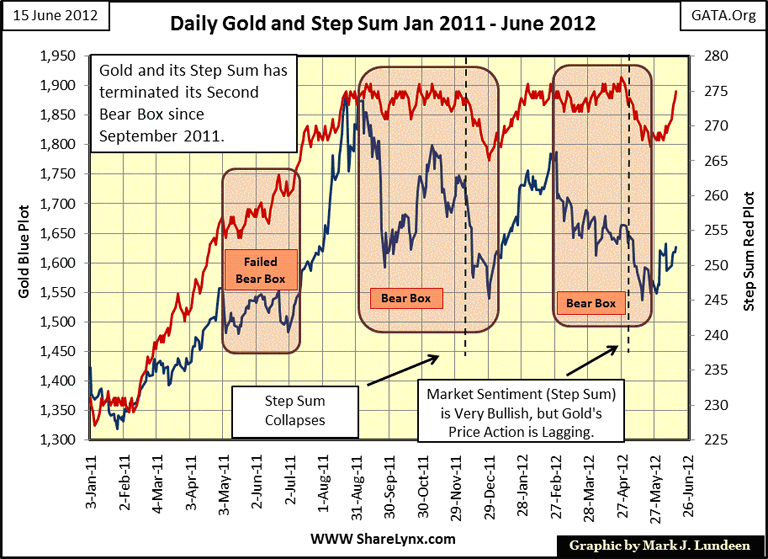
For the precious metals markets, I have some good news, and some bad news. The good news is that gold and its step sum seems to be flashing a buy signal; "seems to be?" Well, I'd like to see a sharper V shape bottom for the two plots in the gold chart below. Clearly, the "I'm as mad as hell, and I'm not going to take this anymore" attitude that was present in the rebound after the August - December bear box is missing from the current bear box. I note too how the increase in the price of gold has lacked the enthusiasm its step sum has shown. I'd rather see gold charging ahead with its step sum holding back, thus forming a Bull Box.
So seeing market sentiment (the step sum) charging ahead of its price trend is a concern. After all, the step sum's trend is what the market participants expect, but the price trend is what the market is willing to deliver. I have to say that, so far, the bulls have good reason to be a little disappointed. Eight of the past nine trading days for gold have been up days; and this is all the bulls got?
I have no doubt that the bull markets for gold and silver are not only real, but will prove to be long term events, lasting for years to come. So I have to ask myself: what do we risk by buying gold now? My best guess is about $100 to $200 to the downside; about 12% in percentage terms for purchasing gold at today's prices. And seeing a 12% dip in the price of paper futures contracts in gold is no guarantee you could find any actual bullion available for sale at those prices at your local coin shop. They would sell out in an instant, or increase their premium over spot, or maybe just sit on their inventory and put the "closed" sign on the door and go fishing. So, what are the potential gains to the upside if we buy gold at $1600? For people who don't trade, and just sit tight for the next three to four years, I expect they'll see the price of gold somewhere between $20,000 to $30,000 range. Impossible you say? Not in a world where governments' domestic concerns are motivating them to inflate the global money supply towards infinity.
And never forget that during the 1969-80 gold bull market, demand was primarily from North America and Europe; the Communist-block countries had made gold ownership illegal. Thirty years later, all that has changed. The global demand for gold in this cycle will totally overwhelm the supply of available gold. This is especially so as in the past thirty years, global financial and monetary situation has become very unstable. Consider, too, that in the 1970s, the US Treasury, IMF, and other central banks were sellers of gold by the thousands of tons to defend the US dollar. These bankers have always been sleazy, but they have never been stupid. Since 2011, they have now become buyers of huge amounts of gold; they must see the end of the post Bretton Wood's paper dollar regime coming their way.
So what do I think about $1600 gold? CHEAP!
Let's look at silver. For the past month, silver's step sum has flat-lined as the price of silver goes up a day or two, only to repeat this sad performance to the down side. The market is clueless of what the next move in silver will be. But then look at the price of silver; its step sum may be glued to the floor, but the price itself has been moving slowly up in the past month. What do I think the next big move in silver will be? Like the market, I too am clueless of what the next big move will be. But if I was forced to give my opinion if silver's next big movement was up or down, I'd say the chances of silver making a new low of the move were better than going up into a new bullish thrust to higher prices.

But all the reasons I listed for buying gold at these levels also apply to silver, so $28 silver is a buy if you take it home and forget about it for the next three or four years. Remember, I'm not a trader who looks at markets in the short term. I like catching on to bull markets early, before the crowd gets there. If you want to make money, get in before the lines form, and sell into feeding frenzies. To my eyes, silver at these prices meets the entry point of these criteria. The feeding frenzies will come to those who are patient.
What about the Dow Jones? I doubt it will exceed its high of October 2007 anytime soon, if ever, even though right now a 9% move would get the job done. Why would I say this? It's just a gut feeling that I have.

Things have changed since October 2007. The credit crisis scared a lot of people in high places, (politicians up for reelection) who don't want to go through that again. Before the credit crisis, the "policy makers" were happy to see the Dow Jones soar far above its highs of January 2000. Today, I don't think that's at all the case. They understand how much their market rig has deteriorated over the past few years. Between rising gold and silver prices, plus the all too frequent seam-splits in the derivative market, the "policy makers" know their control over price trends is not what it once was. Hell, Greenspan could actually mumble incomprehensible nonsense before Congress (and yes he did mumble!) and the stock and bond markets would surge. What a different world Doctor Bernanke has to deal with; what once only took a few minutes of mumbling, now takes a "monetary injection" of few hundred billion dollars. I don't think those with the power to drive the Dow Jones to a new all-time highs want to do it, for fear of becoming bear bait in their weakened state. With the Dow Jones range bound between 12,000 and 13,000, and no one squawking for more, I think they'll leave a sleeping bear alone and forgo any excitement to the upside. How long Mr Bear will nap is anyone's guess.
Mark J. Lundeen
[email protected]
[email protected]


