A Look at Gold


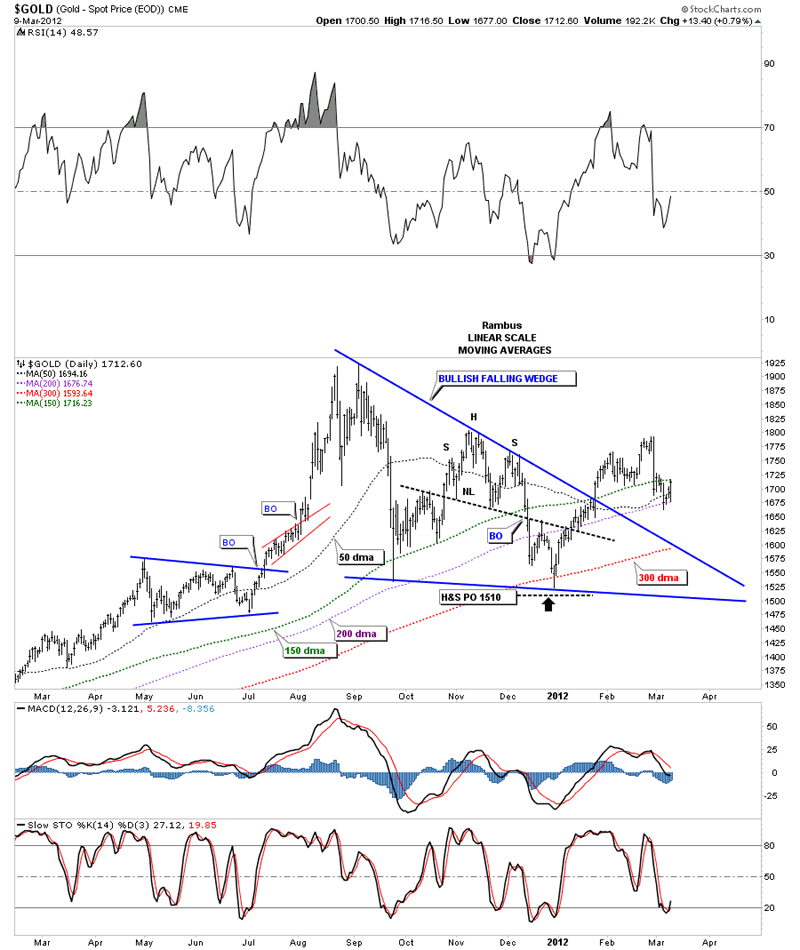
In this report I want to focus on just some simple but effect indicators such as moving averages and Fibonacci retracements. The first chart shows some daily moving averages that have come into play at some point in the bull market. The 150 dma has been one of the best short term moving averages for identifying bottoms and the 300 dma has been very good for the longer term. Then of course you have your 50 and 200 daily moving averages that come into play from time to time like right now for example. Gold is currently being supported by the 50 and 200 dma with the 300 dma support coming in at 1593. I would like to see gold start trading above the 150 dma which has been very good support in the pasts.
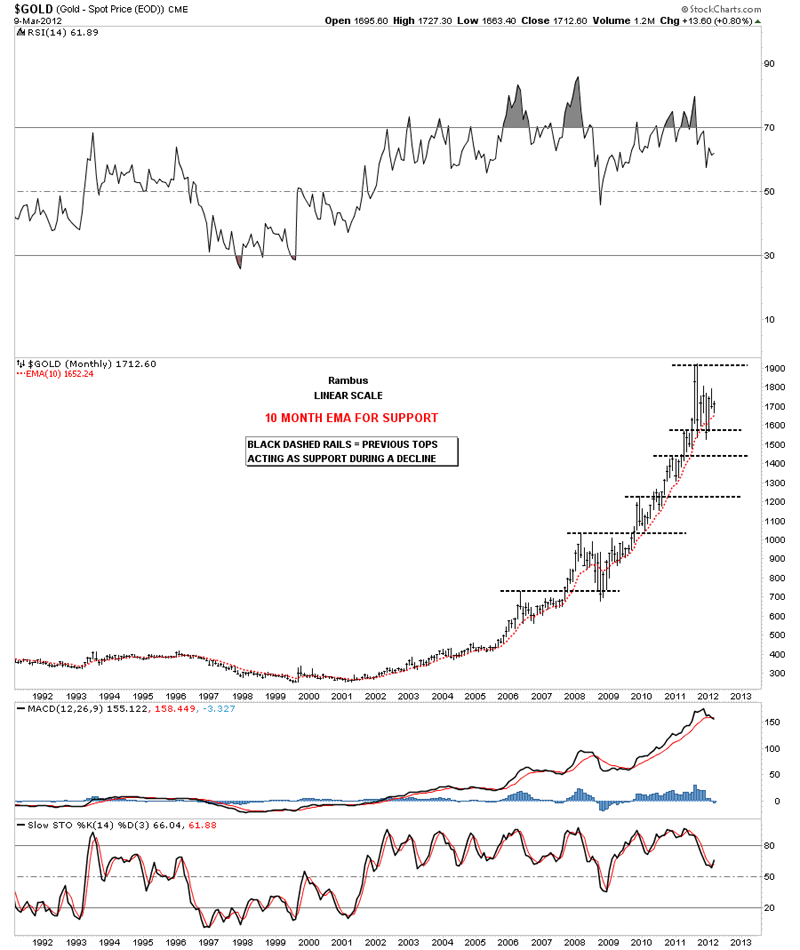
The 10 month ema has done an outstanding job of holding support for most of the bull market. During the 2008 crash low the 10 month ema closed below the price action for about 3 months where it quickly recovered and held support until our most recent consolidation pattern. During our recent correction the 10 month ema close below the price action only one month where it again recovered quickly. The current 10 month ema comes in at 1624 which is just below the low made so far in March.
The last moving average I would like to show and is probably my favorite is the 65 week ma. As you can see on the chart below the only time it has failed was during the 2008 crash. In every other instance the 65 week ma has held support. Even our latest correction held support at the 65 week ma.

The next gold chart I would like to show is the Fibonacci retrace of our latest correction. After hitting the bottom in late 2011 gold went on a nice run higher up to 1792 where we got the flash crash almost 2 weeks ago. So far the fib 50% retrace has held support.

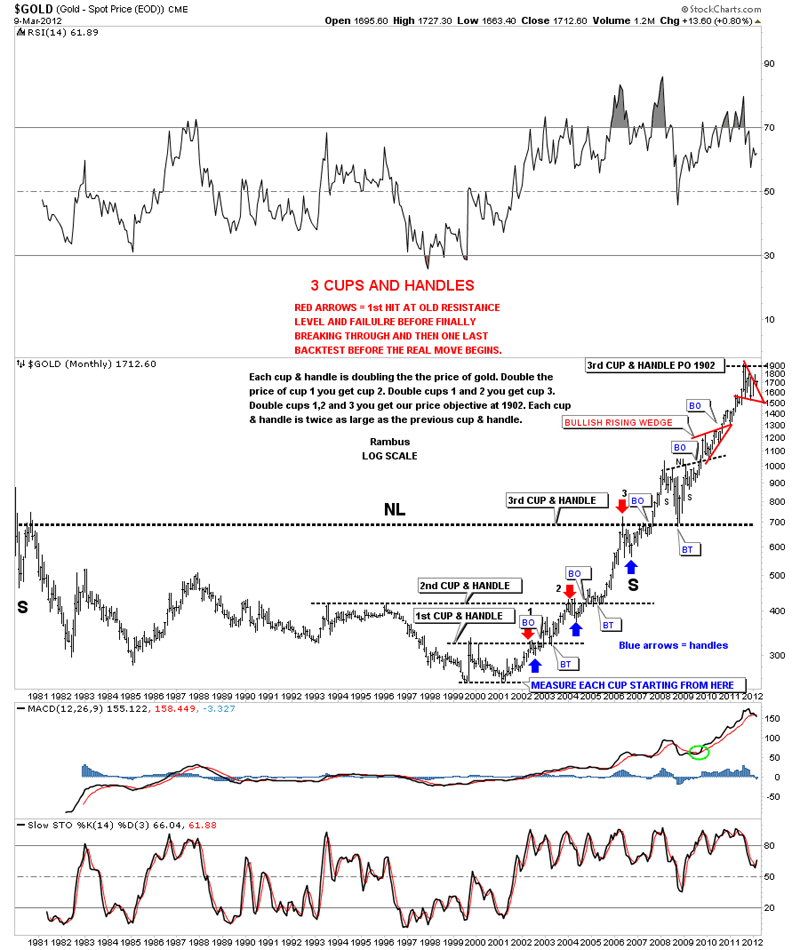
The last chart I would like to show is a very long term chart that goes all the way back to the 1980 bull market high in gold. This long term chart of gold is probably my favorite as it has been playing out for many years now. Its also a good study in support and resistance. What this chart shows is how each level, cup and handle, has doubled in size, blue and red arrows. If you start with the first cup, at the bottom of the chart, and add that measurement to cup #2 you have a double. Then if you take the distance of both cups 1 and 2 together, and add them to the top of the 2nd cup you again get a double with a price objective to the top of cup 3. Our last move to 1900 was a double of the preceding 3 cups. There is also a nice H&S base that started in 1980 and finally broke the neckline and cup #3 in August of 2007. From that point the bull market doubled again to our recent high at 1920. This chart has now done everything it was designed to do so I don't know if there is any more to expect from it. I just doubled the whole bull market from the bottom in 2001 to our most recent high, just for the heck of it, which gave me a price objective to over 14,000. I really don't think gold will go that high so I'll just keep it on file for future reference.
To Subscribe to Rambus Chartology and see Rambus' 10 Favorite PM Stocks and a World of Charts and Projections including the Chartology Forum where Rambus answers your Questions and even Charts your Favorite PM Stocks by Request, go to : www.rambus1.com
 Meet Rambus, a seasoned trader and technical analyst renowned for his unbiased and insightful chart work. Through his website, Rambus Chartology, and Substack newsletter, Rambus shares his expertise with a global community of subscribers, providing daily updates, commentaries, and hands-on training in the art and science of chartology. With his calm, humble, and down-to-earth approach, Rambus demystifies complex market trends, helping his followers navigate the challenges of today's volatile markets. Join the Rambus Chartology community today and discover a unique blend of technical analysis, trading expertise, and time-tested protocols. Subscribe now at www.rambus1.com or https://rambuschartology.substack.com/
More from Gold-Eagle


