$10,000 Gold, Is it Possible?


 When analysts forecast future asset prices they typically choose valuations that make sense in the context of current valuations. We could, for instance, easily imagine that a $100/share stock can trade up to $120/share. But when somebody comes out and says that it can go to $1,000/share in a few years time this person is ridiculed because it is very difficult for us to imagine a reality that differs wildly from the current state of affairs. So when I suggest that the gold price can rise to a level in the 5-digit range, I expect to be ridiculed or to have my forecast overlooked by most market participants. Nevertheless, as we will see in a moment the prospect of 5-digit gold is not so far-fetched. Gold at $10,000 or higher is not as unlikely as many people would think.
Gold is priced in U. S. Dollars, and its price is, in fact, a reflection of the market’s sentiment with respect to the Dollar’s purchasing power. Since gold’s monetary role far outweighs its industrial role, a rising gold price reflects one or both of two things–an increase in the supply of Dollars, and/or an increase in bearish Dollar sentiment. The first of these is fairly objective, although there are numerous ways of measuring the money supply. The second is intersubjective, or the culmination of the various sentiments of all market participants.
The famous gold analyst–James Turk–came up with a way of quantifying this through his Fear Index. The Fear Index is a ratio that measures the value of America’s gold (i.e. the gold that is presumed to be at Fort Knox, or 287 million ounces multiplied by the market gold price) and divides it by the most inclusive measure of money supply–M3. The idea here is that the higher the ratio the more investors question the value of the Dollar, and they would consequently want–in theory–greater convertibility between gold and the Dollar. Back in 1980, when the gold market peaked, the Fear Index peaked as well at about 10%. It bottomed in 2001 at about 0.9%. After nearly reaching 4% in 2011 the Fear Index has retreated to around 2% at the start of 2014. This data is illustrated on the following chart.
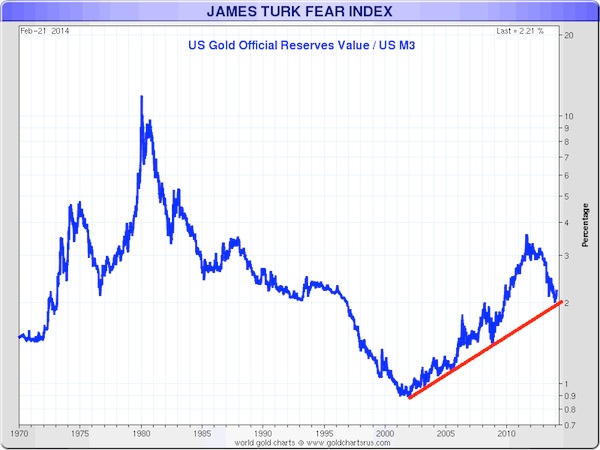
Before moving on note that the Federal Reserve stopped calculating the M3 money supply back in 2006, and so I will use the data provided by John Williams of ShadowStats.com.
Right now the American gold supply remains at 287 million ounces worth $1,320/oz, and the M3 money supply–as estimated by John Williams–is about $15.5 trillion. This puts the Fear Index at about 2.4%. Now if gold were to peak with a Fear Index reading of 10% the gold price would have to increase 4.1 times to $5,400/oz. But we know that the M3 money supply is increasing at about 5% per year, and as we can see from the following chart, the M3 money supply growth rate appears to be accelerating.
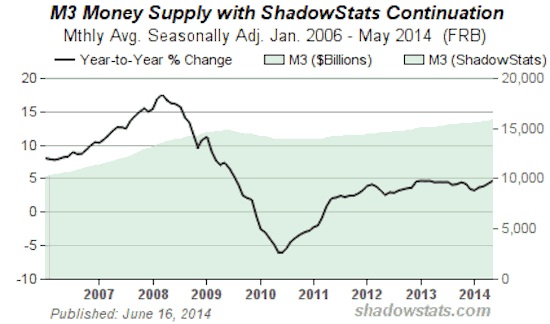
If we assume a 5% annual growth rate, which given the apparent acceleration is conservative, then depending on the amount of time it takes for the gold price to peak we get the following price targets using the above assumptions:
- $5,670/oz.
- $5,954/oz.
- $6,252/oz.
- $6,565/oz.
- $6,893/oz.
- $7,237/oz.
However this still doesn’t get us to 5-digits. But I believe that we can easily get there given the following two assumptions.
- The M3 money supply has been growing at a much slower rate than the monetary base due to temporary and unsustainable demand for the Dollar that will dissipate over time, and at some point in the next 5 years or so the M3 money supply will catch up with the increase we have seen in the monetary base.
- New sources of demand, and the fact that the debt bubble today far outweighs the debt bubble that began to deflate in the 1950′s lead me to believe that the 10% peak in the Fear Index in 1980 can easily be breached in this bull market.
Let’s look at each assumption briefly.
Assumption 1
Gold bears often argue that the rapid increase in the money supply hasn’t had a significant impact on inflation, and as the CPI isn’t climbing we should expect further weakness in the gold market. However, the counter argument can be summarized in three points.
- Inflation is higher than the CPI says it is. The CPI’s ascent trails that of nearly every single component that goes into it.
- Even with point 1, the inflation rate trails the rate of base money creation, and this is the case because the value of the Dollar is determined by both supply and demand, and Dollar demand has been stronger overseas given that a large percentage of global trade takes place in Dollars, and this increases demand for, and the value of Dollars.
- The velocity of money remains near all-time lows. When all of the newly-printed money begins flowing throughout the economy, we are likely to see a rapid rise in inflation.
What is going on is that the world needs Dollars, and this places a bid underneath the Dollar. But this is changing as nations throughout the world are signing bilateral trade agreements that allow for trade in local currencies or in Euros. As this takes place the demand for Dollars overseas declines, and the only demand comes from those who demand Dollars–Americans. As the supply of Dollars becomes concentrated in the hands of only Americans when it at one point was dispersed throughout the world prices will increase as more Dollars will be bidding up the prices of the same amount of goods. In fact it will be fewer goods because as the world stops accepting dollars they will stop trading with the U. S., and this means that the U. S. will import fewer goods.
The end result will be that the recent and ongoing increase we have seen in the monetary base over the past 6 years or so will be reflected in broader measures of the money supply.
How devastating can this be?
In September, 2008–before TARP and quantitative easing–the monetary base was about $910 billion. Now nearly 6 years later it has grown to $3.9 trillion, which is an increase of 330%. Now if we look at the above chart we see that the M3 money supply has been basically flat, which reflects the aforementioned demand for dollars. It follows that if this demand disappears, as I suggest it will, then we could see M3 money supply rise to reflect the increase in the monetary base.
So our previous $5,400/oz. target suddenly becomes $23,143/oz, and our five subsequent initial targets would rise accordingly.
Assumption 2
There is no reason why the Fear Index has to peak at 10%, and in fact there is reason to believe that the Fear Index can rise substantially higher than it did back in the 1970′s – 1980. There are two reasons for this.
The first is that there are numerous sources of demand for gold today that didn’t exist back in the 1970′s. Back in the 1970′s gold was something that was owned primarily by a few Western central banks. American citizens were not allowed to own gold until the end of 1974. Developing market central banks such as the Central Bank of Russia and the Peoples Bank of China had minuscule balance sheets compared with the size of the gold market. Citizens in developing countries lived under heavily restrictive socialist regimes, and if they were allowed to buy gold they were too poor to do so.
All of the sources just mentioned are critical sources of demand in today’s market.
The second is that the debt bubble that deflated in the U. S. bond market in the 1950′s through the early 1980′s was much smaller than the current debt bubble. Interest rates hasn’t sunk as low as they have in recent months and years. The total size of the U. S. government debt market along with the government’s unfunded liabilities, state and local debts, as well as corporate and personal debts dwarf the same market from 35-40 years ago. This claim can lead to a lengthy discussion, but just consider a few points.
- The current debt to GDP ratio exceeds 100%, whereas in the 1970′s and in 1980 it was below 40%.
- Now America has an aging population with more citizens becoming eligible for Social Security and Medicare benefits to the point that the government pays out more than it takes in for these programs. The opposite was true i the 1970′s.
- The personal savings rate back then was over 10%, meaning that of every dollar that an American earned in the 1970′s he put away 10 cents. This figure has dropped to the mid-single digits. This means that there is less money available to lend, and less money available to prop up the enormous debt market.
As the debt bubble deflates this will push money out of bonds and interest-bearing assets such as CDs and dividend paying stocks, and into hard assets such as gold. The effect this time should be more substantial given that interest bearing assets are so over-owned in the western world.
Concluding Remarks
The impetus behind each of these assumptions can push the gold price well above $10,000. If we consider them together the possible upside in the gold market becomes unfathomable, and at that point the discussion almost becomes ludicrous because we are talking about a market that can multiply 10 times in value easily (and probably more), versus a downside risk of $1,200/ounce, or if the bears get one more short term victory we could see the $1,000/oz. level tested. Few assets possess such an asymmetric risk/reward opportunity and one has to conclude that buying gold at current prices is an extremely wise decision.
Start profiting from the next move higher in precious metals with the Gold Stock Bull Premium Membership. Get the monthly contrarian newsletter, our model portfolio, trade alerts, premium guides and more. Click below to get instant access!

Jason Hamlin is the founder of Nicoya Research and has been publishing investment research at goldstockbull.com since 2006. His background is in data analytics for the world’s largest market research firm. Jason consulted to Fortune 500 companies around the globe, including Nestlé, Johnson & Johnson and Del Monte. Jason eventually left the corporate world and leveraged his analytical skills to trade stocks successfully full-time. Jason is a contrarian, cycles investor and student of Austrian economics. He is a proponent of sound money, limited government, decentralization of power and the non-aggression principle (NAP). His website is at nicoyaresearch.com. You can reach Jason at: https://nicoyaresearch.com/contact-us/.


