A $1.5 Trillion Opportunity You Wouldn’t Want To Miss!


On the campaign trail, then-presidential candidate Donald Trump pledged to invest as much as $1 trillion in U.S. infrastructure if he were elected. Last week during his first State of the Union address, now-President Trump added half a trillion dollars more to that figure.
The hefty price tag likely raised some eyebrows among Congress members, but Trump is right in aiming high to fix the country’s “crumbling infrastructure,” as he calls it. According to the American Society of Civil Engineers (ASCE), the U.S. faces an infrastructure funding gap of more than $2 trillion between now and 2025, resulting in potential losses of nearly $4 trillion in gross domestic product (GDP), or $34,000 per household.
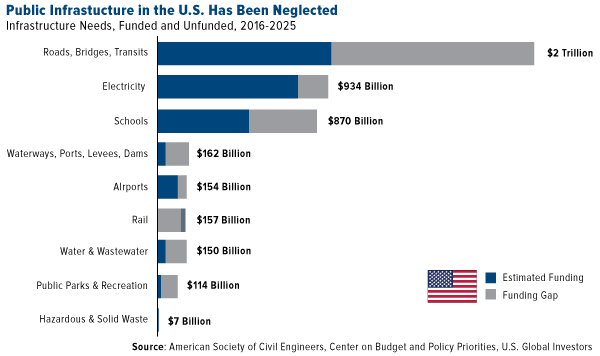
Take a look at public spending on U.S. streets and highways as a percent of GDP. Since the financial crisis a decade ago, investment has tanked, and anyone who regularly drives can see firsthand the consequences of this negligence. Americans spend 42 hours on average sitting in congestion every year, costing each driver roughly $1,400, and last week the American Roads & Transportation Builders Association (ARTBA) reported that more than 54,000 of the country’s 612,677 bridges are rated “structurally deficient.”

Anticipating a shift in priority toward infrastructure, contractors and construction firms are gearing up to take on new projects, with a whopping 75 percent of them planning to expand their headcount this year. This comes after an estimated 192,000 new construction jobs opened up every month in 2017, a figure that’s significantly up from the 88,000 new positions that came online every month only five years ago.
But contractors shouldn’t be the only ones getting ready for a new American construction boom. As I shared with you last month, the recipe calls for a broad commodities rally this year, and I would hate for investors to miss out. With global synchronized growth underway and demand outstripping supply in a number of cases, not to mention the U.S. dollar in decline and inflation on the rise, commodities are poised to be among the best performing asset classes in 2018.
Commodities as Cheap as (or Cheaper Than) They’ve Ever Been
Pay close attention to where commodities are relative to equities right now. Compared to the S&P 500 Index, materials are extremely undervalued, the most since at least 1970. This makes now a very attractive entry point—or as natural resource investors Goehring & Rozencwajg Associates writes in its quarterly report, there could be “a proverbial fortune to be made” if investors take advantage of this once-in-a-generation opportunity.
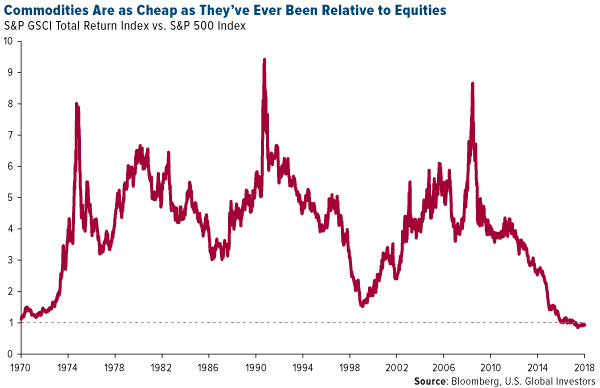
“When commodities are this cheap relative to stocks, the returns accruing to commodity investors have been spectacular,” the firm continues:
For example, had an investor bought the Goldman Sachs Commodity Index (or something equivalent) in 1970, by 1974 he would have compounded his money at 50 percent per year. From 1970 to 1980, commodities compounded annually in price by 20 percent. If that same investor had bought commodities in 2000, he would have also compounded his money at 20 percent for the next 10 years.
Past performance doesn’t guarantee future results, of course, but the implications here are very compelling if mean reversion takes place. There have been few times that I can remember when an asset class looked as favorable as commodities do now. If you agree, it might be time to consider adding exposure to materials, energy and mining to your portfolio.
Oil Just Had Its Best January Since 2006—Further Gains Ahead?
Energy in particular looks very attractive. West Texas Intermediate (WTI) crude oil, the American benchmark, logged its best January since 2006, gaining more than 7 percent on scorching hot demand, sustained production cuts by the Organization of Petroleum Exporting Countries (OPEC), deteriorating output from Venezuela and a record-setting stockpile drawdown. U.S. oil inventories declined for 10 straight weeks as of January 24, the longest stretch ever recorded, before jumping again in the week ended January 31.
What’s more, the U.S. Energy Information Administration (EIA) just reported that, thanks to the revitalized shale revolution, the U.S. produced over 10 million barrels of oil per day in November, the first time it’s done so since 1970. This puts the country on a path to catch up with and possibly exceed Russia, which produced an average 11 million barrels a day in 2017, and world leader Saudi Arabia, whose energy behemoth Saudi Aramco produces around 12.5 million barrels a day.
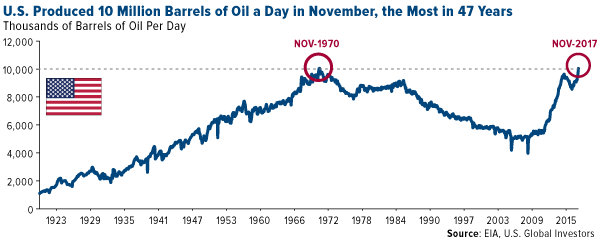
As I’ve written many times before, the American fracking industry is largely responsible for keeping global oil prices low, which has been a huge windfall to the world economy. In its coverage of the news that U.S. output topped 10 million barrels, the Financial Times put it best, writing that American frackers have “boosted the U.S. economy, creating tens of thousands of jobs, bolstered its energy security, created new international relationships and given Washington new freedom to use sanctions as a tool for strategic influence.”
But shouldn’t all this extra supply halt the oil rally and put a damper on producer and explorer stocks? Not so fast.
Companies Just as Profitable with $65 Oil as They Were with $100 Oil
In the years since oil prices cratered—and subsequently began to rise—energy companies have become much more efficient and have learned to do more with less. As the Financial Times notes, U.S. frackers are producing what they are today while employing only three quarters of the workforce they had in the days of $100-a-barrel oil. ExxonMobil, the largest American producer, is in expansion mode, with plans to ramp up its shale mining in the Permian Basin to 500,000 barrels a day by 2025.
It’s not just American companies that have grown lean and mean in this climate of lower oil prices. Says the chief financial officer of Royal Dutch Shell: “We are able to do the same for less.”
Europe’s largest producer last week reported that profits tripled in 2017, generating nearly as much cash flow as when oil prices hovered around $100.
According to the Wall Street Journal, the company has “fundamentally revamped the way it designs and executes projects and is working to deliver another $9 billion to $10 billion of savings in the coming years” through restructuring and by paying down loads of debt.
As a result, Shell has rewarded its shareholders well, delivering a dividend yield of nearly 6 percent, among the highest in the entire industry.
These rewards could continue, as Goldman Sachs now sees Brent jumping to $82.50 within the next six months, up from just under $70 today. Hedge funds’ net long position on Brent hit an all-time high of more than 584,000 contracts recently, according to ICE Futures Europe and reported by Bloomberg. WTI net long positions also surged, according to the U.S. Commodity Futures Trading Commission, to nearly 500,000 contracts, the most since 2006.
To learn more about energy and commodities, click here!
Boeing Now the Largest U.S. Industrial Firm by Market Cap
On a final note, Boeing—the world’s largest aircraft manufacturer—hit fresh new highs last week after the company crushed Wall Street expectations, reporting record operating cash flow of $13.4 billion for 2017, up more than a quarter percent from $10.5 billion in 2016. The company now forecasts operating cash flow of $15 billion by the end of 2018.
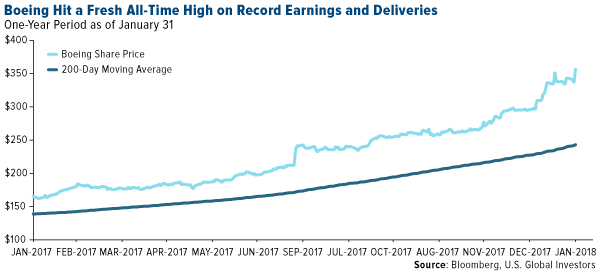
Core earnings per share (EPS) for the fourth quarter came in at $4.80, an incredible 94 percent increase from $2.47 during the same quarter in 2016. In 2017, Boeing delivered a record 763 commercial jets, and its backlog of orders stands at close to 6,000 aircraft, valued at $488 billion.
Boeing was the best performing stock in the Dow Jones Industrial Average last year, a trend that has continued into the new year.
As the Chicago Tribune reports, company stock has “more than doubled since the start of 2017 as Boeing surpassed General Electric to become the largest U.S. industrial company by market value.”
In my view, Boeing’s meteoric success is indicative of the overall health of the airline industry. That the company delivered so many new aircraft in 2017 and logged a high number of new orders suggests international carriers are optimistic about long-term air passenger and cargo demand.
In September, American Airlines CEO Doug Parker told CNBC he was very bullish on the industry’s ability to stay profitable, saying, “I don’t think we’re ever going to lose money again.”
A little skepticism would be forgiven here, but the sheer volume of new airline orders suggests other carriers feel the same way Parker does.
Read more about Boeing here.
*********
All opinions expressed and data provided are subject to change without notice. Some of these opinions may not be appropriate to every investor. By clicking the link(s) above, you will be directed to a third-party website(s). U.S. Global Investors does not endorse all information supplied by this/these website(s) and is not responsible for its/their content.
The S&P GSCI Total Return Index in USD is widely recognized as the leading measure of general commodity price movements and inflation in the world economy. Index is calculated primarily on a world production weighted basis, comprised of the principal physical commodities futures contracts. The S&P 500 Stock Index is a widely recognized capitalization-weighted index of 500 common stock prices in U.S. companies. The Dow Jones Industrial Average is a price-weighted average of 30 blue chip stocks that are generally leaders in their industry.
There is no guarantee that the issuers of any securities will declare dividends in the future or that, if declared, will remain at current levels or increase over time.
Holdings may change daily. Holdings are reported as of the most recent quarter-end. The following securities mentioned in the article were held by one or more accounts managed by U.S. Global Investors as of 12/31/2017: Exxon Mobil Corp., Royal Dutch Shell PLC, The Boeing Co., American Airlines Group Inc.
U.S. Global Investors, Inc. is an investment adviser registered with the Securities and Exchange Commission ("SEC"). This does not mean that we are sponsored, recommended, or approved by the SEC, or that our abilities or qualifications in any respect have been passed upon by the SEC or any officer of the SEC.
This commentary should not be considered a solicitation or offering of any investment product.
Certain materials in this commentary may contain dated information. The information provided was current at the time of publication.
 Frank Holmes is the CEO and Chief Investment Officer of U.S. Global Investors. Mr. Holmes purchased a controlling interest in U.S. Global Investors in 1989 and became the firm’s chief investment officer in 1999. Under his guidance, the company’s funds have received numerous awards and honors including more than two dozen Lipper Fund Awards and certificates. In 2006, Mr. Holmes was selected mining fund manager of the year by the Mining Journal. He is also the co-author of “The Goldwatcher: Demystifying Gold Investing.” Mr. Holmes is engaged in a number of international philanthropies. He is a member of the President’s Circle and on the investment committee of the International Crisis Group, which works to resolve conflict around the world. He is also an advisor to the William J. Clinton Foundation on sustainable development in countries with resource-based economies. Mr. Holmes is a native of Toronto and is a graduate of the University of Western Ontario with a bachelor’s degree in economics. He is a former president and chairman of the Toronto Society of the Investment Dealers Association. Mr. Holmes is a much-sought-after keynote speaker at national and international investment conferences. He is also a regular commentator on the financial television networks CNBC, Bloomberg and Fox Business, and has been profiled by Fortune, Barron’s, The Financial Times and other publications. Visit the U.S. Global Investors website at http://www.usfunds.com. You can contact Frank at: [email protected].


