Is 2024 the New 2021 for Gold Price?
 share
share
 share
share
 share
share
 share
share
 share
share
The recent two tops in gold were 9 trading days apart… Just like in 2011, and the similarity doesn’t end there.
Patterns Repeating
The shape of the price moves that preceded the 2011 top, as well as the length of the consolidations, are also similar.
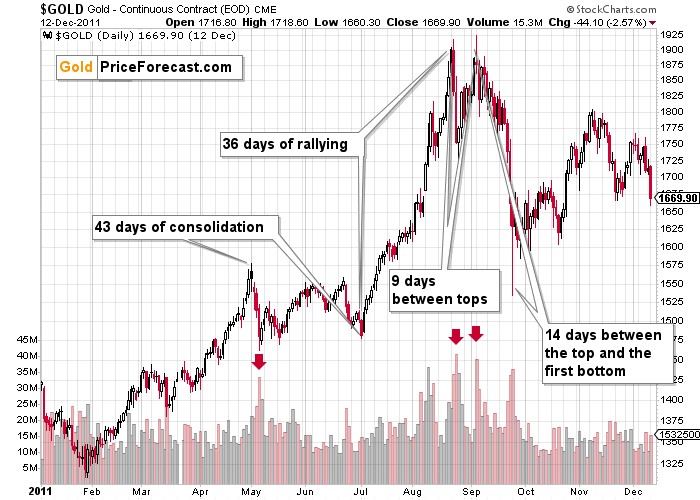
Please note the days that I marked with red arrows based on their huge volume. The first one marked the beginning of the consolidation that lasted 43 trading days. Gold price then soared and formed the double top with both tops being formed on even very big volume. After that happened, gold started to decline. First, in a back-and-forth manner, but then it accelerated sharply, and ultimately gold price declined by almost $400 in 14 trading days.
Now, please take a look at what we see in gold price now.
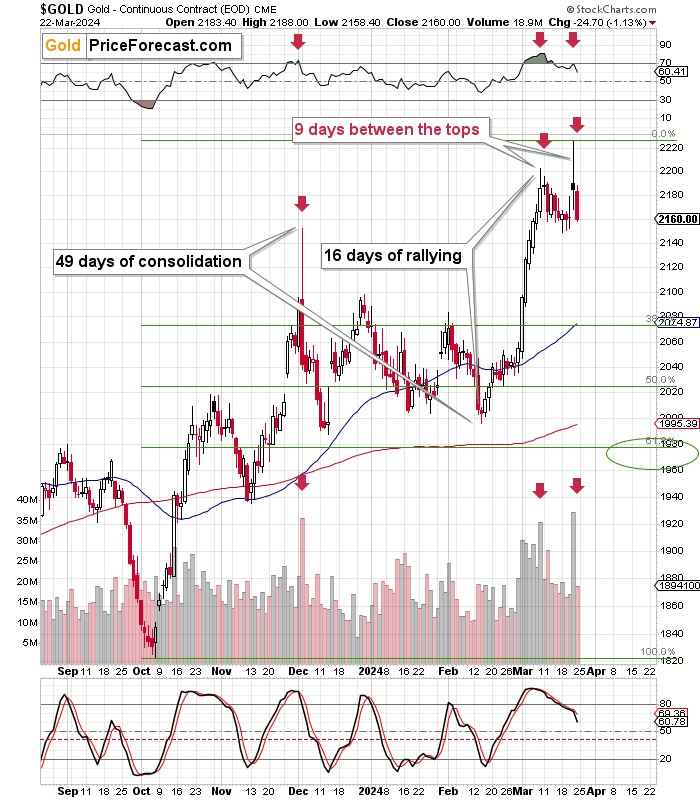
Once again, let’s start with the huge-volume days that I marked with red arrows. The first of those days marks the start of the consolidation. This time, it took 49 trading days, but just like in the 2011 chart, we can see three specific tops that preceded the final bottom. Then gold rallied, and after the sharp rally, it formed a double top, with each of the tops forming in very big volume.
Yes, this time, the rally was quicker and smaller than it was in 2011, but overall, the similarity is still remarkable.
Back in 2011, the follow-up was extremely bearish, so the implications for the current situation are also very bearish.
Now, since gold didn’t rally as much as it did back in 2011, based on this self-similar pattern, it might not decline as much as it did back then. Relative approach appears to be more appropriate. In this case, back in 2011 gold simply gave away the gains from the final upswing. If the same thing happens now, gold is likely to decline to just above $2,000 within the next 1-2 weeks.
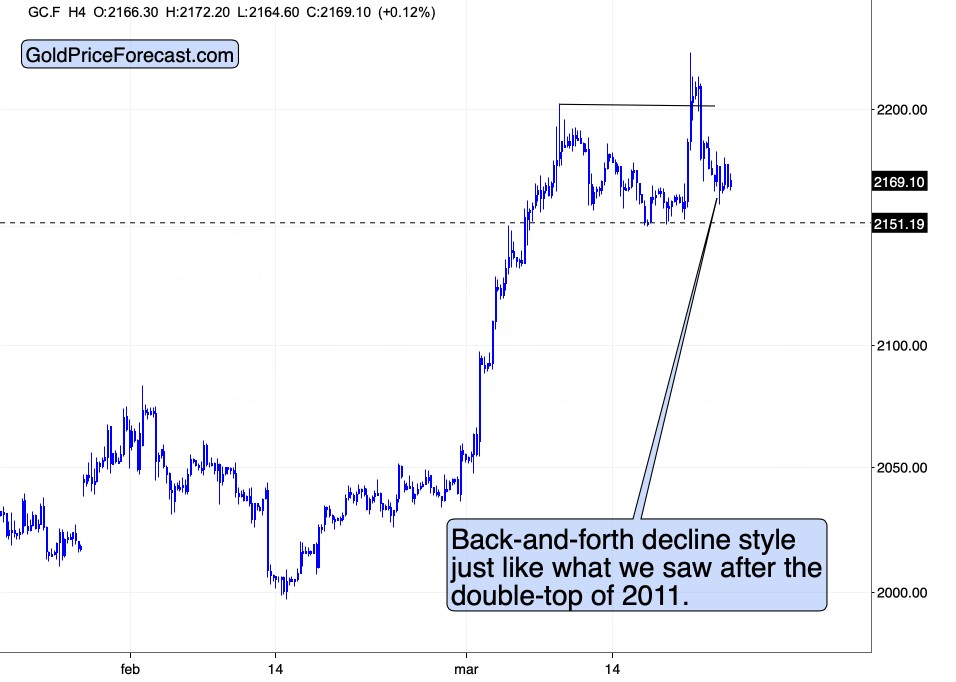
Gold is up in today’s pre-market trading, but not significantly so. This is in perfect tune with the post-double-top 2011 price action – the local moves back up were normal, and they didn’t prevent gold from declining.
The interesting thing is that the current sentiment appears to be very similar to what we had in 2011. I’m not sure if you remember this, but back then it was impossible to convince people that gold was about to move lower. In fact, back then at the top, I also thought that gold would move even higher after this “brief pause” – because that’s the double-top pattern seemed like at that time.
Gold price was in uncharted waters, there was no clear analogy to anything like that. This time, we DO have this kind of analogy. One could choose to ignore it and follow the sentiment, the “this time is different, gold and stocks can’t fall” narrative, or one can look at how similar the situation were and analyze other facts with cold logic.
How logical is it to have gold breaking new highs with such a poor performance in gold stocks?
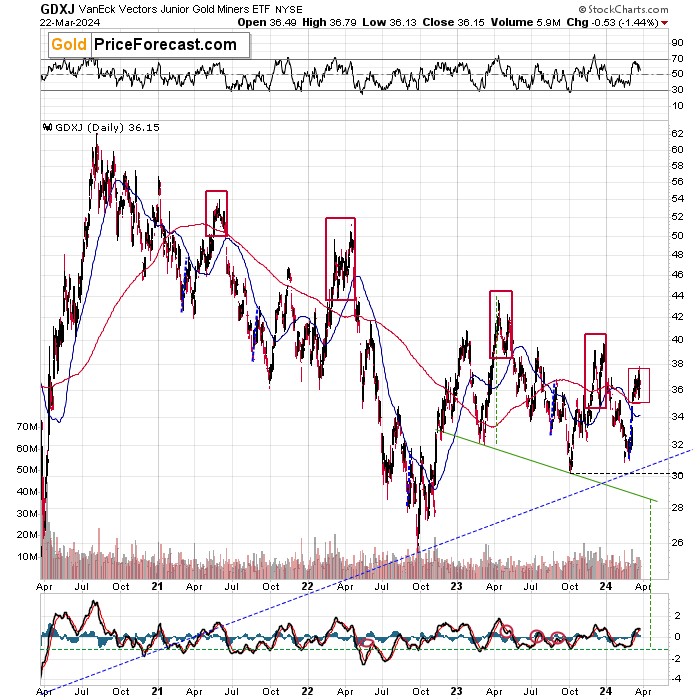
I don’t even mean the fact that miners and silver are nowhere close to their nominal 2011 highs (because, in real terms, not even gold is above its 2011 high). I mean that despite gold’s move to a new all-time high, mining stocks failed to even more above their previous yearly high.
No. They were too weak even for that. Gold miners – that are supposed to be particularly strong in the first part of the big rally - remains in a steady medium-term downtrend.
And the very short-term corrective upswing in them appears to be over.
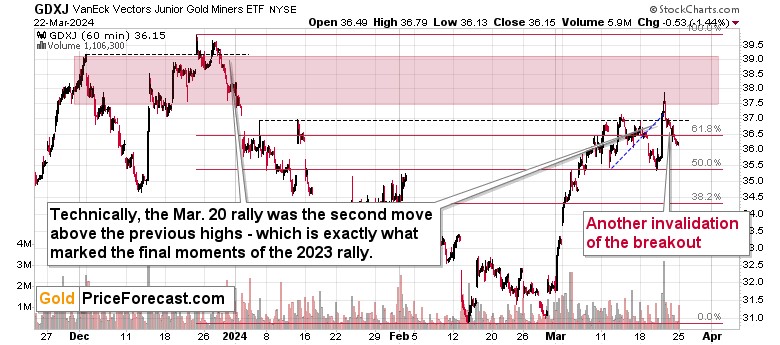
After moving above their previous (January) highs for the second time, the junior mining stocks declined, invalidating this move. When we saw the same thing in late 2023, that was the final top.
Technical Reversals
Moving back to gold, please note that it formed a major reversal last week, ending the week $1.50 (little, but still) lower.
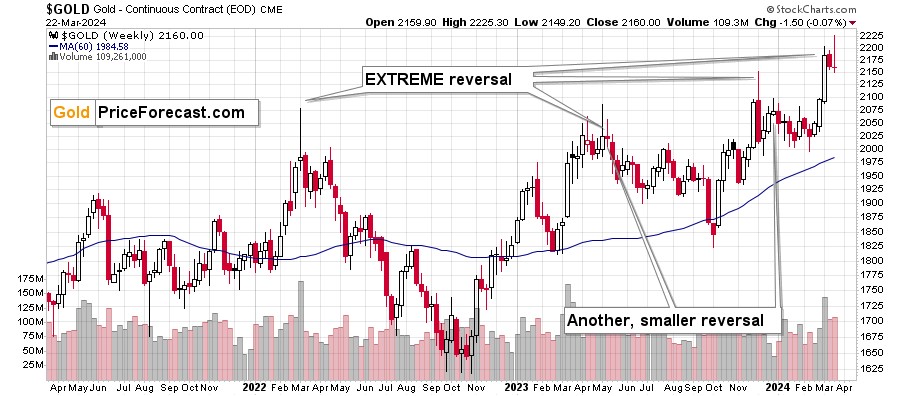
The GDXJ was down by 1.61% and silver was down by 2.12%. The reversal that we saw in gold – on its own – suggest that gold is about to turn south; and that comes on top of multiple other indications that I discussed on Friday and earlier today.
The indications from gold and from gold stocks confirm each other, and the outlook for gold doesn’t look pretty. This creates a great opportunity for those who position themselves to benefit from the likely price moves instead of being hurt by them. It’s difficult to just do what the charts are very strongly suggesting instead of following the sentiment. But those who can do it, will likely prevail in a very profitable way.
*********
share
share
share
share
share
 Przemyslaw Radomski, CFA, is the founder, owner and the main editor of SunshineProfits.com. You can reach Przemyslaw at: http://www.sunshineprofits.com/help/contact-us/.


