Barron's Confidence Index & Credit Spreads Bond Market Bull and Bear Markets what Caused our Credit Crisis
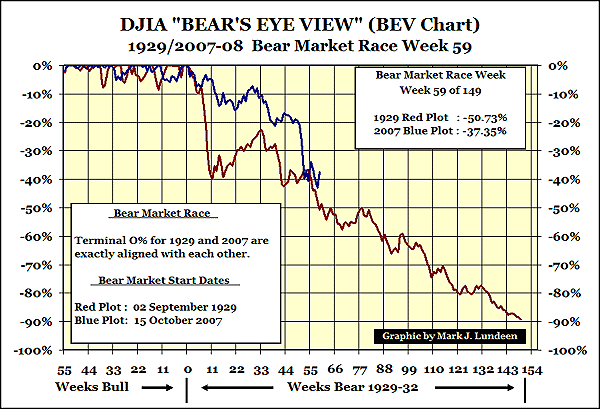
The weekly closing price BEV (Bear's Eye View) results for week 58 in the Dow Jones' 1929 & 2007 bear market's race to the Bottom are as follows:
1929-32: -50.73% from its all time weekly closing high price of 380.33
2007-08: -37.35% from its all time weekly closing high price of 14,093.08
As I have noted before, having the DJIA falling below -40% levels was a bullish signal from 1885 to 1974, except one time, the 1929-32 DJIA -40% bear market. The 2008 DJIA is pulling back from the abyss; it might be time to jump onboard a new bull market. But personally, I think this bear is going to stick around for a while. At the first signs of weakness I would step aside. This week's focus is on the Barron's Confidence Index, or CI. And the CI is tells us that the bond market doesn't like the prospects for the DJIA.
Below is my volatility chart comparing 2007's 200-day moving average closing price volatility with 1929 bear market volatility.
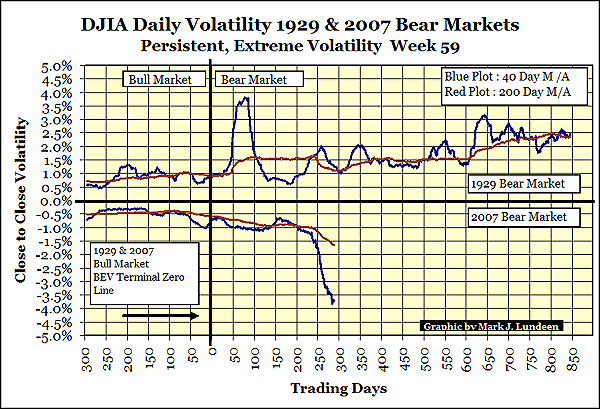
Note: 2007 values are actually positive. They were inverted so 1929 would fit on top and 2007 on the bottom. So for 2007, please forget the negative valuations and focus on the percentages.
1929, Wk 57 200 Day Moving Average Volatility: 1.12%
2007, Wk 57 200 Day Moving Average Volatility : 1.65 %
This week the DJIA volatility's 40 Day M/A backed off from 3.83% to 3.69%. But I think it is important to note that only one day (Tuesday @ 0.43%) was within the historically normal 0.00% to 1.00% range. The DJIA volatility's 200 Day M/A moved up from 1.63 to 1.65. This market is still taking its marching orders from Persistent Extreme Volatility or PEV.
(Remember, with the 2007 data up is down and down is up!)
Historically, daily 1.00% swings from the pervious day's closing price in the DJIA, while not uncommon, should not occur on an almost daily basis. The stock market is running a fever with its "Persistent, Extreme Volatility."

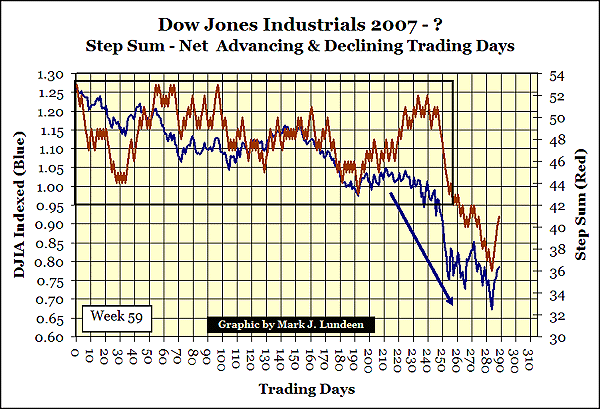
The DJIA is having a nice little bounce off of its bottom. But note how the Step Sum is also rising; that's good. So the bullish correction may still have a ways to go. Bullish corrections are to be expected during a bear market. But there is always that last bear market correction that proves to be the start of a new bull market.
Is that what we are seeing? It will be if the "policy makers" have they way with the stock market. They have lots of ammo aimed at this bear. For those who dare to take a bearish position in the financial markets, don't be surprised if you see a bazooka blast pointed in your general direction. After listening to what Paulson and Bernanke have said before cameras, the "policy makers" have made it very clear that they want the markets to go up even if they have to make it goose-step to get there.
The Step Sum is an indicator of market sentiment. When the underlying sentiment is bullish the Step Sum will rise. When bearish it falls.
Think of the "Step Sum" as the sum total of all the up and down "steps" in a data series as prices change over time. An Advance - Decline Line for a data series derived from the data series itself. Logically, to have more up days than down days during a bull market makes sense as does having more down days than up days during a bear market. Understanding the Step Sum is no harder than that.
Barron's Confidence Index & Credit Spreads
Or as per Barron's
"Confidence Index's High grade index (bond yield) divided by intermediate grade index; decline in latter vs former generally indicates rising confidence, pointing to higher stocks."
Since January 1939, Barron's has published its "Barron's Confidence Index" or (CI).
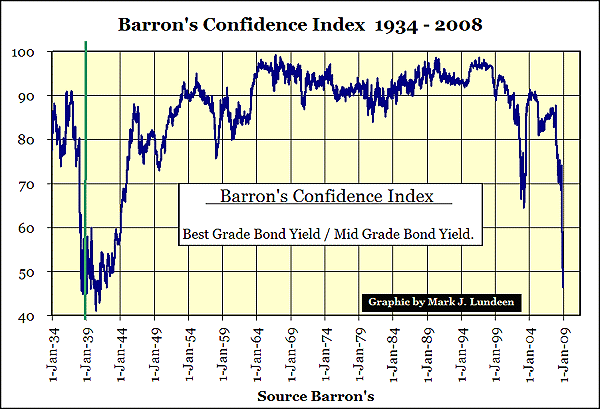
Note the vertical green line to the left. Barron's first published value of the CI was in their 26 December, 1938 issue. However, as Barron's had published a bond table since January 1934, and since the CI is based upon bond yields, I've reconstructed the CI from 1934-38. The green line divides my reconstruction and Barron's actual published CI data. My reconstruction worked to my satisfaction but I admit it is only my reconstruction. But note how the CI reconstruction fell during the 1937-38 DJIA -40% bear market.
So what is the CI actually measuring?
Default risks of a significant proportion of Corporate America.
That is a nice thing to know.
High CI (slight bond market concern of default risk) - Low CI (high bond market concern of default risk of indebted companies whose stocks trade in the stock market.) Companies with downgraded bond rating are companies that will have problems with future earnings and profits. That why the CI is an indicator of stock market trends but strangely it is a very poor indicator of bond market trends.
The bond market saw a huge bear market from 1947 to 1981, but the CI took little note of that. Bond bear markets are noted by an increase in bond yields. But from 1947 to 1981 the yield spreads between Barron's Best and Medium Grade Bond Yields stayed very close to each other. Remember, the CI only indicates the bond market's concerns that less than top grade bond issuers will have future difficulties making interest and principle payments. How bonds themselves perform as an investment is not something the CI reacts to.
The CI from 1947 to 1981 indicated that middle grade bond issuers repaid debt from the 1950s & 60s with post Bretton Woods 1970s & 80s devalued dollars with ease. But bond holders were devastated as we can see in the chart below.
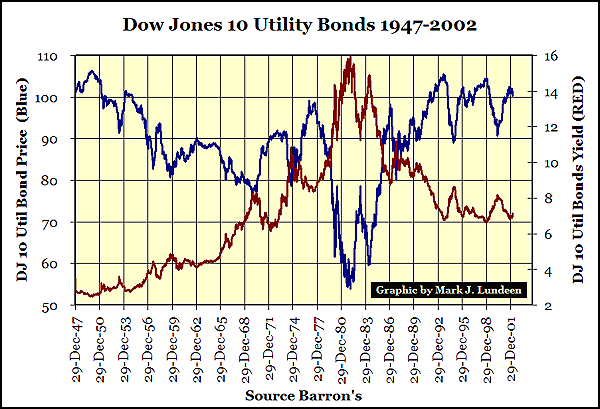
Above is a chart for both price and yields of the now discontinued Dow Jones 10 Utility Bond Average. Why Dow Jones would discontinue an economic series that dated back to 1947 is a mystery to me. But this old DJ bond series is an excellent example of what rising, and falling interest rates do to bond holders. It is important to understand that in 1992 when the DJ-10 Utility Bond Average returned to its 1949 highs, the US dollar had lost substantial purchasing power during those four decades. After income taxes and inflation, the pre 1981 holders of these bonds saw massive losses. But to those who had the courage to buy these bonds in 1981, they saw good capital gains while being paid a 16% return on utility bonds. As with any investment, timing is everything.
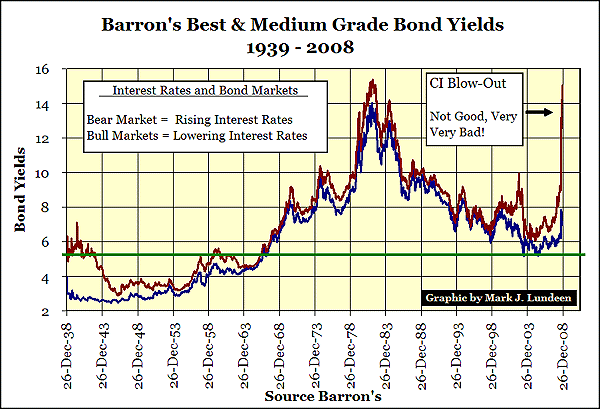
Above we see the actual yields used in constructing the Barron's Confidence Index from 1939 to November 2008. The CI is derived by dividing the blue plot by the red plot. Barron's in its Weekly Bond Statistics publishes both the CI and the bond yields from which it's derived from. To get a full picture of the corporate bond market, we really need to chart the CI and its source yields. As we can see above, interest rate expectations of what Best grade and Medium grade bond yield have changed significantly in the last 70 years. Today's Best grade bonds now yield what speculative Medium grade bonds did in 1938, while current Medium grade yields are at almost record highs. It's hard not to believe that the corporative bond market is in turmoil as money managers flee to the Treasury market.
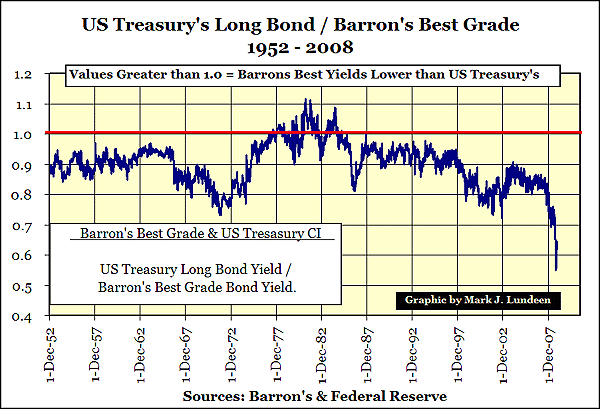
Here is an interesting fact of bond market history. From 1977 to 1982, bond buyers were fleeing US Treasuries for the safety of the Barron's Best Grade Bonds! How things have changed. In 2008 we see that the Barron's Best Grade Bond Yield is about double that of Long US Treasury Bond. Since 1952 this spread has never been this wide. Also the drop is coincidental with the start of the mortgage mess in August of 2007. Could this be a bazooka blast aimed at holders of corporate bonds? Well I don't know anything about that. But I do know that adjustable rate mortgages are based upon US Treasury Yields, not top grade corporate bonds. So maybe we are seeing the bond market "goose-stepping" to the fife and drum of "policy."
A little history on corporate bond yields would be in order here. The post World War Two era's rising interest rates was not due to a credit expansion over-heating the economy and raising asset prices. From 1947 to 1981 excess Federal Reserve liquidity (inflationary dollars) flowed into goods and services. The effect of that expansion of money supply produced what people today commonly think of as "inflation."
The dollar was dropping in value. So bond buyers demanded higher yields from all bonds to compensate for inflation risks. I noted in Wk 58's Bear Market Report that the US Treasury had to offer a 15.75% coupon in 1981! By September 1981, there we no US bonds with single digit current yields.
During good times, the financial leverage that debt delivers is seen as a positive business strategy. Increases in debt means the company is expanding production facilities to meet anticipated, future demands of its products. That is not a bad thing. If the economy was always vibrant as it was in the 1990s, heavily indebted companies would never have problems servicing their debts. For this reason, the CI drifts up to the 100 line as the general outlook of the market sees only blue skies and sunny days in the years to come.
But as we have all learnt since 2000, the economy is not always blue skies and sunny days. As night follows day, difficult economic conditions do arrive. As the economy contracts, many companies discover that the debt assumed during the boom times prove to be a burden. The increase in production capacity, financed by bond debt, is ultimately unprofitable as the new demand was artificial and short lived. But the bond payments are real and will exist until these ill-conceived bonds mature many years in the future.
This is to be expected in any economy which sets interest
rates lower than the rate of its monetary expansion!
There is "policy" at work here. The "policy" directed "liquidity injections" is seen by business as an increase in demand for its products. Credit funded spending by consumers bring a brisk trade for goods and services. When business sees a positive spread between increased inflationary demand for their goods and services and interest rates set to low by "policy," it's is entirely logical that many companies will expand production to fill this pseudo-demand with an increased debt loading via the bond market. The demand is only a temporary monetary event, but the bonds assumed in response to the pseudo-demand will be a burden on earnings for years to come.
We are all now suffering the aftermath of having academics like Alan Greenspan and Ben Bernanke controlling our money supply and interest rates.
Here is the "monetary policy" of Greenspan and Bernanke:
- Increase money supply significantly (Total Fed Credit).
- Reduce interest rates below the rate of money creation.
- Encourage society to become indebted beyond its means in everyway it can.
But in 2008, things are different as they are now much worse. With the recent extreme moves in the CI, the addictive behavior of our present financial system is on full display. Step by step, "policy" has traveled the path of debt addition to its logical terminal point. Once "policy" was concerned with "economic growth." In 2008 it has degenerated into the choice between either saving the US dollar or avoiding debt withdrawal by ever greater "liquidity injections." Our "policy makers" have chosen the addicts solution to their problem. Look at the signs of the times:
- Total Fed Credit is increased by over 100% in less than a year.
- Interest rates pounded into the ground,
- "Policy makers" at every opportunity, urge financially troubled banks and customers to resume their former destructive lending and consumptive patterns.
Almost daily we see credit junkies in the media applauding the actions taken by the "monetary policy makers?" All too many influential people think that by warming up the corpse of the mortgage market, "policy" can bring life to sub-prime assets again. This is addictive reasoning.
Considering the above, I think it is safe to say that the dollar is going to be sacrificed, but I don't know when the dollar will break. Our New president brings me no comfort with his selections for key "monetary" and "fiscal policy" positions.
Note that Barron's CI made excellent and extreme calls on the stock market. Its latest calls have been real trumpet blasts!
- 2000-03 down turn
- 2003-07 up turn
- 2007-08 down turn
No indicator is 100% accurate, and the CI frequently has a long lead time. But a DJIA BEV plot from 1934 to present charted with the CI, shows us that the CI (your grand-father's market indicator) has frequently captured the stock market's boom and bust cycles for the past seven decades.
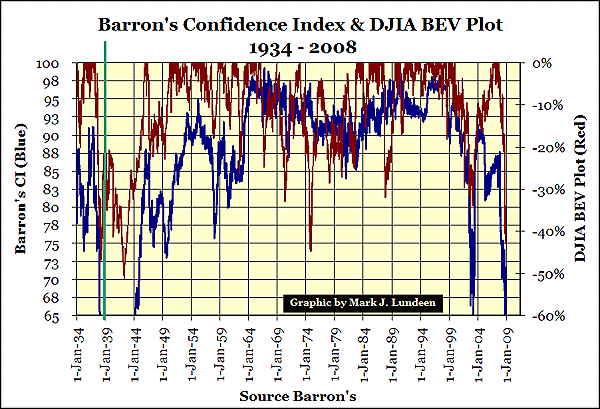
Note that from 1964 to 1981, the CI was on a down trend. It was during this time that the DJIA tried to break and stay above the 1,000 level, but just couldn't do it. When the CI bottomed in December 1980 it gave an early signal of the huge bull market from 1982 to 2000. It called the DJIA mania in 1994, and in 1998 when it broke down from a multi-year pattern, it signaled the 2000-03 bear market. There is much more to see in the chart above.
The CI provides us with the means of gauging the bond market concern, or lack of concern of the future profitability of a significant proportion of companies whose shares trade in the stock market. The CI is an early indicator too, not infrequently a year or two ahead of the stock market. So when the CI changes a multi year pattern, almost always something fundamental has changed in the financial markets that could impact the stock market.
I want to see the CI rise up, and Barron's Medium Grade Bonds Yields fall significantly before I reversed my bearish out look on the DJIA. To see the CI rise up because the Best Grade Bond's Yields rise up is not bullish! Currently the 2007/08 DJIA -40% bear market is #6 on the list. I still think that it will finish at the #2 or #3 spot before this is all over.
For over seventy years, it has been worthwhile keeping track of Barron's Confidence Index. What the bond market thinks of the stock market's future profits prospects are is important. And right now the bond market believes all DJIA rallies are bear market rallies. I think that's good advice to heed.
Mark J Lundeen
28 November 2008
Dow Jones -40% Declines From 1885 to 2008 is the article that inspired this race of 1929 & 2007 Bear Markets. You may want to read that article to understand my "BEV Chart."
Dow Jones Industrials Average Market Volatility is the source for my volatility studies.
The Lundeen Bear Box and Step Sum is the source for my Lundeen Bear Box and Step Sum Chart
Note For the Record: Mark Lundeen does not want a devastating bear market in the next two years. However, in full view of Congressional Market Oversight Committees and under the supervision of Government Regulatory Agencies, things were done that I believe will make a historic bear market inevitable. If you have a problem with this bear market, contact Washington, not Mark Lundeen.


