Bear Market Forecast Via 7 Compelling Charts


 Among the seven convincing charts broadcasting a fourth-coming BEAR MARKET IN STOCKS, the most compelling are the first two here dealing with Stock Prices Regression to the Mean Value from 1870 to now.
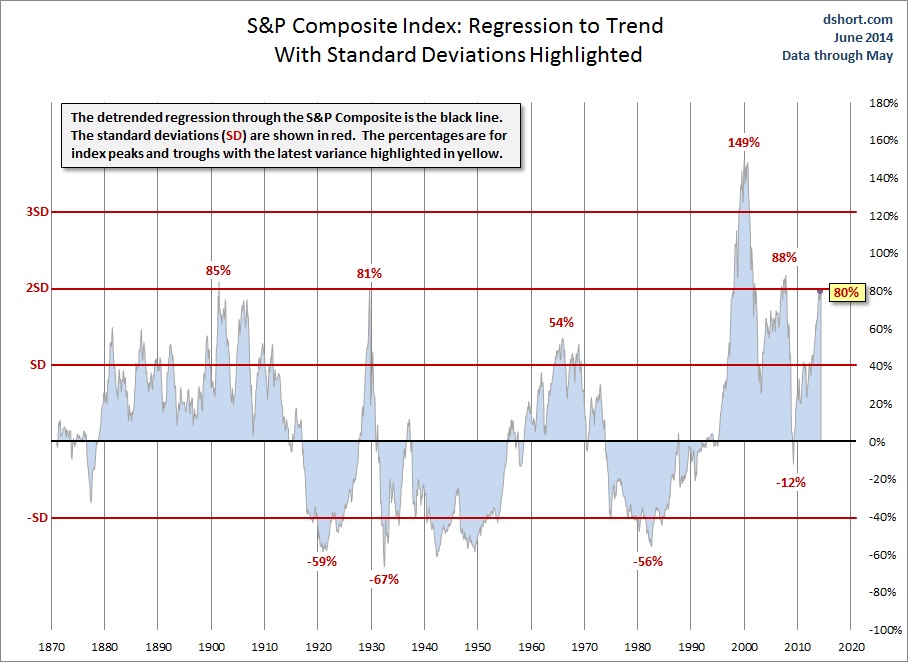
Presently the Stock Prices Regression to the Mean is at the 1929 Euphoric Exuberance level. It is imperative to notice S&P500 Regression to the Trend Mean peaked in 1901, 1929, 1966 and 2000. To be sure each peak was followed by material stock market corrections.

Source:
Here is yet another way to view the Stock Prices Regression to the Mean Value. Notice that each time Standard Deviations reached 80%, a severe stock market correction materialized.
Source:
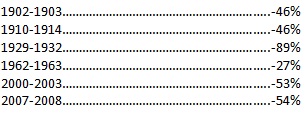
The two above charts clearly demonstrate the 6 peak periods of maximum Standard Deviation from the Mean were subsequently followed by Bear Market Corrections. Here are the results:
Bear Market Period After Peak………….Subsequent % Correction
ALERT: The two above charts now show the Standard Deviation from the Mean has again reached the critical level of 80% above the mean. Consequently, it is logical to conclude a major stock market correction is brewing on the horizon.
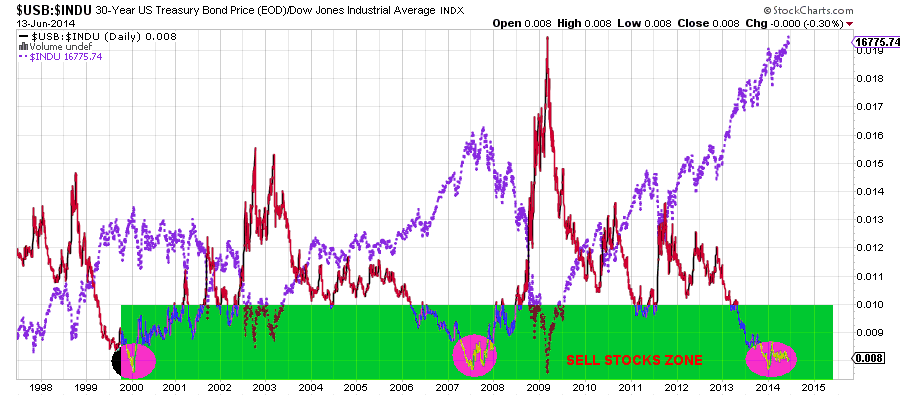
US T-Bonds/Dow Ratio
Another financial “barometric” chart indicating a Bear Market in Stocks is forming. This is the tell-tale trend of US T-Bonds/Dow Ratio. The logic behind this indicator is the following. When a bull market in stocks becomes euphoric, investors blindly and irrationally pile into stocks, and tend to reduce their investments in US Treasuries. Hence the US T-Bonds/Dow Ratio trends lower and lower. However, when irrational investors become too greedy, stocks are bid to delusional, unsustainable levels. This is exactly what happened in 2000 and 2007, which caused the US T-Bonds/Dow Ratio to fall to the bottom of the chart (see pink circle marking the bottoms). Needless to say, both periods pin-pointed when the Dow Index topped out.
FAST-FORWARD to 2014 to see the US T-Bonds/Dow Ratio has again bottomed, thus announcing stocks are topping out – and preparing to correct. Please note the Dow Index is super-imposed on the graph.
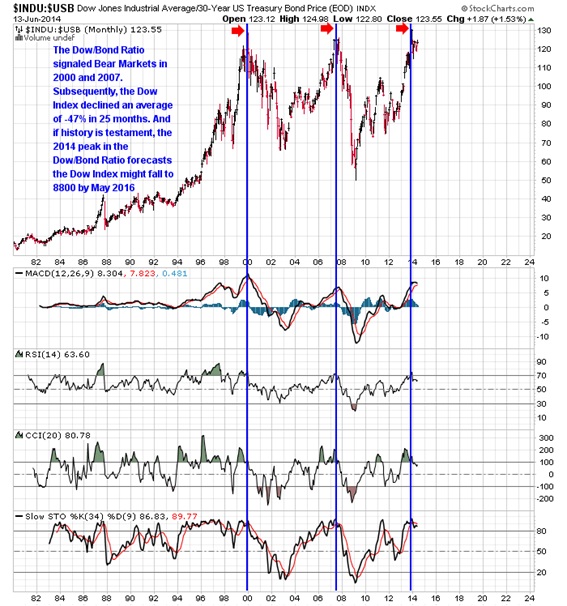
Perhaps another more clear way to visually appreciate that stocks are topping out is to view a chart of the Dow/US T-Bond Ratio. Please see a very bearish Triple Top:
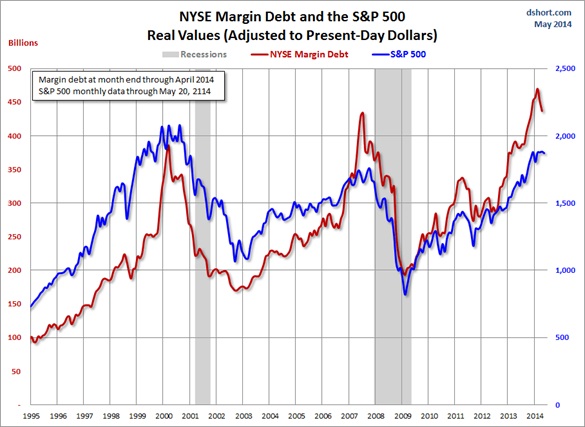
NYSE Margin Debt At An All-Time Record High
Another infallible indicator showing stocks are grossly over-valued and may be approaching a market dangerously topping out is NYSE Margin Debt. Actually the NYSE Margin Debt is one of the principal causes why stock ultimately must face egregious correction.
Observe how the NYSE Margin Debt peaked in 2000 and 2007, when the S&P500 peaked and subsequently suffered horrific losses (-53% and -54%). The theory behind this phenomenon is simple. After stocks have risen for years on end, investors throw caution to the wind and buy stocks on ever increasing margins. Eventually and inevitably all liquidity dries up, and there is practically no new money available to bid prices higher…ERGO, SMART INVESTORS BEGIN TO TAKE PROFITS…and the market prices reverse sharply downward. Eventually and inevitably the bear market feeds on itself as imprudent investors dump stocks and flee to safe havens (ie cash, bonds and or gold).
Here is the NYSE Margin Debt At An All-Time Record High with the S&P500 Index super-imposed:
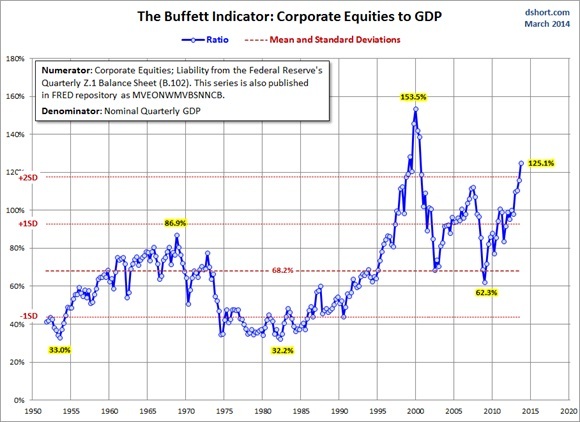
Warren Buffett’s Favorite Evaluation Metric: Total Market Value/GNP
The richest man in the world, billionaire Buffett has oft repeated that one of his most trusted metrics to determine relative valuation is Total Market Value/GNP…to wit: Are stocks over-valued or under-valued?
The Total Market Value/GNP chart below shows peaking in 1966, 1972, 2000 and 2007. Each peaking heralded the beginning of a bear market correction in stocks. And it is vitally important to notice the Total Market Value/GNP has just recently forged the second highest peak since 1950.
Now we know why Buffett’s flagship company (Berkshire Hathaway) has been going to cash. His company has the highest cash level ($40 Billion) since 2007 (just before the stocks crashed). Surely Buffett knows!
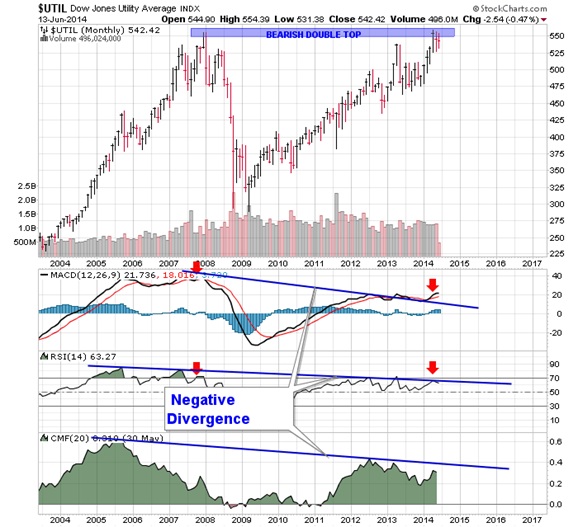
Dow Utilities Are Often A Leading Indicator To Stocks
Historically, the Utilities Index has often been a leading Indicator to the general stock market. And clearly Utilities are giving bearish signals, including Negative Divergence (ie Declining Momentum) in three Technical Indicators (MACD, RSI and CMF) -- as well as a Bearish Double Top:
Surely all 7 of the above Bearish Barometers will NOT go unnoticed by institutional investors (like large Mutual Funds, Pension Programs and Bank Trust Depts).
Without question today’s stocks exhibit extremely exaggerated valuations…bordering on irrational exuberance. History is testament exorbitant over-valuations never last, as markets truly abhor them. Make no mistake, a major stocks’ selloff correction looms.
********
Related Analysis:
Ominous Signs For Stocks Forecast Lower Prices
"The study of history, while it does not endow with prophecy, may indicate lines of probability."


