The Biggest Opportunity Since 2015…And The Last Chance At These Gold And Silver Prices
 share
share
 share
share
 share
share
 share
share
 share
share
We’ve had to wait 18 months for an opportunity as big as the one we saw late in 2015 to appear again in the Precious Metals sector. “Wait a minute”, I hear you say, “prices were generally lower back then at that low than they are now, so how can it be as big an opportunity, as leverage is reduced?” Here are the reasons, one technical, the other fundamental. When prices rose out of the late 2015 low, which was the Head of the Head-and-Shoulders bottom shown to advantage on the 10-year chart for GDX below, they were destined to retrace to mark out the Right Shoulder of the pattern, which is what now has most investors very negative towards the sector again. This time they don’t have to – they can now rise out of this trough and proceed to break out upside from the entire pattern to embark on a mighty bull market. The fundamental reason is this – most investors have been taken in by the specious Central Bank talk about “normalizing interest rates” and scaling back their bloated balance sheets – but they haven’t got a cat in hell’s chance of doing this – why? – because debt (and associated derivatives) has expanded to such gargantuan levels, that any attempt to bring it under control will send interest rates skyrocketing. Because of this stark reality, they are left with only one option – to inflate the debt away by monetizing it, which means inflation. Once investors grasp the inevitability of this – and that this process will soon get underway with a vengeance, gold and silver will soar. That is what the charts that we are going to look at today are telling us, and it means that we may never see the bargains in the Precious Metals sector that are now available ever again – or at least not for a very long time.
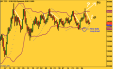
The latest COTs are telling us that gold and silver have hit bottom, or are very close to having done so, and that the time to buy the sector is now. Before proceeding to look at them we will start by looking at the latest 10-year chart for GDX, a reliable PM stocks proxy, to see where we are on the market clock, where we are in the PM stock price cycle.
Our 10-year arithmetic chart for GDX shows a clear large Head-and-Shoulders bottom forming, with the price now in the process of completing the Right Shoulder trough of the pattern. Obviously, most would be investors in this sector either don’t know this pattern exists, or if they are aware of it, have written it off as a false H&S bottom, witness the rotten sentiment towards the sector, which is just what we want to see at this juncture. Indications that the pattern is genuine are provided by the strong volume on the rise out of the trough of the Head of the pattern, which we can expect to see again on the rise out of the Right Shoulder trough soon, and the outstandingly bullish COTs which we will soon look at.

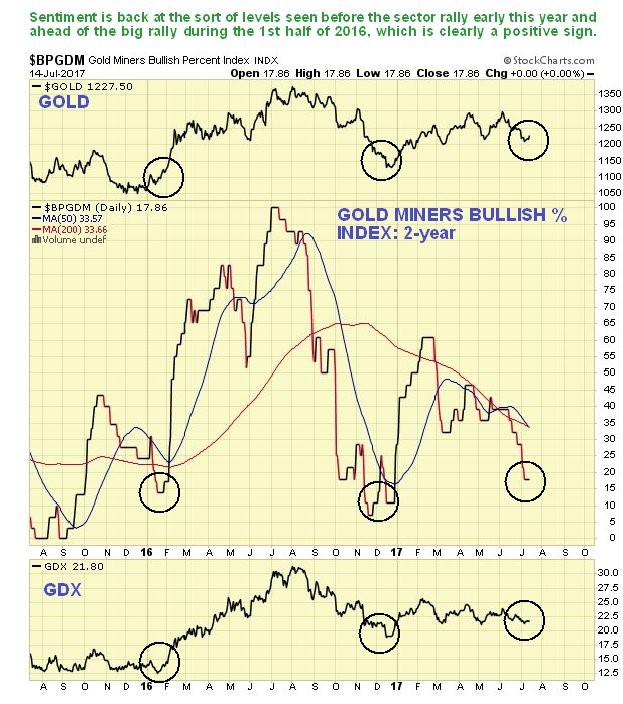
The rotten sentiment towards the PM sector is amply illustrated by the latest Gold Miners Bullish % chart. At just under 18% bullish, it is a little above the levels seen before the sector rally early this year, and at about the same level seen before the big rally during the 1st half of 2016. This clearly points to a sizeable advance by the sector soon.
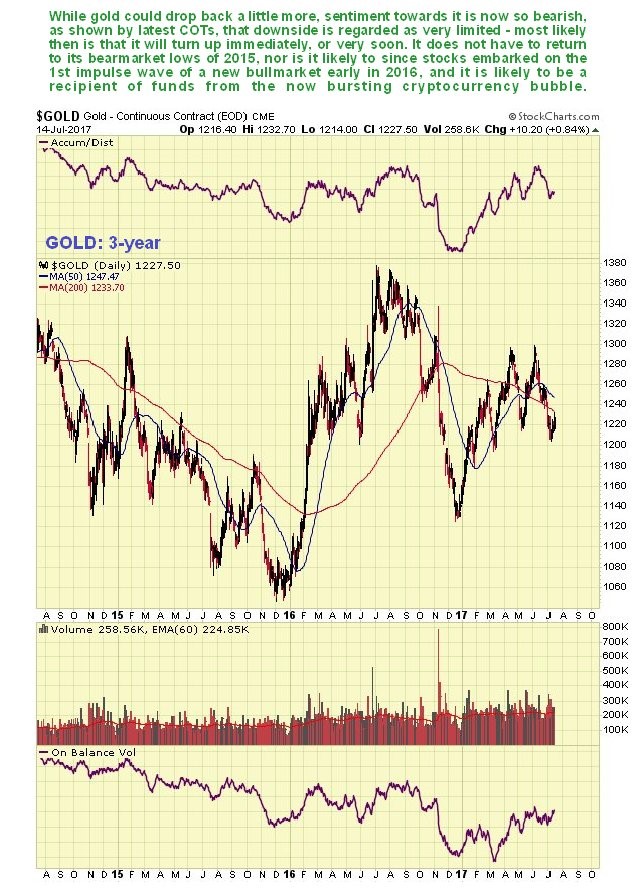
Next we look at a 3-year chart for gold. At first sight this does not look very encouraging as it looks like there is room for gold to fall further to last December’s low, or further down to the December 2015 low, but of course, if gold is marking out a Head-and-Shoulders bottom in the manner of GDX, which it is, as can be seen on its 8-year chart in the last Gold Market update, then we would expect it to turn up from around where it is now. Now we will look at the latest COT to see why it is likely to.
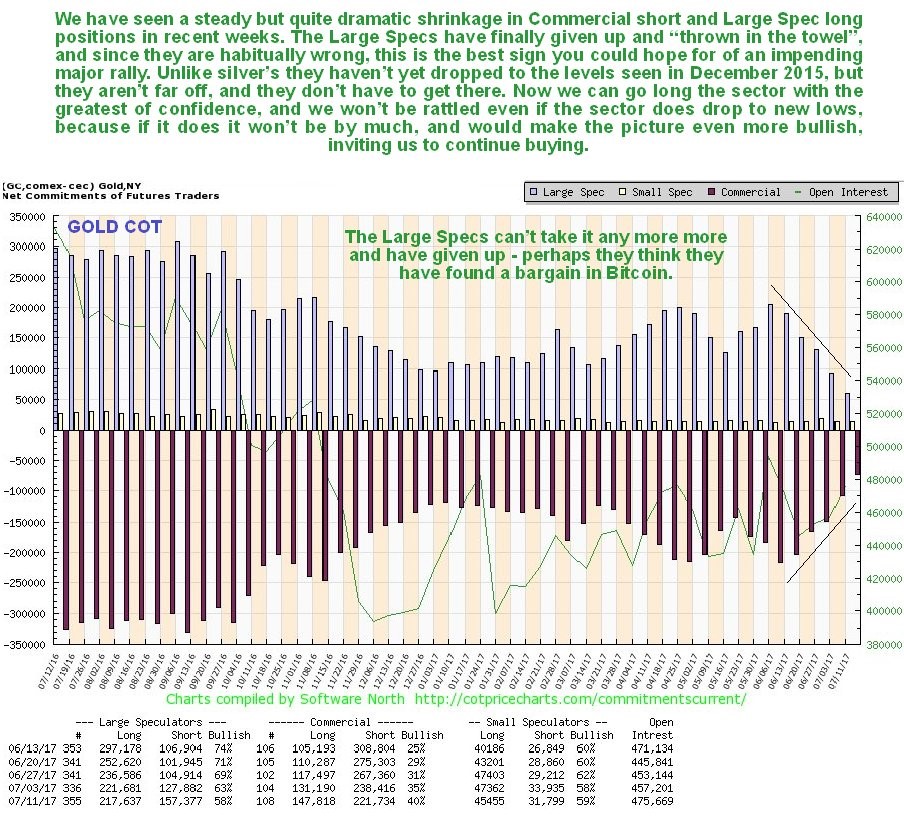
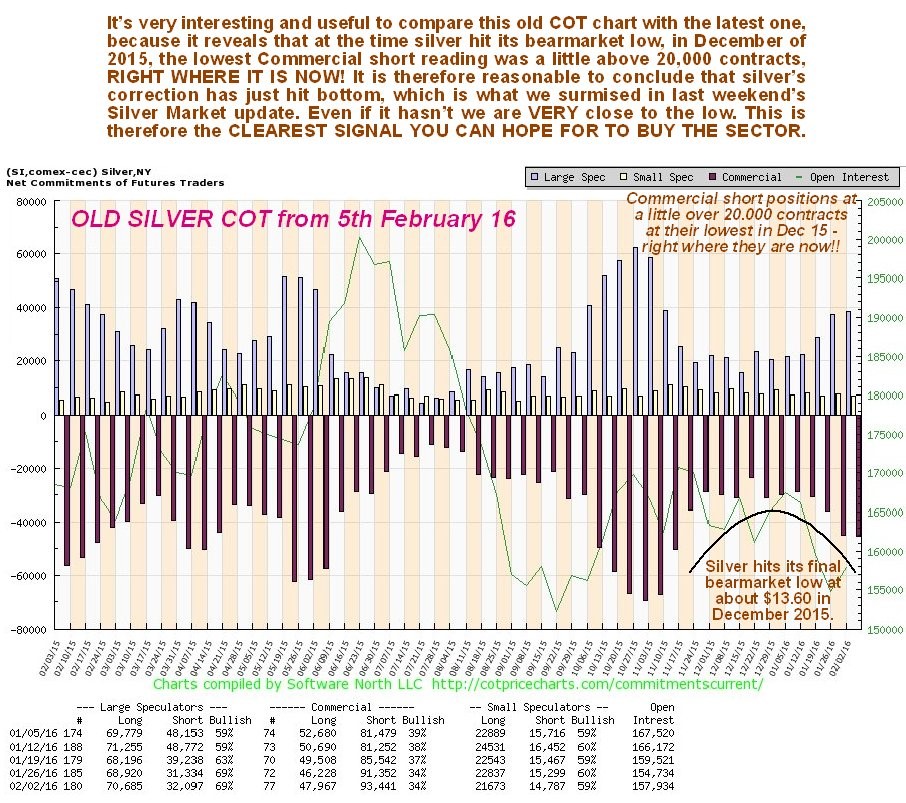
On gold’s latest COT chart we can see how Large Spec long positions have shrunk dramatically over the past 6 weeks to a low level, and since the Large Specs are habitually wrong, this was almost a necessary prerequisite to a strong advance. The question we want to answer is “Have they dropped back enough now to lead to a reversal and the start of a major new uptrend?” The answer to that is yes, they probably have. For one thing, silver’s COT readings have already dropped back to their levels at the low of December 2015, which provides circumstantial evidence that gold’s readings do not need to drop back any further. Secondly, we would not expect gold’s COT readings at the Right Shoulder low to drop back as low as they were at the low of the Head of the pattern, because that was the low for the cycle and the end of the bear market. Current readings are therefore thought to be low enough to synchronize with a reversal.
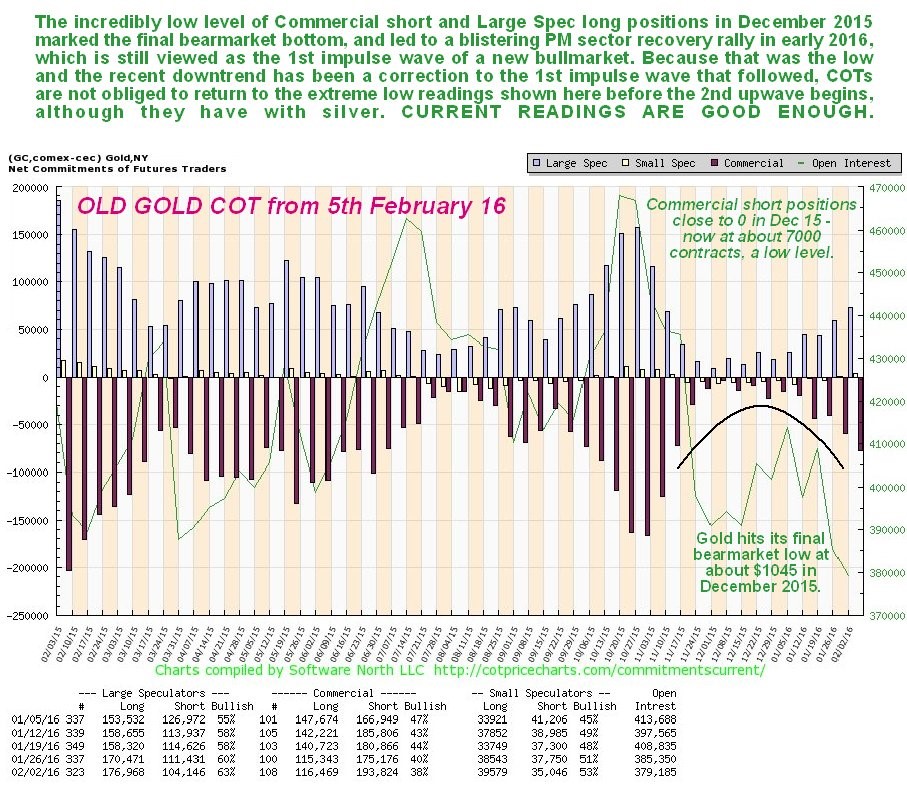
Nevertheless, it is worth looking at the old gold COT chart for the period around the December 2015 low, which shows a rare and remarkable circumstance where Commercial short and Large Spec long positions had dropped back almost to zero – it doesn’t get more bullish than that for gold. While they may not be at zero now, they are getting close, close enough considering where we are in the cycle.
It is worth mentioning the cryptocurrency market briefly, because it has been siphoning off money, some of which might have otherwise been destined for the Precious Metals. This grotesque bubble is blowing apart right now, which should help the Precious Metals, and you may recall that we warned to steer clear of Bitcoin in the article Due to Popular Demand Maund DOES NOT cover Bitcoin posted within a day of its final peak. Frankly, it is hard to understand how anyone could prefer virtual money, which has a tendency to suddenly disappear like a mirage, to real money such as gold and silver.
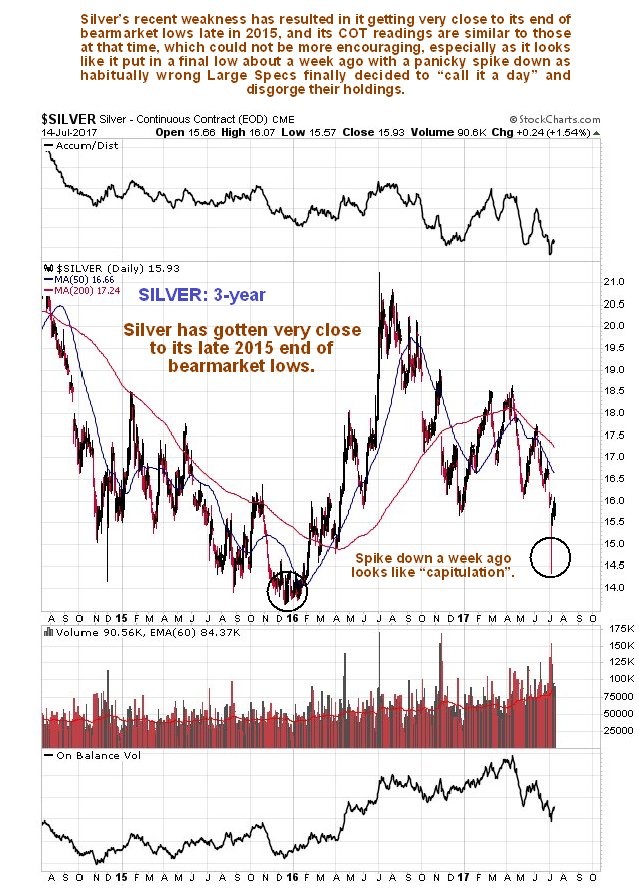
Now we turn to silver, where we will see that despite weaker price action recently, COTs are even more bullish than those for gold. While silver looks considerably weaker than gold, as it has dropped back close to its December 2015 lows, which gold hasn’t (it is still quite some way above them), we should remember that it is normal for silver to underperform gold in the late stages of bea rmarkets and early stages of bull markets. As we observed in the last Silver Market update, the spike down about a week ago on high volume looks like a final “capitulation”.
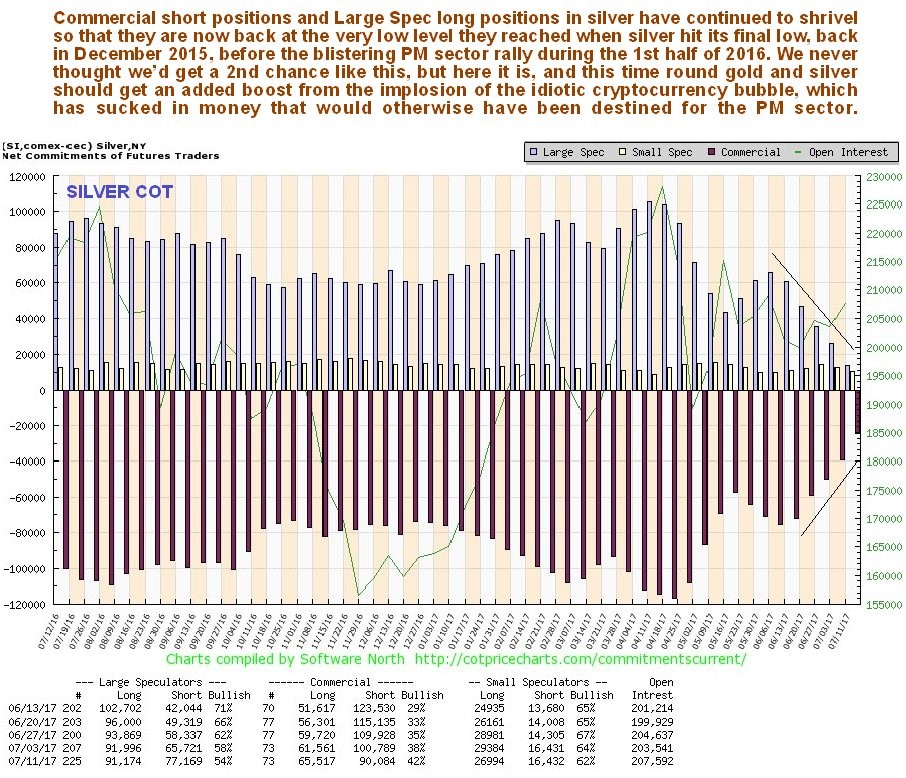
The latest silver COT chart reveals that Commercial short and Large Spec long positions have shrunk steadily in recent weeks back to levels that are now very low indeed. In fact they are at the same levels as in December 15, as you will see by looking at the earlier COT chart stacked beneath the latest one below – and we know what happened after that – there was a blistering PM sector stock rally that saw some stocks make huge percentage gains, like Coeur d’Alene (now named Coeur Mining Inc) which rose more than 8-fold. Of course, we won’t see such big percentage gains this time round, at least not immediately, as we will be coming off a higher base, but we ought to later because the PM stocks sector indices should proceed to break out of the top of their respective Head-and-Shoulders bottom patterns to enter a major bull market growth phase.
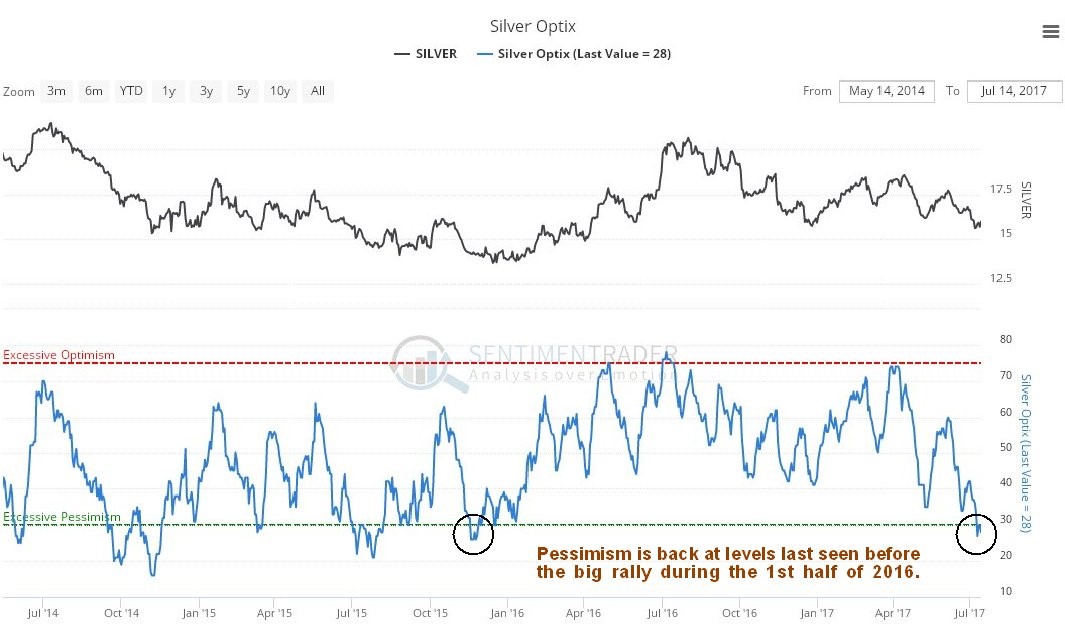
Finally we will take a quick look at the latest Silver Optix, or optimism chart, where we see that investors are at their most pessimistic towards the metal since the bottom of the bearmarket in 2015, just before a big sector rally. This obviously augurs well for the sector since the majority are always wrong.
With this gigantic opportunity staring us in the face, we will obviously be looking at a range of attractive Precious Metals stocks on the site very soon.
********
share
share
share
share
share

Clive P. Maund’s interest in markets started when, as an aimless youth searching for direction in his mid-20’s, he inherited some money. Unfortunately it was not enough to live a utopian lifestyle as a playboy or retire very young. Therefore on the advice of his brother, he bought a load of British Petroleum stock, which promptly went up 20% in the space of a few weeks. Clive sold them at the top…which really fired his imagination. The prospect of being able to buy securities and sell them later at a higher price, and make money for doing little or no work was most attractive – and so the quest began, especially as he had been further stoked up by watching from the sidelines with a mixture of fascination and envy as fortunes were made in the roaring gold and silver bull market of the late 70’s.
Clive furthered his education in Technical Analysis or charting by ordering various good books from the US and by applying what he learned at work on an everyday basis. He also obtained the UK Society of Technical Analysts’ Diploma.
The years following 2005 saw the boom phase of the Gold and Silver bull market, until they peaked in late 2011. While there is ongoing debate about whether that was the final high, it is not believed to be because of the continuing global debasement of fiat currency. The bear market since 2011 is viewed as being very similar to the 2-year reaction in the mid-70’s, which was preceded by a powerful advance and was followed by a gigantic parabolic price ramp. Moreover, Precious Metals should come back into their own when the various asset bubbles elsewhere burst, which looks set to happen anytime soon.
Visit Clive at his website: CliveMaund.com
More from Gold-Eagle