Gold Forecast: Gold Cycles - Key Update


 As mentioned in my last article in mid-July, Gold was looking for a rally to play out into August, before turning south for another low into the mid-to-late September timeframe. From there, a very strong rally is expected to play out, ideally lasting into early next year - before a larger-degree peak forms with most major markets.
Gold's 10-Day Cycle
For the very short-term, the next low is due to form, coming from our 10-day wave, and which is due to form here at anytime. Here again is our 10-day cycle for Gold:
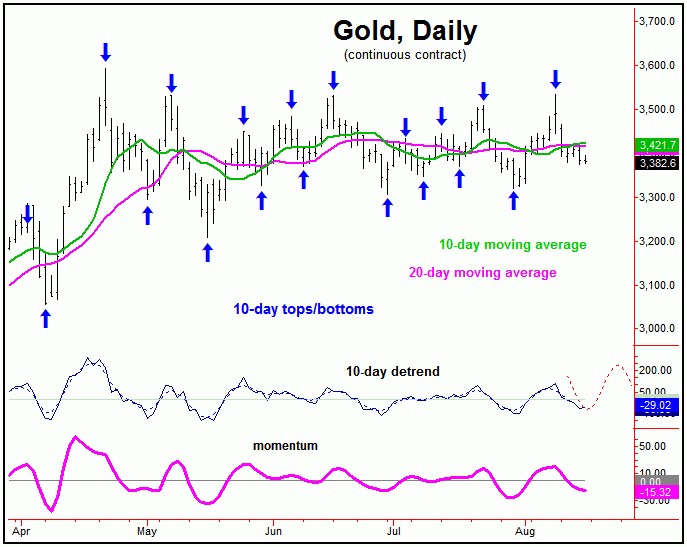
A low with this 10-day wave into the current timeframe - if seen - would favor the next rally phase of this wave to play out into August 20th or later. From there, another turn south would likely play out into August 25th, plus or minus, where another 10-day trough would be due - before turning higher for another upward phase with this wave into the early-September window.
The 34-Day Gold Cycle
Stepping back slightly, the last bottom for our larger 34-day cycle in Gold was made in late-June, with the overall assessment having favored strength into the current month of August - before topping the larger 72-day wave. Here again is that 34-day wave:
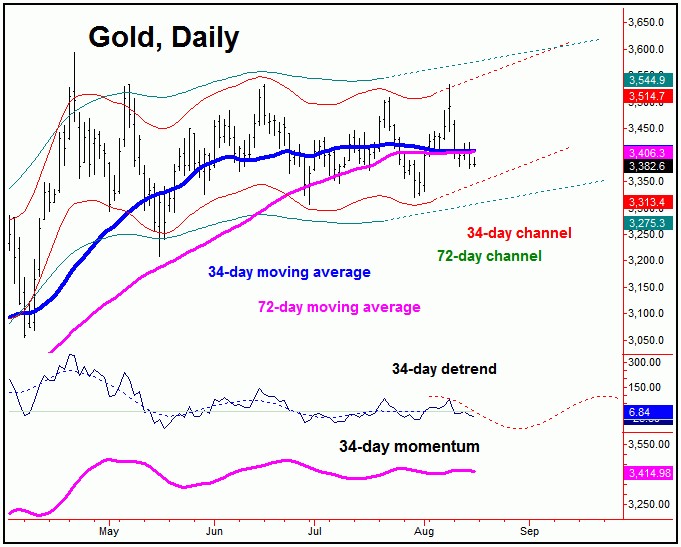
From my 7/13/25 article: "the next good rally phase is expected to come from this 34-day cycle, as well as with the bigger 72-day wave. In terms of time, the ideal path for this rally to play out into looks to be the mid-to-late August window of this year. In terms of price, the average rallies with the 34-day cycle - when coming off the pattern of a 'higher-low' - have been some 9% or more off the bottom. Thus, taking the 3250.20 figure suggests the potential for the metal to push up to the 3540's into August."
As mentioned back in mid-July, the ideal path favored strength with our 34-day wave - as well as the larger 72-day cycle - into August, before topping the bigger swing up, for another correction into the mid-to-late September timeframe. In terms of price, Gold came within earshot of making new all-time highs for the bigger swing, though managed to fall just short, with the recent tag of 3534.10.
In terms of price, holding above the 3318.80 figure on the current downward phase of our smaller 10-day wave suggests at least some potential for a spike back above the 3534.10 swing high in the next week or two, before topping the bigger swing up. Whether there is enough time for this path to play out remains to be seen, as the bigger upward phase is on the lookout for another correction into mid-to-late September.
Stepping back slightly, the upward phase of the larger 34, 72 and 154-day cycles is still deemed to be in force - though is into topping range. In terms of price, until a higher level materializes, it would currently take a reversal back below the 3318.80 figure (December, 2025 contract) - a number which should start to move up soon, with the most up-to-date figure always posted in our thrice-weekly Gold Wave Trader report.
Gold's 72-Day Cycle
As mentioned in my last article from June, our 72-day wave was seen as having bottomed back in mid-May of this year, and with that was viewed as pushing higher here into the month of August. Here again is our larger 72-day cycle in Gold:
Above the 72-day wave, there is the larger 154-day component in Gold, and which is shown on the following chart:
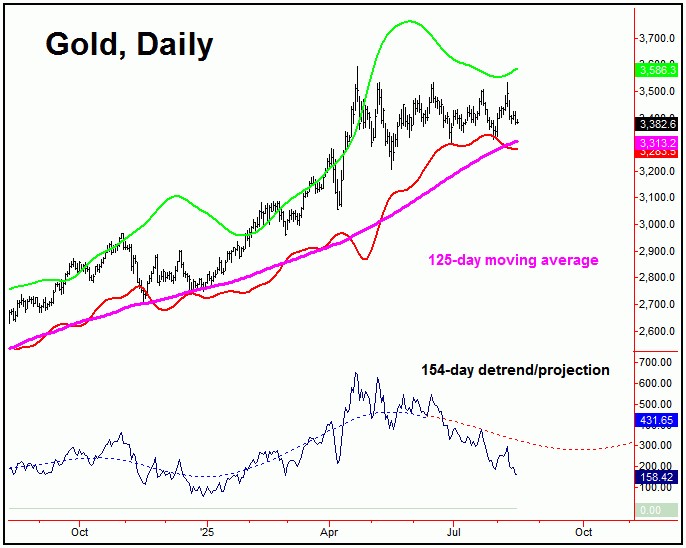
For the 3-6 week view, a correction is favored to play out into the mid-to-late September timeframe, where the next 72 and 154-day combination bottom is projected to trough. From that low, another sharp rally of some 14-20% would be expected to play out in the following months, ideally holding up into the early-2026 timeframe.
Adding to the above, it will be the next upward phase of our 154-day wave that carries Gold up to its next four-year top, which is due early next year - but with a large plus or minus variance. In terms of price, Gold potential to each up to the 3800-4000 region before topping that four-year cycle, for what is expected to be a larger-degree (i.e., 25%+) correction into later next year.
Technical Considerations
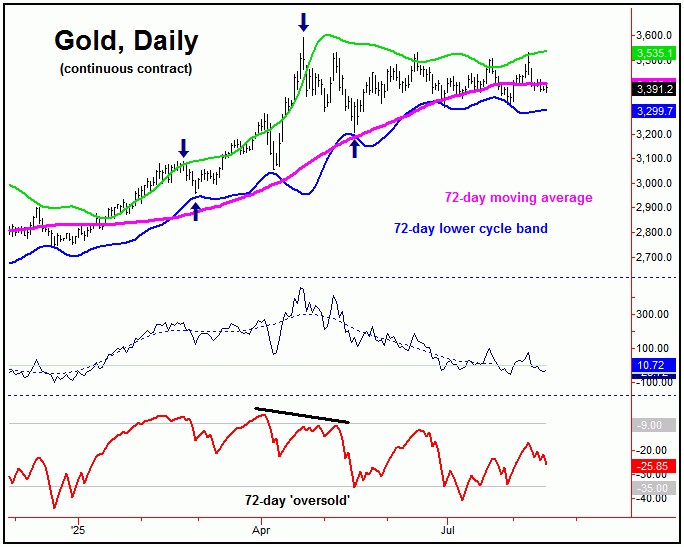
Lastly, of key note for the short-term view is that our Gold Timing/Cycle indicator has recently turned back to the downside, and with that has now moved back below its lower reference line. Here is that indicator, shown on the chart below in red:
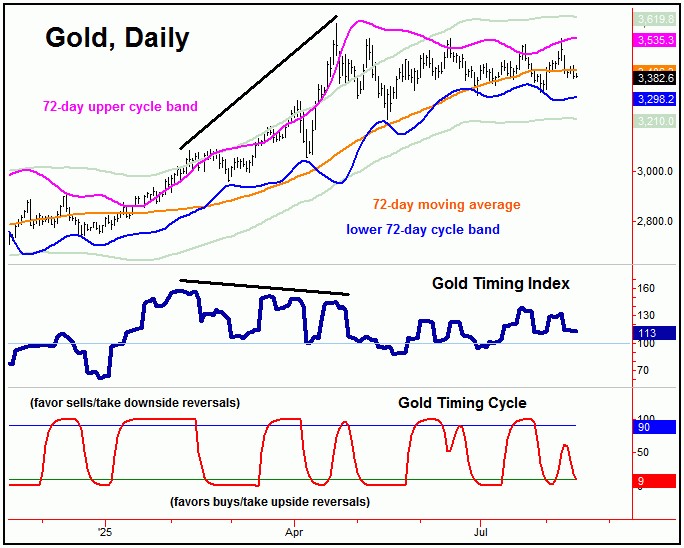
Adding to the notes above, the best rallies start when our Gold Timing/Cycle indicator (in red) is below its lower reference line, where it is right now. This is supportive of the next short-term upward phase - which, as mentioned earlier, is expected to come from our 10-day cycle component. Whether that rally will be able to take out the August 8th peak is another story, with the larger 72 and 154-day cycle upward phase running on borrowed time. Stay tuned.
Jim Curry
The Gold Wave Trader
Market Turns Advisory
http://goldwavetrader.com/
http://cyclewave.homestead.com/
********


