COMEX's Gold Price & Open Interest BEV Charts


Since I've started my weekly market report in October 2008, I've written over 400,000 words, constructing thousands of charts and over 100 different reports in the process: time for a bit of a rest. With no DJIA 2%, or NYSE 70% A-D days for months now, it's a good time for me to sniff a few roses and relax.
I'll be back and up to full speed again in January 2011, but then maybe not as a weekly report. Weekly market commentary, with all of the graphics I like to use, really consumes too much time for a one man operation such as mine. But while I'm relaxing, I expect I'll be writing a few articles whenever something interesting happens, like what's happening now in the gold and silver markets. Based upon my Bear's Eye View (BEV) analysis, I expect a big breakout soon in the gold and silver markets. But since I'll be taking it easy for awhile, I'll only be examining the gold market, with the understanding that the situation in the silver market is most likely worse.
Below is the BEV Plot for the gold market from 1969 to 27 Oct 2010. BEV Plots record the percentage declines in a data series from each new all-time high, over time. Each new all-time high is registered as a Zero on the BEV's Plotline. All other data points are recorded as a negative percentage decline from their last all-time high. Looking at the last 41 years of gold market history through the Bear's Eye View, we see two bull markets, 1969-80 & 2001-10, with a 27 year gap between the 1980 historic all-time high, the previous bull market's "Terminal Zero," and the first new all-time high of the 2001-2010 bull market, which occurred on 28 December 2007.

The 27 year gap from 1980 to 2007 is the most obvious feature in this chart, but the volatility differences the BEV Plot displays in these two gold bull markets, are key to understanding what is now happening in today's gold market. Note that in the previous bull market from 1969 to 1980, a span of 11 years, the price of gold was very volatile, but since 2001, when our current gold bull market began, gold has traded very differently.
The BEV Plot below begins on 02 Jan 1998, with gold at $288.70. The bottom of the last gold bear market was recorded on 15 February 2001 when gold closed at $255.10 on the COMEX. So our current bull market has now lasted almost as long as the 1969-80 bull market did, without attracting the attention of the mainstream financial media! However, when we compare these two bulls' volatility, it's obvious that they are very different animals. From 1969-80, it wasn't unusual for gold to have corrections greater than 20% as seen in the chart above, but since 2001, as seen below, smaller corrections of less than 15% were more typical between BEV Zero points. This difference is significant.

Differences in the extremes of gold's volatility are important to note too. The 1969-80 bull market once corrected 48% from a previous all-time high, while in the current bull market we've seen only one major correction of just less than 30%. That's a hell of a big difference, but what does this mean? I believe this indicates our current 10 year gold bull market is still young, with its biggest percentage moves both up and down still ahead.
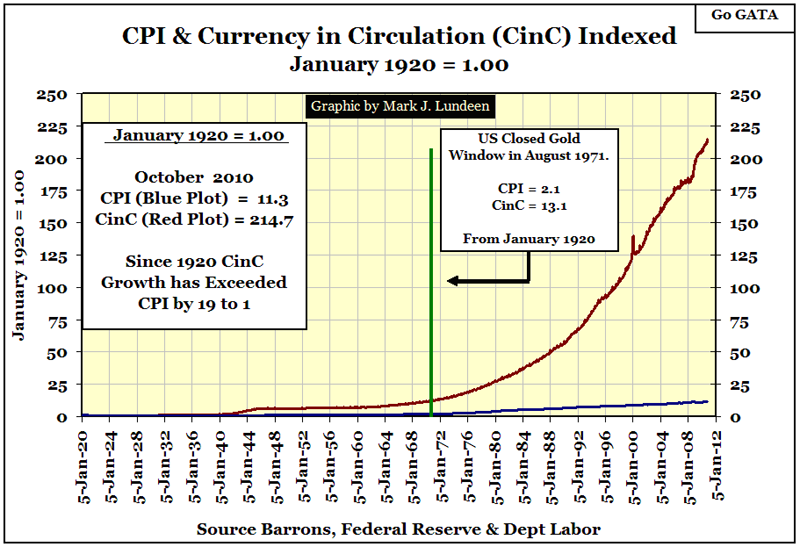
The coming increase in volatility for the gold market will depend upon the bond market. Bond valuations in 2010 are obscenely inflated, with bond yields far below actual consumer price inflation. This is a highly unstable situation, very similar to the bond market of 1938 to 1981, a period when money invested in the bond market, purchased only tickets to poverty. This is what happened as bond yields rose from 3% to 15%, while rising consumer prices gnawed away at, the purchasing power of fixed income investments. In the chart below, the connection between rising bond yields, and the inability of the US Treasury and Federal Reserve to maintain the Bretton Wood's $35 an ounce gold peg after 1968, evidence of the post WW2 financial market's tardy awakening to the fact that US "monetary policy" was one of predation.
Beginning in 1981, with the 30 year US Treasury Bond at record high yields of 15%, bonds began a 30 year bull market, just one year after gold began its 21 year bear market. We'd expect to see these logical trends, as the US dollar moved from the dog house to the penthouse in the global markets, as US dollar inflation stopped inflating consumer prices, and began inflating financial asset valuations. But beginning in 2001, something very strange happened: gold and bond yield trends decoupled. For the past decade, rising gold prices sounded the siren of problems to come in the global financial markets, even as the bull market in bonds continued for an additional 10 years. It's no coincidence that the current bull market in gold started at the same time that the Washington / Wall Street Axis began its big push into the US Sub-Prime Mortgage market.
So in the chart below, it's not hard explaining why since 2001 gold has been rising to new highs; what's hard to comprehend are the current extremely low bond yields.

Decades ago, rising bond yields during the 1950s & 60s eventually had an impact on the price of gold in the 1970s, as rising consumer price inflation pushed people out of financial assets, and into commodities. I expect this time around, rising gold prices from 2001 - 10, will impact the bond market, driving yields to levels far above their highs of the early 1980s. This is no radical theory of mine, but the inevitable consequence of a monetary policy that allows Quack-Economic Professors from Princeton University to monetized toxic debt without limit.
In 1968, the US Government was forced to admit it couldn't maintain the $35 gold peg, if it continued to issue more than 35 dollars for each ounce of gold it held in reserve. Sometime in the next year or two, the US Government is going to learn another lesson: bonds priced in currencies whose government engages in the reckless currency creation we see below, can't maintain single digit current yields forever.
We live in strange times, times that future historians will spend much time analyzing in an attempt to understand why the bond market in 2010 failed to react to the hazards that wealth is being exposed to by uncontrolled monetary inflation, as it always has in the past. I'll save these future historians' some time by pointing out that today's current generation of money managers were trained by incompetent, know-it-all economists, who believed that the predictable risks introduced to the financial markets with the 1971 breaking of the Bretton Wood's $35 gold peg:
- Interest-rate risks
- Currency risks
- Volatility risks
could be hedged with derivatives and supercomputers. This model of macro-economics has since been proven unworkable by the October 2008 collapse in the American mortgage market. But in October 2010, this realization has yet to be priced into financial assets, or precious metals and commodities. I say that because as the Fed Chairman, Doctor Bernanke, promises to flood the world with ever more US dollars, the bond market has yet to demand compensation for the growing risks being taken by bond purchasers. As a matter of financial survival, bond yields should have been raised with the price of gold for the past 10 years, exactly as happened from 1969-80! But if they haven't so far, I assure you that someday soon they will.
I like to think of our current economy and financial market as one that exists in a "False Vacuum", a quantum mechanics concept where a system is not resting at its lowest potential state. When considering the bond market, I think the following quote is appropriate.
"The possibility that we are living in a false vacuum has never been a cheering one to contemplate. Vacuum decay is the ultimate ecological catastrophe; in the new vacuum there are new constants of nature; after vacuum decay, not only is life as we know it impossible, so is chemistry as we know it. However, one could always draw stoic comfort from the possibility that perhaps in the course of time the new vacuum would sustain, if not life as we know it, at least some structures capable of knowing joy. This possibility has now been eliminated."
- Sidney Coleman & F. de Luccia
Think of a false vacuum as a little town built beneath a towering dam, holding back hundreds of cubic miles of water with its steel and concrete. The dam and its reservoir may appear stable, but the water towering over the little town is somewhere it really doesn't belong. As long as the dam holds, the false vacuum does too. However, the law of gravity, acting on cubic miles of water high above the little town can be opposed for only so long by concrete and steel. When the false vacuum breaks, the people living in the little town below are doomed. The current low volatility in the gold market suggests to me, if to no one else, that the gold and silver futures markets are the best windows to see the success, or failure of the US Government's current efforts to maintain its false vacuum in the US bond market.
After all, over the past 100 years US Treasury debt has replaced gold and silver as monetary reserves worldwide. Exploding US dollar valuations in gold and silver will bring into question the viability of US Treasury debt for use as monetary reserves, or even as financial assets in general. Washington's "Policy Makers" certainly know this, and for this reason it's logical to assume that the current low volatility in the gold market, over the past 10 years, is the result of market manipulation at the highest level, by governments - worldwide. So taking the Bear's Eye View of the COMEX's open interest data should provide us with a unique insight for the ease, or difficulty the Federal Reserve and US Treasury will have in maintaining their false vacuum in the treasury bond market.
Open interest in any commodity market is the number of actively traded contracts in existence, from day to day. With gold, each contract represents * A PROMISE * by two parties, one to deliver, and the other to take the delivery of 100 ounces of gold, at an agreed upon price, sometime in the future. That's why commodity contracts are sometimes called "futures contracts." The majority of these contractual promises are not kept, as the counter-parties usually prefer to settle their profits and losses in US dollars, not gold. But if commodity exchanges are to perform an economic function other than that of that of a commodities casino, a place for speculators to make bets on the future price movements of the underlying commodity, they must by necessity also be places where the actual physical commodity can be delivered and taken, at market prices.
The plot below shows the number of ounces of actual gold stored in COMEX approved facilities (Blue Plot, left scale), and the ounces of gold-paper promises (Red Plot, right scale) traded in future contracts at the COMEX. Over time, there are typically 5-6 ounces of paper gold in open interest, for each ounce of physical gold actually stored in COMEX facilities.

As long as the US dollar is acceptable in payment to the COMEX's long counter-parties, those people who could take delivery if they chose to, this 5 to 1 ratio of paper gold promises to actual gold in storage is not a problem. HOWEVER, when Doctor Bernanke's Quantitative Easings finally cracks the dam, and the false vacuum in the financial markets breaks, this will no longer be the case.
The world's first indications that the bond market's false vacuum has broken will be seen in the gold, or possibly the silver futures' market. Gold longs, who have long accepted US dollars in contract settlements, will develop an overwhelming preference for actual gold, rather than take US dollars when settling these contracts. The day will come when demand for gold at the COMEX will see an almost instantaneous increase of 500%. In hours or minutes, gold priced in US dollars will spike upwards to levels that will shock the world at large, and force many large Wall Street firms to default on their gold contracts. Without a doubt, the US government will make good on these defaulting gold contracts - but in US dollars. Gold futures traders who receive dollars instead of the gold they actually wanted, will quickly take any dollars received in settlement, and attempt to purchase physical gold, wherever, and by from whoever is willing to exchange their gold for Uncle Sam's monopoly money. Panic in the gold market will quickly spread to the bond and stock markets, where money managers will also discover a growing preference for gold and silver to stocks or bonds yielding less than the rate of inflation.
The above is speculation on my part, but a speculation based on past historical events in the financial markets. Seeing markets dump paper assets for pennies on the dollar, during a panic into gold and silver is no fictional event created solely in the mind of this author. I expect this scenario, in some form, will prove to be one of those way-better-than-house-odds-situations we should all be anticipating. Something similar to this in the gold, or quite possibly in the silver futures market, will mark the precise point-in-time when the false vacuum in the US bond market breaks, heralding the beginning of the end for the US dollar's role as a reserve currency. Exactly what that means I don't know, and I know that I won't enjoy finding out. But then:
The possibility that we are living in a false vacuum has never been a cheering one to contemplate. Vacuum decay is the ultimate ecological catastrophe; in the new vacuum there are new constants of nature; after vacuum decay, life as we know it (like purchasing goods and services with Dr. Bernanke's dollars) becomes impossible.
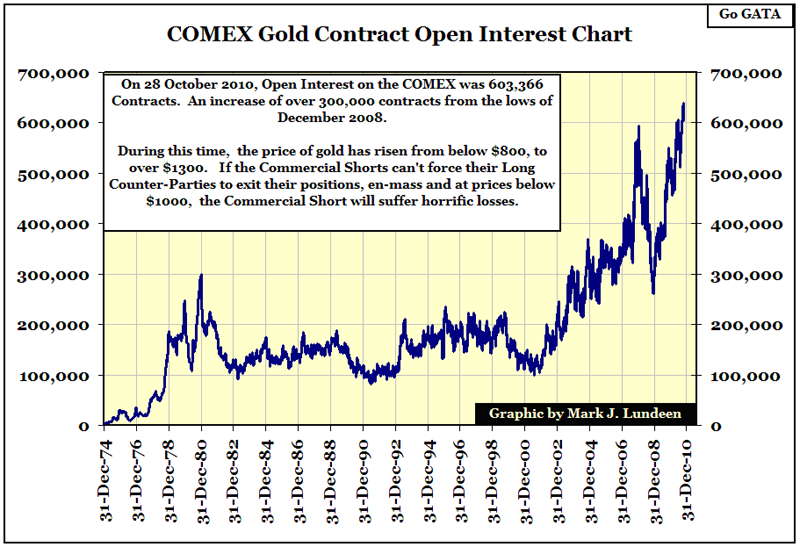
So how is the dam at the COMEX'S gold market holding? As we see in the BEV Plot for the COMEX gold open interest data below, things don't look so good. For your information, currently the commercial shorts in the gold and silver markets are mostly big NY banks. Declining open interest, as prices fall, is a sure sign that shorts of all kinds are closing their positions at a profit, at the expense of the longs. Just as declining open interest with rising prices, is a sure sign that the longs of all kinds; are closing their positions at a profit, at the expense of the shorts. My commentary assumes that large NY trading houses have dominated the short side of the metals futures markets since 1974. And as one might imagine, the market as currently managed, almost always seems to see open interest decline on FALLING prices, to the benefit of these large financial firms.
Using the open interest data seen in the, Red Plot, right scale from the chart above, I've constructed a BEV Plot for the COMEX open interest from 1974-2010. Like the BEV Plot for the price of gold, we see a long gap between BEV Zeros from 1980-2002, and a significant difference in the workings of the gold market of these two gold bull markets. From the period of open interest volatility from 1974-80, the shorts, who I'm assuming were dominated by large NY banks, easily made profits as they closed out their short positions, as the longs were forced to exit the market on declining gold prices.
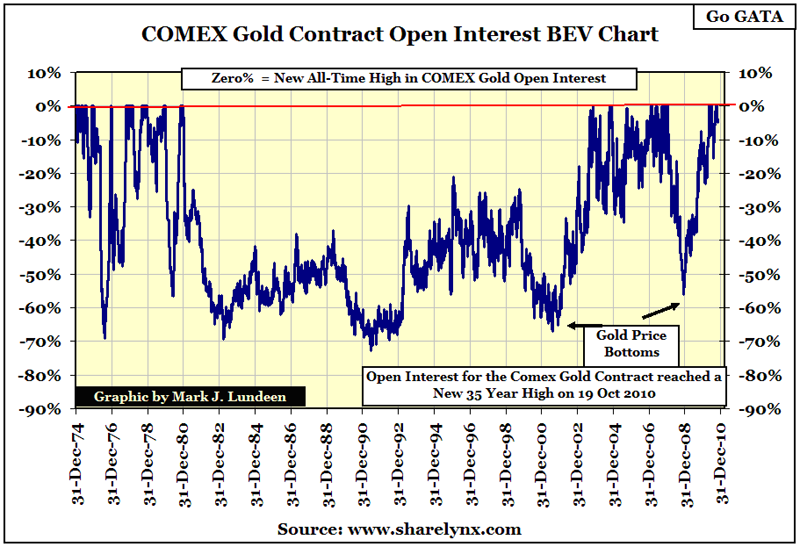
However, from 2001-10, the BEV Plot makes it clear that making money the old fashion way for the big NY commercials has not been as easy as it once was. Look at the open-interest's BEV plot from 1974-80. The open interest goes from one new all-time high, down to 30%, 40% and even 70%, before it rises up to a new all-time high in COMEX gold open interest. Making minced meat of the COMEX longs was easy then, but flushing-out the longs from their gold positions has been more difficult during our current bull market. Look at the BEV Plot; from 2001 to December 2007, the big commercial shorts were flushing out the longs, but with less and less success each time. The January to December 2008, 54% flush-out really stuck it to the longs, just like the good old days in the 1970s; but take a good look at what's been going on since December 2008: the longs are refusing to be flushed down the COMEX's toilet!
What does this all mean? Just that every new BEV Zero is an all-time high in contracts traded in the COMEX's gold market, so we are seeing the shorts digging a deeper hole as the price of gold continuously increased. An extremely ugly situation for anyone to be in. However in this case, it's the big Wall-Street banks that find themselves in this situation, and most likely will require the US Treasury to once again step-in, and bail them out. These banks have a huge problem, whose only solution is defaulting on their gold contracts.
Since December 2008, open interest in the COMEX gold market is up over 300,000 contracts. That's 300,000 contracts representing 100 ounces of gold each, during which the price of gold has risen from below $800 an ounce to over $1,300! The capital accounts for these big NY banks trading in this market are hemorrhaging red ink! Where in the hell was the US Treasury's Office of the Comptroller of the Currency while this situation developed? No doubt busy looking the other way, as the US Treasury is fully aware of the dangers rising gold and silver prices present to the global bond markets!
There are ancillary issues to all of the above that somehow are never commented on. These same banks and financial institutions involved on the short side of the gold and silver markets are also major counter-parties in the hundred-trillion dollar OTC derivative market. After the US mortgage fiasco of 2008, the business acumen of the management of these financial institutions must have seemed less than desirable to their counter-parties in markets far from the Sub-prime mortgage market. When these financial companies come to grief at the COMEX, I expect shockwaves to spread quickly towards the interest-rate-swap derivatives market, and elsewhere.
The same NY Banks involved in the gold and silver markets, also underwrite bonds of all kinds; including state and local municipal bonds. Today, it's a universal practice for the underwriters of municipal bonds, to package the bonds being marketed with derivatives. The low yields we see below are only possible because muni-bond buyers believe the credit risks associated with today's muni-bonds are hedged with credit default swaps.
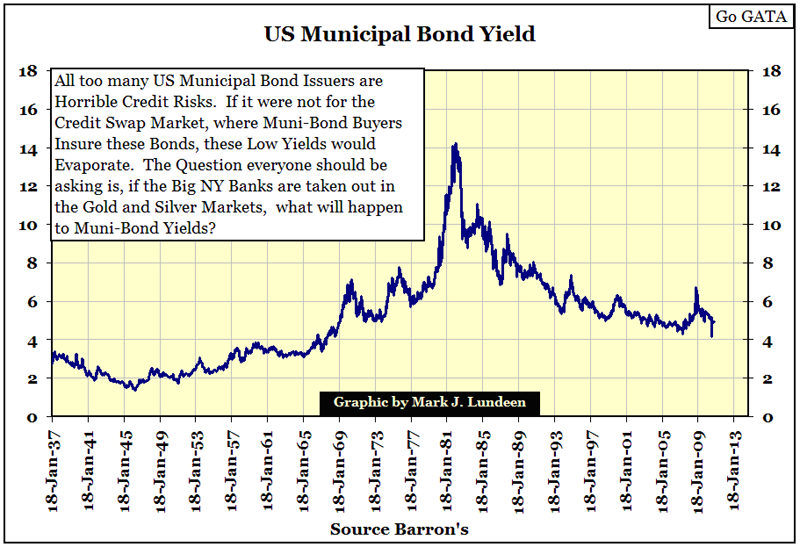
But bond buyers will have second thoughts of the viability of their muni-bond "hedges" if the banks that marketed their "hedges" failed to hedge their own way out of a default in the gold and silver markets. Muni-bond yields rising to double digits will result in rolling bankruptcies across American local government. Can the OTC credit swap counter-parties survive double-digit muni-bond yields? And how will Washington's "Policy Makers" respond to that? Most likely, they will respond with a massive program of bailouts that will dwarf anything ever seen in the mortgage market. But will China and other large foreign holders of US Treasury debt take the inflationary bullet aimed right between their eyes? Or will they rather take ten cents on the dollar for their US Treasury bonds, and conclude that gold at over $10,000, $20,000 or even $30,000 still looks cheap.
When the false vacuum breaks, all the old rules will change, and previous assumptions will prove false.
I was reading Bill Murphy's Midas Commentaries a few days ago, where he quoted someone saying that the time is coming when Gold-Bugs will soon be able to take off our tin-foil hats when speaking in public. Well, when the false vacuum in the bond market breaks, that will surely be so, as well as seeing the popular culture placing a dunce cap on the heads of all the Keynesian-Economic "Technocrats" employed by governments worldwide.
Mark J Lundeen
31 October 2010


