The Coming Days of Extreme Volatility And Market Breadth
There was some excitement on Tuesday. The Dow Jones was down 1.41% and the NYSE saw a day of extreme breadth (more on that below). But the Dow Jones recovered from its early week losses, and ended the week higher than last Friday’s close. The question in my mind is whether we see the Dow Jones at a new all-time high, or see it break below its BEV -5% in the chart below. Either possibility wouldn’t surprise me.
With the presidential election just weeks away, and the real possibility of an actual outsider winning the election; someone determined to rearrange the furniture in the cozy clubhouse Washington has become to the establishment, don’t be surprised if nothing much happens with the markets until after the election.
Trump has made the point that the Fed is waiting until after the election before it raises interest rates, which would trigger a market crash.
This is a point he needs to hammer home before the election, because that’s exactly what the FOMC is planning to do. The main-stream media will then do their bit for the New World Order; blaming Trump for causing the greatest market crash since the 1930s. Now is the time to “inoculate” his presidency from this pending calamity by making this exact point over and over again until all the “market experts” are on record mocking him for being so “ignorant.”
Exactly as Mark Cuban did…
“Dear Donald, if the @federalreserve is truly political they will announce that if you are elected there will be a HUGE rate increase.”
— Mark Cuban (@mcuban) September 12, 2016
Looking at the following chart of the Dow Jones, we see the heights the FOMC has driven the Dow Jones to since they’ve implemented their Zero Interest Rate Policy in December 2008. In January 2008, their Fed Funds was at 4.25%, but ended the year at 0.15% as the Fed “injected liquidity” into the financial markets in biblical proportions to reflate the then rapidly deflating Dow Jones.
The success the FOMC has had in “restoring market stability” is in full display below. But what would happen to the Dow Jones should Fed Funds once again be increased to where it was in January 2008: 4.25%? That’s not an extreme value for short-term interest rates. But after almost a decade of monetary shenanigans by the charlatans sitting around the table at the FOMC, where they have taken long-term T-bond yields well below 3%; I expect a 4.25% in the Fed Funds Rate would soon take the Dow Jones below its 5,000 line pretty darn quick, with the banking system and economy imploding as it does! But how likely is that to happen?
When the bond market, a market whose valuations has been inflated to grotesque proportions by the global central banking cartel, with trillions of dollars of bonds currently yielding negative returns begins to deflate; the entire yield curve will swiftly shift to much higher levels. This will be a market event not guided by the hand of “policy” but one driven by the primal instinct of self-preservation and panic in a no bid market environment. I doubt Mr Bear will request permission from Janet Yellen’s before making his move in the bond market. Okay, I can see this happening; but when? I don’t know. But anticipating this happening within the first one hundred days of the next president’s administration seems as good a guess as any.
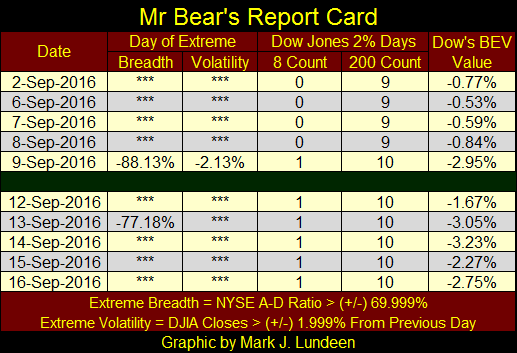
I totally missed it. Last Friday I failed to note the NYSE saw a day of extreme-market breadth (NYSE 70% Day) and the Dow Jones saw a day of extreme volatility (Dow Jones 2% Day). See Mr Bear’s report card below. These extreme market events are overwhelmingly bear market events, and we haven’t seen any since the market downturn of last January / February. The NYSE then saw another extreme day on Tuesday.
Is the market on the edge of a precipice? I can’t say that. But I can say that if it is, this is how it would begin; extreme market events once again becoming common occurrences, with the stock market near all-time highs.
What are NYSE days of extreme-market breadth and Dow Jones days of extreme-market volatility?
NYSE Days of Extreme-Market Breadth are computed as follows:
Advancing Shares - Declining Shares / Total Shares Traded that Day
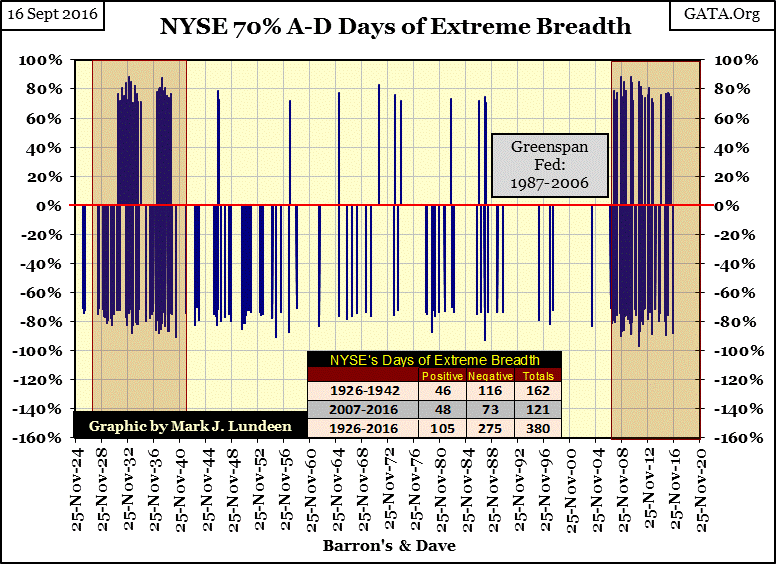
Those days that see this ratio resulting in a value of (+/-) 69.99% or greater (let’s call it plus or minus 70%) are days of extreme-market breadth; a NYSE 70% day. My data begins in January 1926 (23,965 NYSE trading sessions), of which there have been only 380 days at the NYSE that saw a day of extreme-market breadth. They are actually rare market events.
In the table on the chart below, we see the majority of those extreme market events occurred from 1926 to 1942, and then from February 2007 (as cracks in the sub-prime mortgage market began developing), to today. From 1942 to 2007 (65 years), the NYSE saw only ninety-seven days of extreme market breadth. Remarkably during the Greenspan Fed (1987-2006), the NYSE saw only fourteen days of extreme market breadth during these nineteen years. However, since February 2007, the chart below has developed a cluster of extreme days (121 so far) that’s similar to the cluster formed during the depressing 1930s. Strangely, mini-clusters of positive days are typically associated with market declines.
I can’t help but believe our current, and growing cluster of NYSE 70% days is a significant development in the stock market, an indication that Mr Bear has unfinished business on Wall Street.
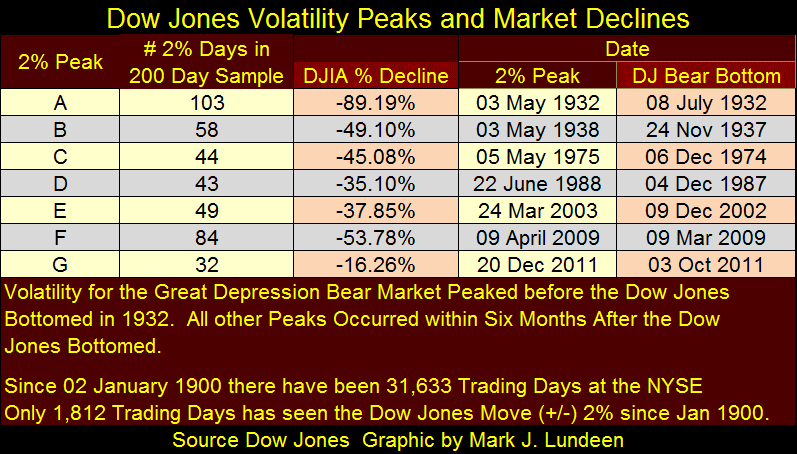
The Dow Jones sees a Day of Extreme Volatility when it closes more than +/- 1.99% or more from a previous day’s closing price (chart below). I call them Dow Jones 2% days. Since January 1900, the Dow Jones has seen only 1,812 days of extreme volatility in these 31,633 trading sessions at the NYSE.
A fact I find fascinating is how the Dow Jones sees its largest one-day advances during big bear markets. It was during the great-depression bear market when the Dow Jones saw two daily advances of +15%. During the credit crisis, the Dow Jones saw a +11% daily advance on 13 October 2008. So understand that when the Dow Jones sees a historic daily advance, they are bear market events. It’s best to assume Mr Bear isn’t finished clawing back market valuations from the bulls just yet. The big furry fella isn’t a friend to short sellers either. These historic market advances in big bear markets is Mr Bear’s way of allotting grief to the short sellers as well as to the bulls.
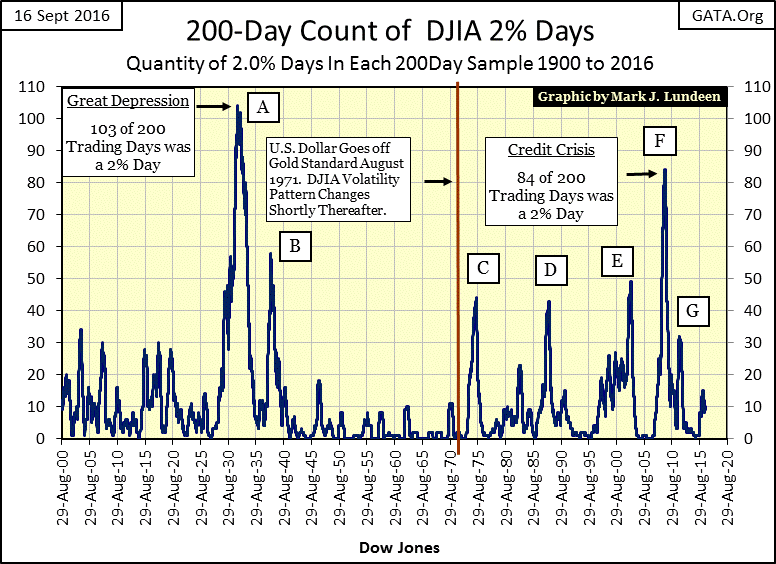
Plotting the raw data for Dow Jones days of extreme volatility (above) isn’t the best way of displaying this data. Plotting a running 200 day sample (a 200 count) of Dow Jones 2% days (chart below) really highlights the bearish implications of market volatility. The fact is; since January 1900, bull markets don’t generate Dow Jones 2% days in sufficient quantities to raise the 200 count to values above 5 in the chart below. When in the plot below, the 200 count increases above 10, Mr Bear can be found feeding on the bull’s capital accounts.
The inflationary evolution of the stock market is also seen above.
- The Free Market: 1900 to 1921;
- The Federal Reserve Enters the Stock Market: 1922 to 1942 (volatility spikes A&B);
- Bretton Wood’s Era Stock Market: 1943 to 1971;
- Post Bretton Wood’s era Stock Market: 1971 to Present (volatility spikes C to G);
The thing to note in the chart above is when “liquidity” from the Federal Reserve System flows into the financial markets (bull markets), as during the 1920s, and again from 1933 to 1937, volatility for the Dow Jones decreases - low 200 counts. As the inflated valuations for the Dow Jones deflate, as during the Great Depression Crash, and again during 1937-38 bear market, volatility for the Dow Jones increases (200 count spikes A&B).
This exact same pattern of inflationary booms and deflationary busts can be seen in the Post Bretton Wood’s era Stock Market (200 count spikes C-G). Currently the market is working on volatility spike H. But most of the 2% days now in the 200 count date from last January / February, and will begin to pass from the 200 count sometime in November / December.
Mr Bear doesn’t need these stale 2% days to build his pending spike in market volatility. The next time the Dow Jones breaks below its BEV -10% line, there will be plenty of fresh 2% days to begin construction of V-Spike H. If I’m correct; that the next major market decline will likely be another Great Depression market event, volatility spike H in the 200 count could go over 100.
The table below lists the volatility spikes in the 200 count seen above, giving the day the count peaked, as well as the day the Dow Jones saw the bottom of its bear market. Keep in mind that a 200 day sample, like a 200 day moving average, typically lags a market series.
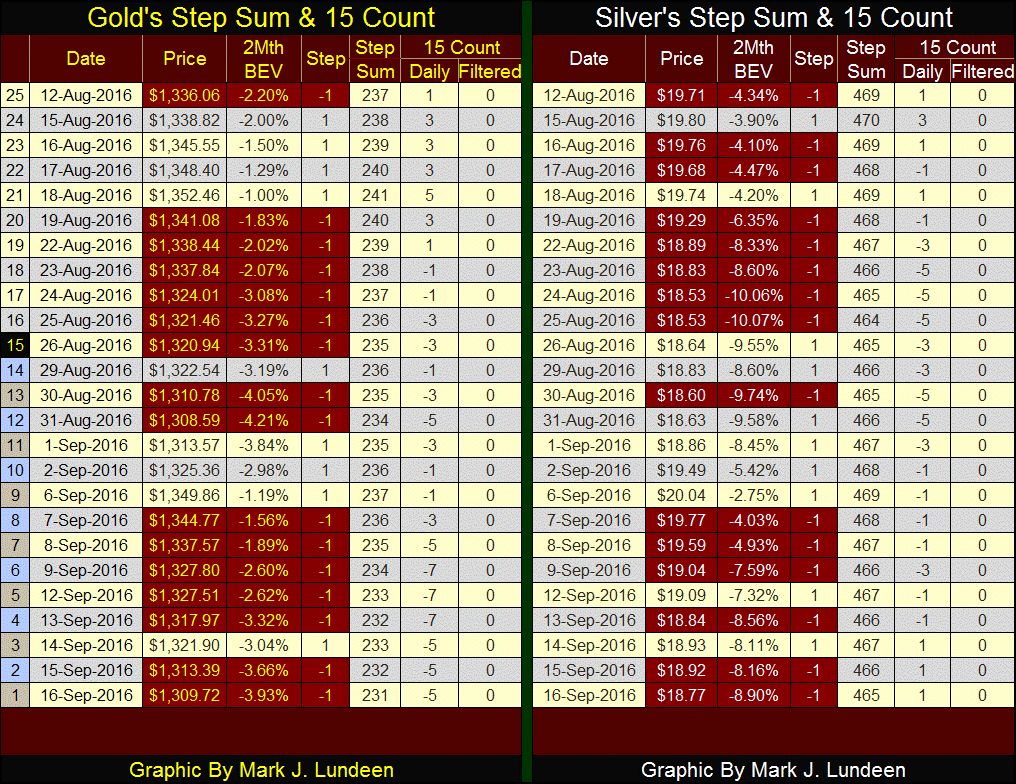
The “policy makers” are really going after gold. Since August 23rd its 15 count has been negative, meaning more declining days than advancing days in a running 15 day sample. Its 15 count closed the week at -5; or 10 down days and 5 up days in the past 15 trading days. Apparently the bears have had their way with the bulls.
Still gold closed the week at $1,309, above the $1,308 seen on August 31st. A remarkable feat of strength by the bulls, considering they’ve had only five advancing days of the past twenty. Think about that.
When the cycle turns, and gold once again sees more advancing than declining days, we just may see some explosive moves to the upside. When will that happen? We may have to wait until after the November elections, then maybe not. I just believe that gold a few dollars above $1,300 and silver below $19 are good values that won’t disappoint their purchasers in the years to come.
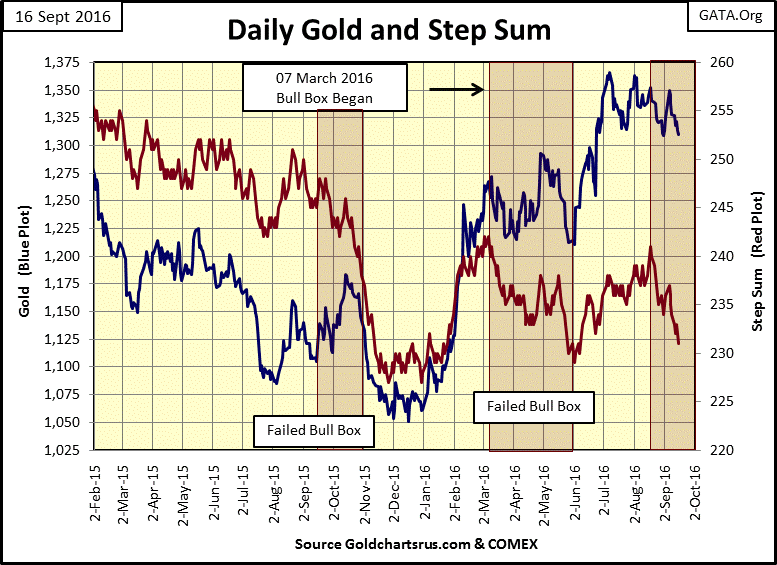
For the past few weeks gold’s step sum (market sentiment) has been heading down as the price of gold (market reality) refused to follow. This divergence between the price of gold and its step sum has been going on for the past four weeks. If this persists for another week I’m going to label it a bull box. Looking at the price of gold, I’d say it would have to decline below $1250 (break below its June 23rd low) before I declare this bull box a failure.
Keep in mind that I’m not a trader of gold contracts in the futures markets. If I was, I’d exit any long positions I had before gold broke below $1250. I’m someone who believes gold should be paid for in full and taken home. So if gold broke below $1250, I’d do nothing. So why do I follow the price of gold with a step sum plot? I’m a data hound who is fascinated with the markets, someone who enjoys charting and writing my weekly letter for my readers.
Back to the chart below.
I remember when gold’s March – June bull box failed. The price of gold broke below its low of April; $1215, making the box fail. But that was only for a few days in late May and early June. Then from its low of $1210 on June 2nd, gold jumped up $33 the next day, eventually taking gold up to $1366 on July 8th.
Gold hasn’t done much in the past two months. But considering where it was last December, with “main-stream market experts” expecting it to break below $1000, it deserves a few months to rest before its next advance in the bull market. But like most of my readers, I’m sick of waiting too because I know what the price of gold is waiting for; for the “policy makers” to exhaust themselves in their current effort of keeping the price of gold down below $1400. This too shall pass.
Let’s look at the gold mining indexes. All last spring into early August these indexes refused to correct after doubling, and then some from their lows of last January. But for the past five weeks they’ve surrendered some of their gains of the advance. Even so, after correcting for over a month they are still holding on to triple digit percentage gains from their lows of January.
In mid-August it seemed the miners could only go up. A month later we worry that maybe they can only go down from here. Do you see why gold’s step sum is going down? Market sentiment for the precious metals, including their miners is negative.
Investors’ fear of a big reversal as the market takes a break is typical of bull markets in their first phase. With the trauma from the previous bear market still fresh, the bulls are thinking of selling before the market melts down again. But what the bulls fear, the return of Mr Bear, somehow doesn’t happen early on in a bull market. In the last phase of a mature bull market, as with the decades old stock and bond bull markets, peoples’ fear of Mr Bear isn’t what it should be, and one day they will pay a high price for their complacency.
Considering everything, I give gold, silver and their miners a strong buy, while the general stock market and what will soon become a new dirty four letter word: B-O-N-D(s) a strong sell.
Mark J. Lundeen


