Gold Forecast: Reversal Breaks Confirm Key Trend Change


 With the action seen over the past week or so, the downward phase of the 34-day cycle was confirmed to be back in force - with the same now seen as true for the bigger 72-day component. With that, the next decent swing low should come from the combination of these waves, ideally set to play out into early-to-mid April.
Gold's 10-Day Cycle
For the very near-term, the downward phase of our smallest-tracked cycle - the 10-day wave - is also viewed as in force, and with that is into normal bottoming range. Here is that nominal 10-day component in Gold:
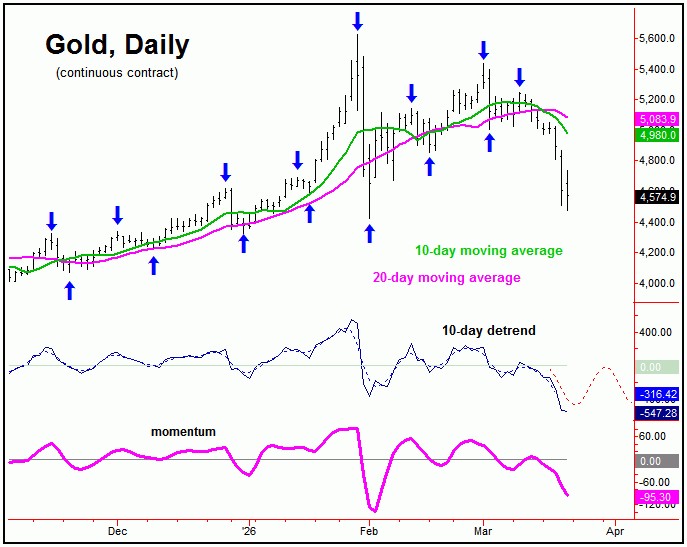
In terms of time, the current correction phase of this 10-day wave is now some 13 trading days along - which puts it in the back-end of normal bottoming range. With that, the next short-term rally should come from this cycle - which is due to materialize at anytime.
Having said that, it would currently take a reversal back above the 4698.00 figure (April, 2026 contract) to confirm this wave to have turned higher - a number which is expected to drop soon, with the latest numbers always posted in our Gold Wave Trader report.
Once this 10-day wave does turn, a rally back to the 10-day moving average would be the normal expectation - a move which would be expected to end up as countertrend, against the prior 10-day top of 5248.70.
Gold's 34-Day Cycle
Above the 10-day wave, there is the 34-day cycle in Gold, shown on the chart below:
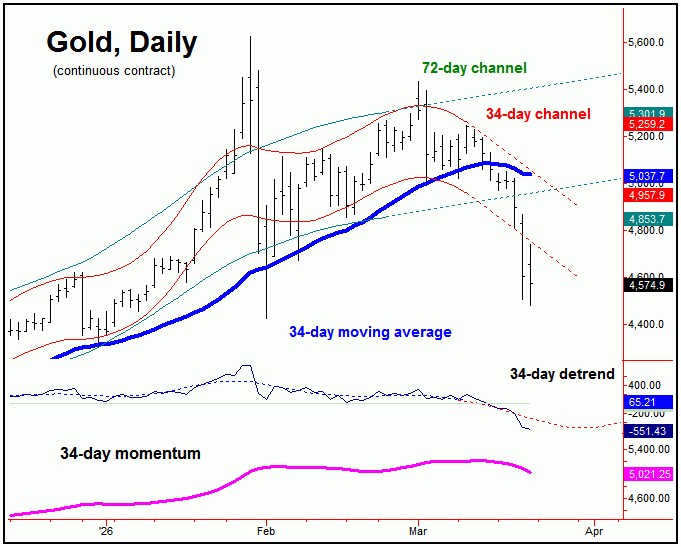
As originally pointed out in our March 13th Gold Wave Trader report, it 'felt' like this 34-day wave was turning south, simply due to the lack of follow-through with the prior 10-day cycle upward phase.
In terms of price, our downside 'reversal point' for this 34-day cycle was noted as the 5001.60 figure (April, 2026 contract). In other words, if broken below, this action would infer the correction phase of our 34-day wave to be in force.
With the above, last Monday's reversal below that 5001.60 figure confirmed what was suspected, a 34-day cycle downward phase that was back in force. In terms of time, the next low with this 34-day wave looks to be due around early-April of this year. From that low, the next bigger rally should be seen, ideally playing out into mid-May or later.
Going further with the above, we do have a new upside 'reversal point' for our 34-day cycle, which - when broken above - will best confirm the next upward phase of this wave to be back in force, which is posted in our Gold Wave Trader market report.
Gold's 72-Day Cycle
Above the 34-day wave, there is the 72-day cycle for Gold - which is shown below:
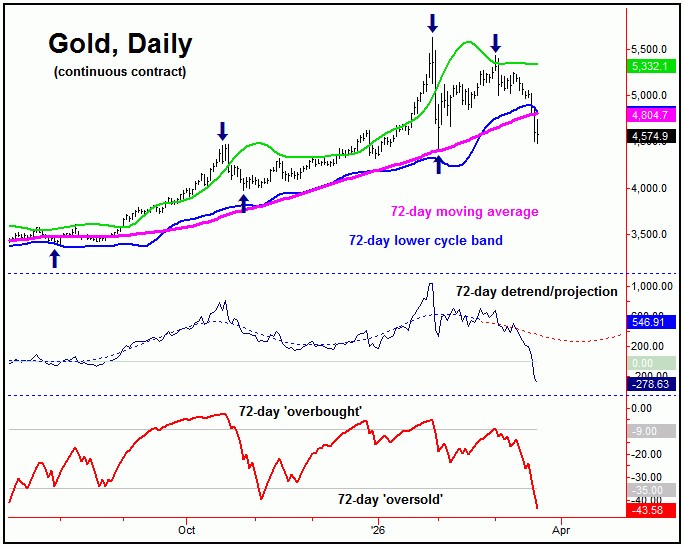
From my 3/8/26 article: "we noted key resistance around the upper 72-day cycle band, which would be hard to get past - at least on the first attempt. In-between now and when this 72-day cycle tops out, of note is that we should expect to see an in-between correction with the smaller 34-day wave, ideally playing out into mid-April, plus or minus."
With our 72-day cycle, the low seen into early-February was labeled as the prior bottom for this wave, though the action seen in the past week or so suggests another top having formed at the upper 72-day cycle band, which was a key resistance area for Gold. With that, the detrend that tracks this cycle is now projecting its next low to form into the early-April window, which is the same inference as the smaller 34-day component.
As more of a side note, one net positive is the fact that our 72-day 'oversold' indicator has now moved below its lower reference line - something normally seen closer to bottoms with this particular wave.

With the above said and noted, we expect the next key low for Gold to now come around the early-April window, plus or minus. From there, we would expect a sharp rally of some 12-14% or more to play out into the May/June timeframe. Stay tuned.
Jim Curry
The Gold Wave Trader
Market Turns Advisory
http://goldwavetrader.com/
http://cyclewave.homestead.com/
********


