Copper upside breakout imminent, implications for commodities...
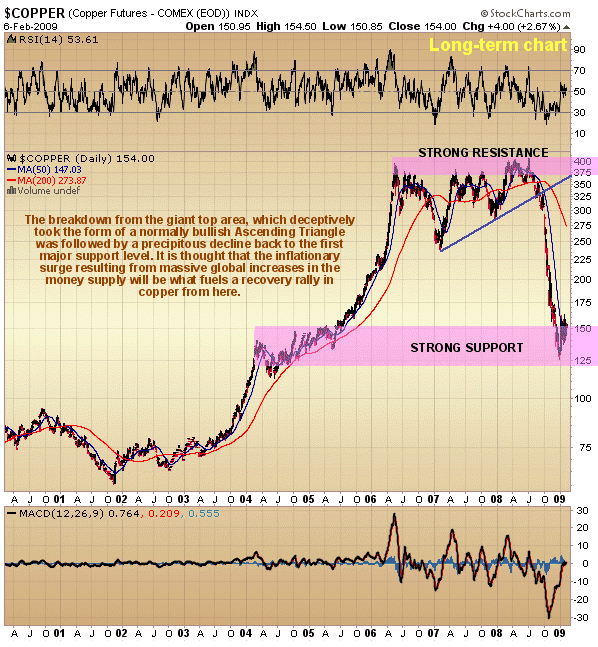
Although copper may seem like a sideshow it is actually very important, for it is a barometer of changes in the world economy. In retrospect it is easy to see on its long-term chart below that its refusal to break higher for several years from what turned out to be a major top area was a warning that all was not well with the world economy. The breakdown from the lower support line of the top area led to a crash back to the first major support level where it has stabilized. It remains wildly oversold, as shown by the huge gap between the 50 and 200-day moving averages.

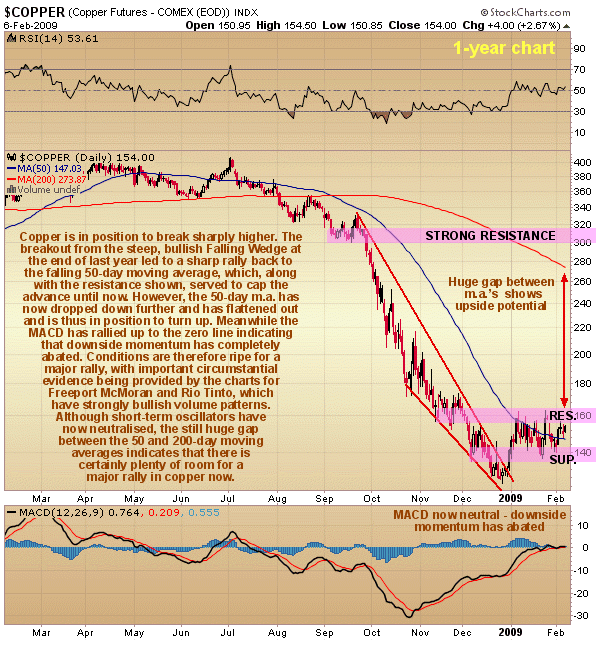
On the 1-year chart, however, we can see that despite all the continuing doom and gloom, copper has been looking increasingly resilient in recent weeks. Although the drop during the last quarter of last year was really severe, it was evident by December that it was taking the form of a bullish Falling Wedge, and the convergence of the boundary lines of this wedge is what forced the upside breakout at the end of the year. After breaking out it rallied sharply until it slammed into the falling 50-day moving average and this, and the resistance shown at about the same level at that time, combined to cap the advance - until now. The narrow congestion pattern that has since formed has drained off overhanging supply at the resistance level and has allowed the 50-day moving average to drop down and flatten out, and the neutralisation of the MACD indicator at the bottom of the chart signifies that downside momentum has now completely abated - this doesn't mean that copper can't drop again, but the neutralisation of this indicator is frequently a precondition for an uptrend to develop. Thus, conditions are now ripe for a new upleg to occur, and there is certainly room for it as the still massive gap between the 50 and 200-day moving averages shows that copper is still deeply oversold, despite the neutralisation of short-term oscillators in the recent past.

As you know, we don't go on what people say, we go on what they do, which is why we bought Freeport McMoran early in December and are already up 50%. What Smart Money has been doing in the recent past and is still doing is piling into the stocks of big base metal and copper producers like BHP Billiton, Freeport and Rio Tinto, as is plainly evident from their bullish volume patterns. This implies a copper breakout soon and more than that, a big broad-based rally in commodities generally, especially gold, silver and oil which would be the result of the global reflationary efforts currently underway bearing fruit, even if the benefits are temporary and result in rampant inflation.
Clive Maund, Diploma Technical Analysis
[email protected]
www.clivemaund.com
Copiapo, Chile, 8 February 2009


