
Did Interest Rates Bottom In July 2012?
 share
share
 share
share
 share
share
 share
share
 share
share
What is going on with the Dow Jones? See in the BEV chart below how currently the Dow Jones has yet to rise up to the red line for a new all-time high. It’s been 1,350 trading days since the October 2007’s all-time high. The bulls should be feeling excited about seeing the Dow Jones so close to taking out this stale record high. So why is the Dow Jones having so much difficulty making this happen?
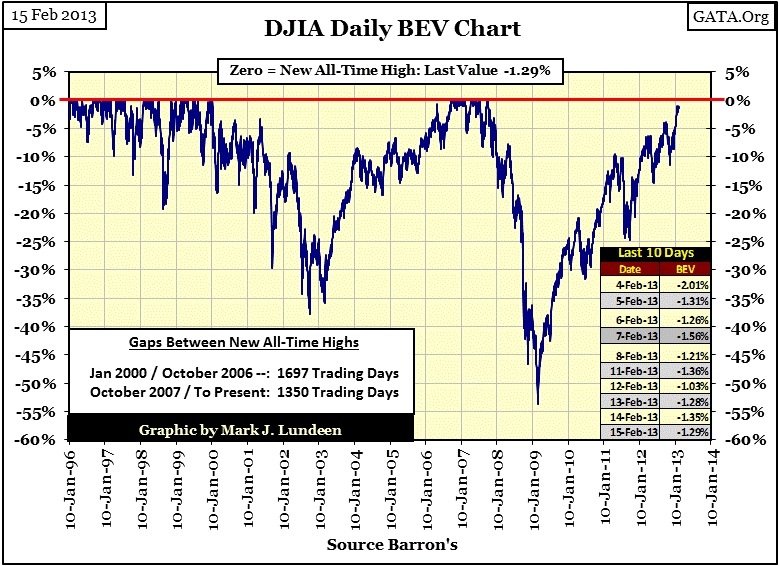
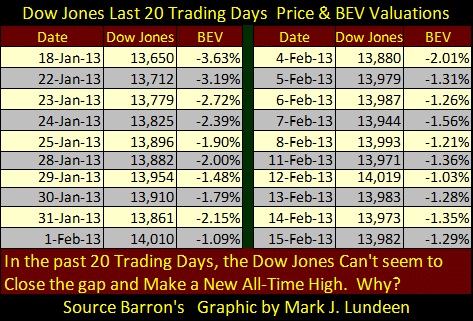
The table below better illustrates the situation. For the past month the Dow Jones has been within easy striking distance of making a new all-time high.
Now let’s get one thing straight; the stock market is not currently in a bull market. What is driving the Dow Jones up is just a lot of Bull! Trading volume has collapsed over 60% in most of the Dow Jones Total Market Group’s (DJTMG) sectors, and Dow Jones itself has seen its trading volume collapse by over 70%! This alone is really, really bad! But also, the Dow Jones dividend yield is dangerously low at 2.5%. Before Alan Greenspan, from 1925 to 1987, a Dow Jones dividend yield of 3% was always a solid sell signal. Since 1993, we’ve haven’t seen a Dow Jones dividend yield above 3%, except for the 2009 crash bottom when it yielded 4.74%. Historically speaking (pre 1987 when Greenspan became Fed Chairman) the potential for meaningful capital gains with such low dividend yields didn’t exist. And with such a small dividend yield, most stocks are yielding below the rate of inflation, PLUS President Obama has increased taxes on dividend income. So why are so many investors (those that survived the 2000s) and financial journalists hanging around the stock market expecting the 1990s to resume any day? Well, we haven’t seen an actual bear market since 1974.
How can I say that after the second deepest bear market bottom since 1885 occurred in March 2009? Because today, everyone with exposure to the stock market has forgotten that fact a long time ago, say since September 2009. When was the last time the media used a chart that goes back to March 2009? All most never. To my way of thinking everyone now standing in line outside the NYSE, and expecting the Dow, and the general stock market to continue going higher is actually waiting to pass through Wall Street’s meat-grinder one more time. But they don’t understand that - yet. In the popular mindset of what is and what isn’t possible in February 2013, market bulls still believe that today’s bull market is a continuation of the 1982-2000 bull market, a bull market they believe will never die. What about the -38% bear bottom of October 2002 & the -53% bear bottom of March 2009? No more than little bumps in the road that most people believe the “policy makers” have repaired; but in fact nothing has been set right.
Markets are human things; and bull and bear markets are outward expressions of the human emotions of optimism and pessimism. People enter the stock market because they are optimistic about the future. Buying stocks in a bull market is an act of faith that the future will be better than today. People exit the market because they become pessimistic about the future. In bear markets people sell because they believe that today’s prices will be higher than anything they’ll receive tomorrow.
But for gold and silver the reverse is true; precious-metals bull markets are driven by fear of what is to come. This is why precious-metals bull markets have historically gone up with bond yields, as rising bond yields are also market indicators of pessimism. For gold and silver to have risen so far in their thirteen year bull market, as bond yields have continued their decline since 2001 tells us that someone is horribly wrong! Look around; what the hell is there to be optimistic about in our economic future?
- Central banks are expanding money supplies with the full intention of destroying their currencies to better their nations’ exports.
- Central banks are lowering interest rates hoping to lure governments, businesses and individuals into ever deepening levels of insolvency.
- The global banking system is insolvent and can’t function without Central Bank intervention on a daily basis.
- Unemployment is rising, with no hope of it turning around in the foreseeable future.
- The abominable “health-care” legislation will soon impact the economy and business with higher taxes & insurance premiums. Its regulations will impact the entire population in ways that no one yet fully understands. Do people understand that they will have to report yearly to the IRS on the status of their healthcare insurance, or be fined?
I can go on and on with this list. And for any item of hope in the future, there are three government agencies looking for a way to either tax it or regulate it to death. This environment is not one that supports market confidence for the future, so the bulls in the bond markets must be wrong, which makes the prospects excellent for gold and silver. When the bond market finally understands that higher yields are baked into the cake, and bond prices become an excellent source of capital losses, gold and silver will enter into a new phase of their bull markets.
Getting back to the Dow Jones, our current situation where the Dow Jones can’t seem to break above a stale high from six years ago reminds me of something that happened in the 1930s, seen in the chart below. I started this chart’s Bear’s Eye View (BEV) series at the bottom of the 1929-32 market crash. As the first data point in all BEV series is always the highest value (up to that point) it becomes a new-high for the move, even at the bottom of a massive 89% bear market. So we see a BEV Zero at the exact bottom of great crash with the Dow Jones at 41.22.
In 1937, five years later, the Dow Jones had risen to 194.40, which was just another BEV Zero in the series. From there, the Dow Jones corrected 15% in July of 1937, and then bounced up to 189.29, just 2.25% from making a new high of the move.
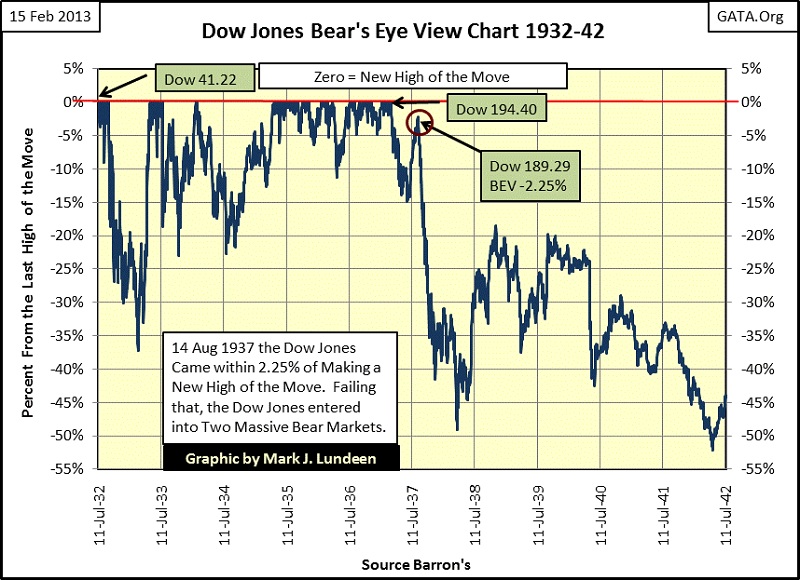
But the 1930s was the era of the “New Deal”, and the New Deal was all about tax increases and new and ever expanding government and bureaucratic regulation. You can see the point in time I’m referring to as I placed a red circle around it. Failing to make a new high of the move, the Dow Jones went on to two massive bear markets bottoms. The 1942 bear bottom was the #2 Dow Jones’ bear market bottom for decades, until our March 2009 market bottom knocked it into the #3 position.
I’m not saying that the Dow Jones of today will follow this great depression pattern to a T. The Dow Jones may even go on to a new all-time high or a few new all-time highs in the days, weeks or months to come. But with things as they are now, I expect what’s coming will force the Dow Jones’ March 2009 bear bottom to the #3 position in its bear market rankings, and then we just might see a final Dow Jones’ market decline that will challenge the July 1932 -89% bear bottom for the #1 position. Why do I believe this is possible? Because the Federal Government and Wall Street are inhibiting business and consumers ability to produce and keep the fruits of their labor with their interest payments, taxes, and punitive regulations.
What about the current talk of a falling bond market providing the fuel needed for a continued bull market in stocks? I don’t see it! Historically, meaning before the Greenspan Fed era, rising bond yields drew money from the stock market as people investing for income moved their funds to higher yielding bonds. And in a massive bear market were capital gains are only memories of times long ago, those stocks without dividends are eventually without investors.
Currently the stock market may be very near a new all-time high, however the markets will soon be pricing in the effects of Obama’s Health-Care legislation on the economy and business. I expect the impact from this monstrous legislation to be many, surprising, and harmful to all classes of financial assets. So, I believe now is the time to begin reducing one’s exposure in the stock market. In other words; it’s time to get the hell out of Dodge City before the new Marshall comes to town: Mr Bear. What should the proceeds be invested in? Gold and Silver, and yes, mining shares too. But make sure you purchase the metal first, and stay away from all ETFs managed by Wall Street banks, as they have no love for you!
Gold’s step sum chart has both gold’s price and step sum’s trends breaking down. That is not good for us bulls.
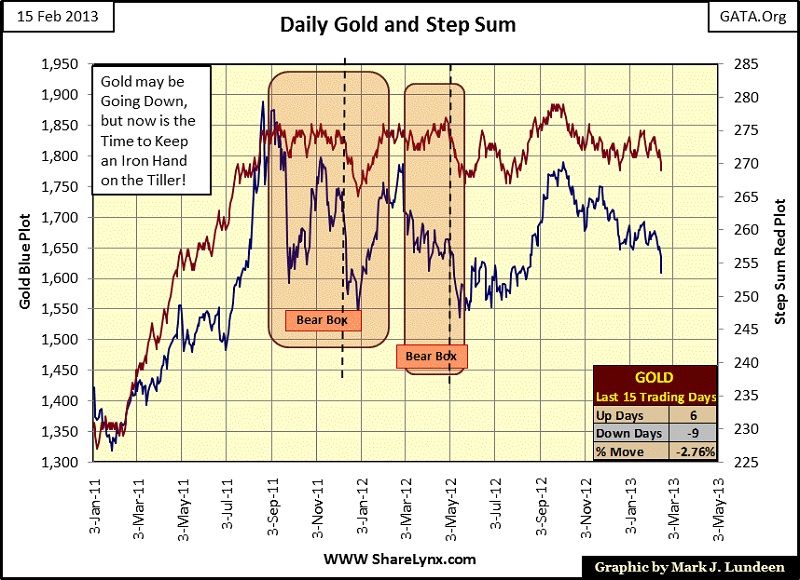
But this is a short-term chart. Gold’s BEV chart is actually encouraging. Why is that? Because this market is driven by futures contracts sold into the market by the big-global banks; and futures contracts written by them are only PROMISES TO DELIVER GOLD FROM BANKS THAT HAVE NO GOLD OF THEIR OWN TO DELIVER! Each contract sold by these banks is a contract they cannot honor if delivery is demanded by their counterparties. So what we are seeing below is the banking system attempting to force their counterparties to close out their positions by driving the price of gold down with worthless promises to deliver gold that doesn’t exist. They have been very successful in doing so many times since 2001, but they are having problems making this scheme work now.
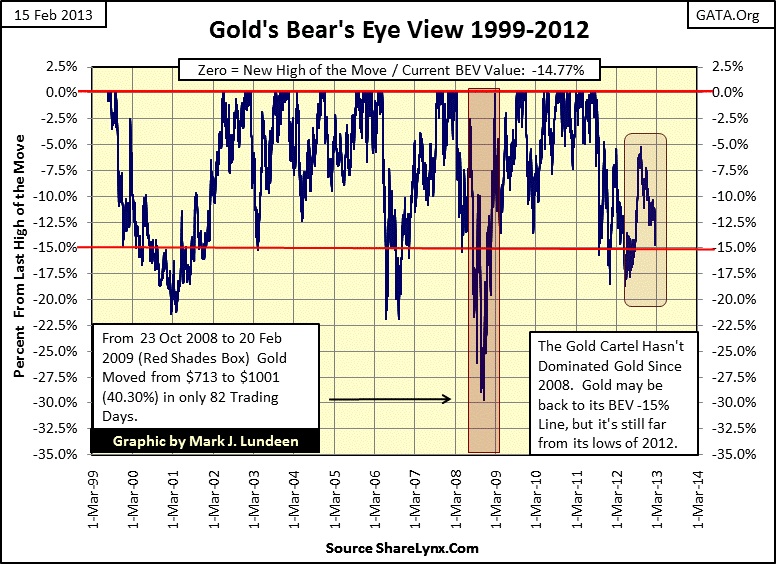
It’s the physical market that is changing the rules of this game. At current prices for gold and silver, Asia vacuums up every ounce of real gold and silver that comes to market. The only reason the price of gold and silver are down today is because the CFTC refuses to enforce their own regulations when it comes to JP Morgan and their ilk. Our worthless government market regulators are allowing banks with no gold and silver of their own to create the appearance of abundance, via paper future contracts, in a world were precious metals are actually becoming scarcer. This will end with the CFTC allowing these banks to declare a force majeure or possibly another government bailout for these crooks.
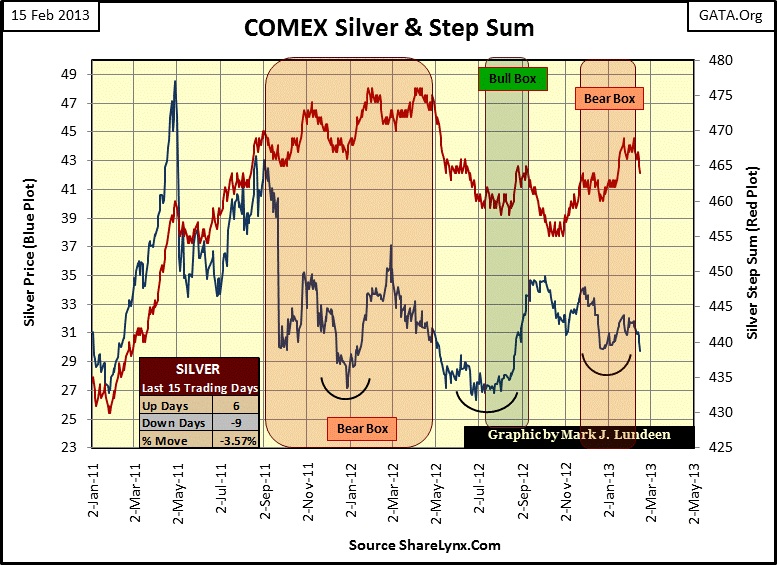
What about silver? Silver’s bear box closed, meaning the divergences between silver’s price and step-sum trends ended when the step-sum trend finally reversed after three months, finally following its price trend down. Well that’s usually what happens when one bets on the step sum’s trend (market sentiment) against the market reality of the price trend. But seeing a step-sum bear box close, as below, is no predictor of how far the price of silver will continue to decline.
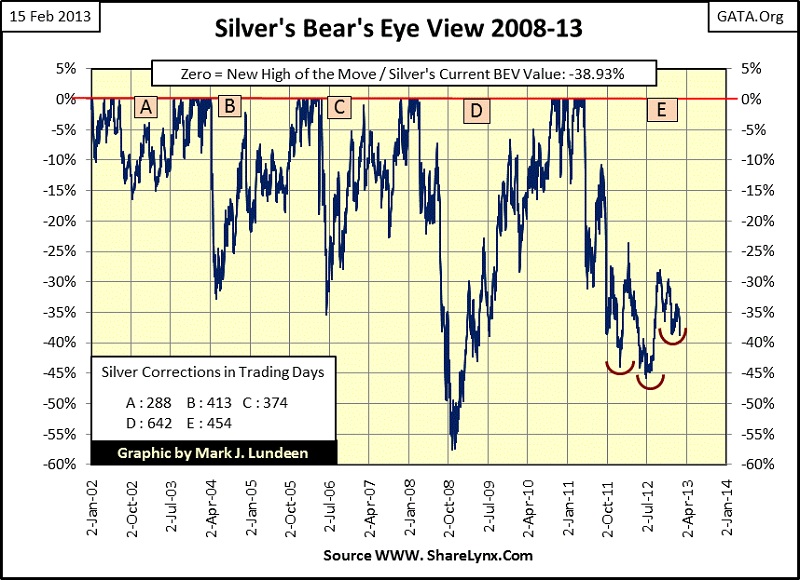
And the price of silver will have to decline a good ways to really damage the silver market’s 12 year bull market, as we see in silver’s BEV chart below. First the silver bears will have to break silver below the lows of last June 2012, where it bottomed at $26.62. That’s about a $3 decline to make that happen. How hard can that be? As the silver market is managed downward by the same people who are now attempting to manage the Dow Jones above it’s last all-time of October 2007; it might be harder than you think.
All in all, I believe today’s low prices for gold and silver are very attractive with limited potential to the downside, and massive potential to the upside. As far as the bond and stock markets go, I give them a strong sell.
Did Interest Rates Bottom in July 2012?
Interest rates have been rising since July 2012, but note how mortgage rates didn’t begin rising until October 2012, three months later. That’s interesting, but not as important as seeing how mortgage rates actually declined during and after the credit crisis. There is something fundamentally wrong with that! Whenever a company’s finances become trashed, the yields for their bonds soar as their bond prices decline for fear of debt reorganization or actual bankruptcy. That’s just how things are. But below we see what mortgage rates did as a multi-trillion dollar industry (mortgage financing) died. Home owners, en masse, tossed the keys to their homes on loan officer’s desks; forever walking away from their monthly payments. So why have mortgage yields dropped 400 basis points since 2008 on that news? Doctor Bernanke has monetized as many abandoned mortgages as it took to make this a reality – that’s why.
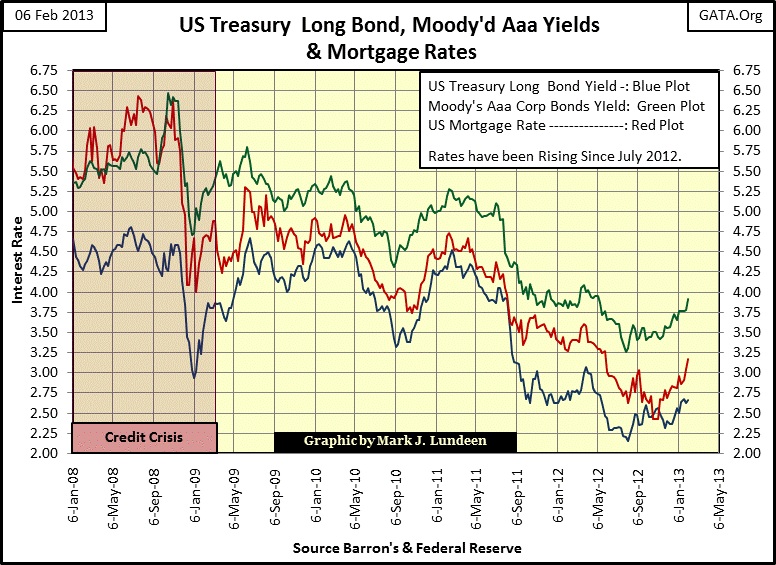
Why is this allowed? Political corruption. The big banks bought the best government the Federal Reserve’s digital dollars could buy to save the banking system. The way the mortgage market functions today is that Doctor Bernanke now purchases abandoned mortgages at face value, and by the tens of billions. These worthless mortgages are transferred from the banking system’s books to the Federal Reserves’ balance sheet, “injecting liquidity” into the banking system in the process so they can function from one day to the next. The monetized mortgages are still worthless, but the Federal Reserve’s books have never been properly audited, or ever will be, so who cares?
There is nothing new under the sun. From Europe’s Reformation of the 16th and 17th century, Martin Luther reports to us on the status of European banking from centuries ago:
“The authorities would do right if they took from such people (bankers) everything they have and drove them out of the country! --- “Kings and princes ought to look into these things and forbid them by strict laws, but I hear that they have an interest in them, and the saying of Isaiah is fulfilled. ‘Thy princes have become companions of thieves.’ They hang thieves who have stolen a gulden or a half gulden, but trade with those who rob the whole world. Big thieves hang little ones; and as the Roman senator Cato said, ‘simple thieves lie in prison and in stocks; public thieves walk abroad in gold and silk.’ But what will God say to this at last? He will melt them together like lead and brass, as when a city burns, so that there shall be neither prince nor merchants any more. That time, I fear, is already at the door.”
I can tell you exactly when the price of gold, silver and mining shares will be freed from the heavy hands of government and Wall Street; when we see US dollar interest rates rise so violently that news of rate increases, and vanishing pension fund and life insurance companies’ reserves becomes a must-report on item for network nightly news. It’s only a matter of time before this happens; however I haven’t a clue when it will. It could be before July, or after the next presidential election. The people who could stop this inflationary Ponzi scheme do not want to take the historical blame for ending it, so it will continue until it can continue no more. And who would blame them for having no desire to face the wrath of the Federal Government and its compliant media. So the media will do as it always does when disaster falls upon us; take their story lines from academics that are in good part responsible for the disaster.
Academics (the people who write history as well as craft “policy”) blamed the depressing 1930s on Wall Street’s stock market crash. But that’s nonsense. The 1930s disaster was caused by the Federal Reserve’s inflationary monetary policies of the 1920s that made this decade roar; policies crafted by academics who after the crash refused to take responsibly for lives they destroyed. So, I expect the triggering event for the next crash will be a failure-to-deliver in the gold or silver markets.
As instructed, the media will dutifully assign responsibility to the long-side speculators who “played with fire” and so caused gold and silver to go up and so ruin the global economy in the process. Small mention, if any, will be made of the “favored financial institutions” (as they were called in 2008) who were encouraged to sell every ounce of someone else’s gold and silver they could get their hands on (including central bank gold reserves) to 100 or more people under the noses of government regulators. No one will be more shock to see what the precious metals “speculators” did to the global economy than our own elected government officials and their regulators. If you enjoyed the dog & pony show Washington had on CNBC for the credit crisis in October 2008, you’ll LOVE the upcoming entertainment Washington has planned when the COMEX sees a force majeure in silver or gold.
So, I expect the lows seen last summer will prove to be the bottom in rates and yields for the post Bretton Wood’s dollar (post August 1971). A “reserve currency” backed by the full faith and credit of a government who has for decades been borrowing and spending itself into history’s largest bankruptcy since Europe’s Reformation of the 16th and 17th centuries. Taking that into consideration, what should the yields for US Treasury Bonds be? Something no “economist” could believe possible, but substantially above the 15% US Treasury Bonds saw in October 1981.
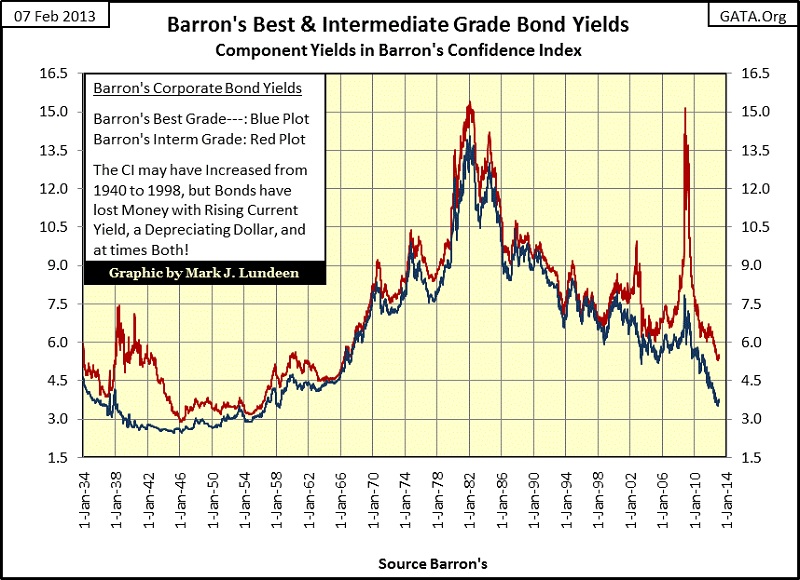
Below is a chart for Barron’s Confidence Index (CI). I covered the CI in depth last year. It’s constructed by taking the yield spread from Barron’s Best Grade and Intermediate bond yields. Barron’s has published its CI weekly since 1938. In the Red Box is my reconstruction of the CI pushing it back to 1934. It’s interesting to review my Dow Jones BEV chart from 1932 to 1942 (above) and see how the CI in the chart below anticipated the 1938 and 1942 bear markets.
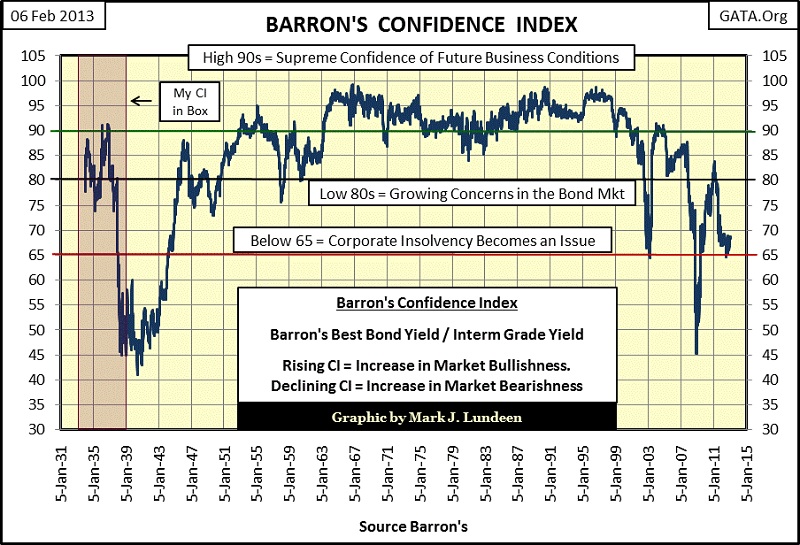
Over its many decades of publication, the CI has proven itself to be a perfectly-horrible bond market-timing indicator. Below, bonds were in a historic bear market from 1950 to 1981 (31 years!), and there is our three decade long bond “bull market”. But darn is I can draw any long-term correlation between the bull and bear markets below and the CI plot above.
However, what Barron’s CI does excel at is informing us when BUSINESS CONDITIONS become challenging, say like during the Great Depression of the 1930s, and our current economic situation. Since the CI first declined below 90 in November 1999, it has plotted the ups and downs of an economy in a distress not seen since the 1930s. Compare CI’s prediction of the future since 2000 with that of its academic competitors employed by the government. For the past thirteen years these government employees have continuously called the end of a recession they couldn’t find in the first place. It really is fair to say that Barron’s CI has actually provided more valuable information on future economic conditions than the government’s bean counters and Ouija board professionals.
So what is the CI telling us now? Since the first week of November 2011, the CI has been below 70, but above 65 and shows no sign of reversing to the upside. That’s a long time for a market indicator to just sit at the edge of impending disaster. What in the hell is the CI doing there? Can’t really say. Hopefully the CI will reverse to the upside signaling the worst is over, but I know that is not true.
Look at what Barron’s Intermediate Grade Bond Yields did before and during the credit crisis; these bonds really slugged investors seeking income hard! And for your information; these are not junk grade bonds. But from 2005 to the peak in the credit crisis, their yields increased from 6% to over 15%, devastating investment principle with no increase in income for the people who purchased these bonds in 2005.
Today it’s almost impossible to receive a livable income from bonds. So, I understand the reason people are now reaching for yield by purchasing lower quality debt. But this exposes them to another “credit event” that is almost certainly coming our way in the near future. As Barron’s Confidence Index data provided a timely warning of the last credit crisis, people now shifting into “high yield bonds” would be well advised to follow the CI’s data weekly. A breakdown in Barron’s CI to below 65 might provide you with yet another timely exit point from low grade bonds, and most likely from bonds in general. What should you do with the proceeds? I really don’t have a clue, other than begin looking for a gold mining company with a decent dividend yield. Don’t ask me which, it’s not my thing.
Mark J. Lundeen
share
share
share
share
share


