A Different Perspective On Gold And Silver


Regular readers will be familiar with the charts used in these reports. The fact that the gradients of all the trend lines used in the analysis are derived from the master line shown as M, nevertheless might not be fully appreciated. That structure reveals underlying symmetry in market prices in that the price tends to react to channels, which will become evident once the reader works to identify the different channels in the analysis and observe how the price repeatedly reacts along these channels. Linear charts have always been used for the analyses, but this week we take a look at long term logarithmic charts of gold and silver to find interesting results.
The software being required conversion of the data to make exponential charts; the results are exponential, even if the price scale is still linear. Initially it was doubtful whether similar channels to what are seen on the usual charts would also appear on log charts. However, the results were a surprise. The channels, again derived from the same master gradient, not only fit the charts very well, but a most important part of this phenomenon – the ratios of the channels – apply accurately as well.
The first chart shows two channel sets – the set ABCD which runs across the main trend and appears to play a role during significant corrections and the set XYZ that encloses the full trend since about 1992, first bearish and then the bull trend.
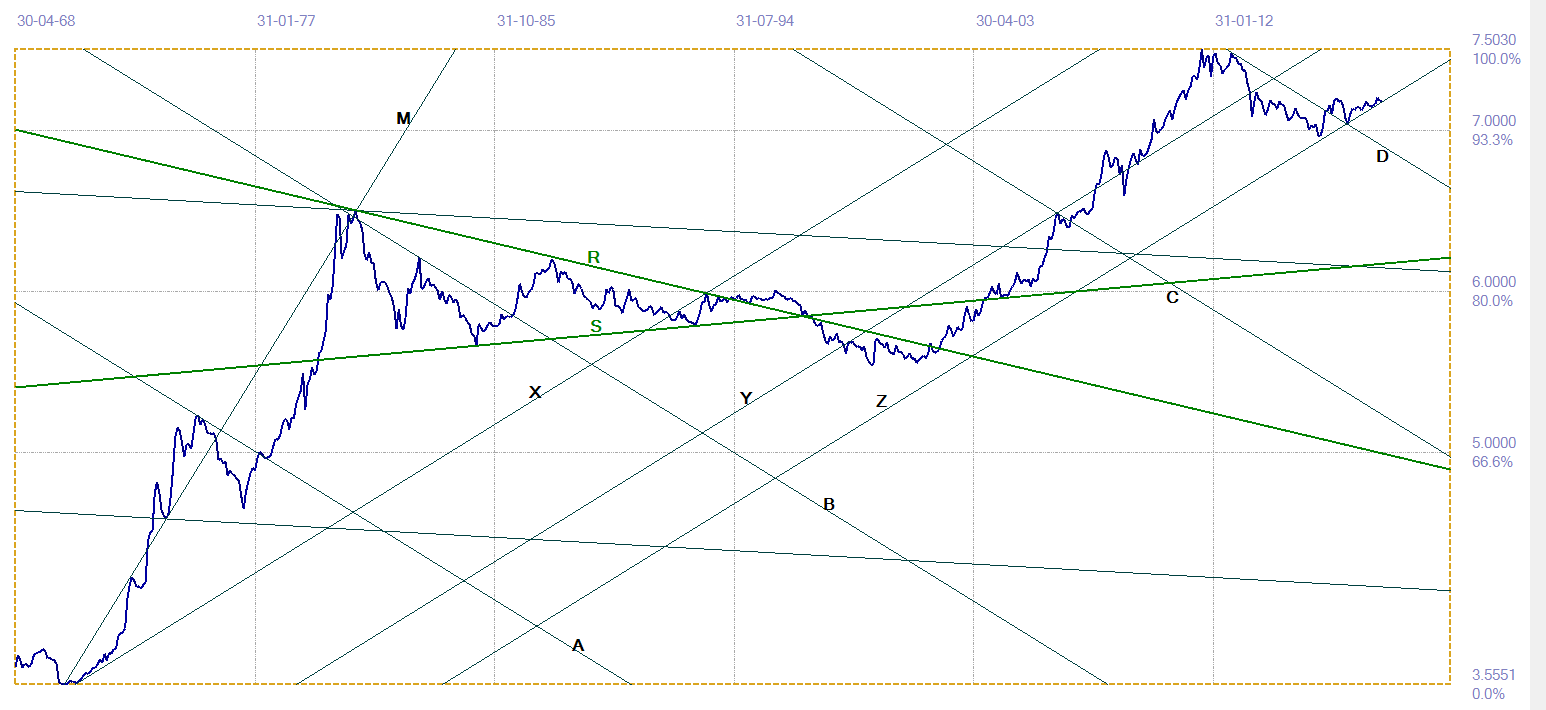
Log chart of gold price monthly close since 1968. Last = $1317.85
The triangle RS developed after the 1980 high in the price and as triangles tend to do, it completed five legs from side to side; shortly after the end of the fifth leg the price broke above the triangle and also clear above the $400/oz level that had been top resistance for about 2 years. That break higher, early in 1996, posed a serious threat to the then strong dollar policy of the Clinton-Rubin strategy to boost the US economy and ensure a Clinton second term. It triggered the actively pursued gold carry between bullion and central banks that flooded the market with bullion and which soon ended and reversed the gold rally, As time passed, announcements by Switzerland and the UK that they intended to sell much of their gold, the price of gold slipped lower to reach about $250 by 2000.
Since then, the price of gold has kept to bull channel XYZ, finding support on line Z and also at line D in December 2016. The rally during 2017 and into 2018 has kept marginally above the support of line Z, which has been tested all the time. Now the price has to be above $1320 at the end of March to hold in the channel.
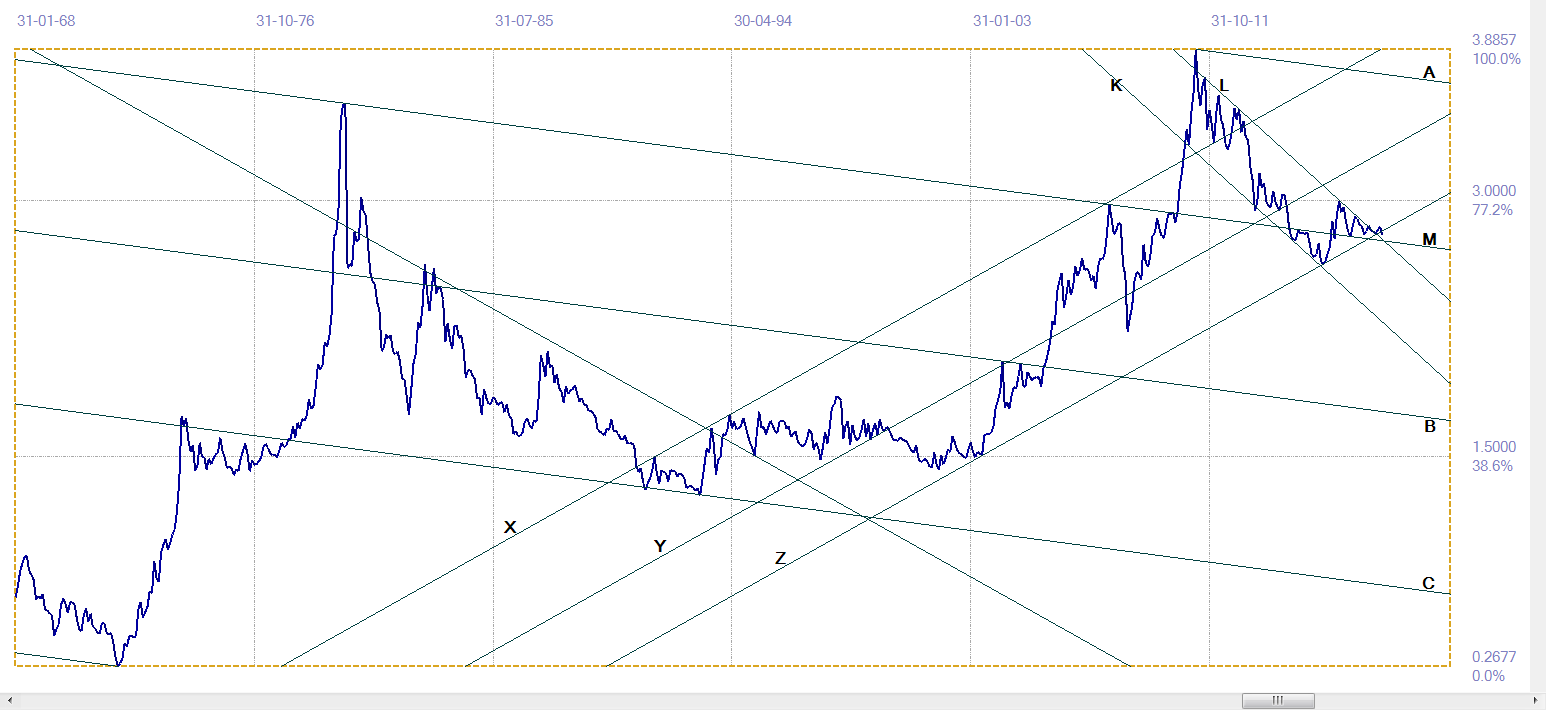
Log chart of silver price monthly close since 1968. Last = $16.44
As is to be expected, the price of silver displays much greater volatility than that of gold. However, here too a bull channel is in place since the early 1990s, which has held well to the price except for the break higher at the end of the steep 2008-2011 bull market, that failed to hold. The price then held to bear channel KL under the sustained attack on precious metal prices that soon followed. Support at the end of the bear trend came in from the bottom of the bull channel to trigger a rally, first to break above master line M and then also barely above bear channel KL.
The price of silver has to be at or higher than $16.92 at March end to hold within channel XYZ. Should weakness persist, then line M offers support at $15.84, while if there is to be a goodbye kiss on line L before the bull market resumes to price has to end the month at $15.81 and then reverse higher.
It would seem the March and perhaps also the next few months are very important in terms of these analyses of the log scale charts of the metals. The prices quoted for the support levels apply to the trend lines, but there is always some leeway as well as the possibility of a marginal and usually quite brief break below a trend line. A break below line Z on the silver chart to briefly touch lines L and M, if that were to happen, would be an example of a false break below a significant chart pattern.
The regular charts in the weekly re[orts have for quite some time revealed that the prices of gold and silver were exhibiting brinkmanship, often dipping below some key support to give a bearish signal, only to continue to cling to the support. This testing of support indicates the effect of sustained selling pressure that has been in play since earlier in 2017. There is of course no clear indication when this will end.
Back in 1996, suppression of the gold price commenced through the gold carry, as bullion banks leased gold from central banks at about 0.5% interest and then sold the gold to invest in US Treasuries that at that time paid interest of 6% and more on long dated Treasuries. Of course all the banks faced some risk should the gold price kick higher, as it did during the Asian and Russian crises. Announcements by Switzerland to sell half of their gold and by the UK that was to hold regular auctions of much of its gold helped the bear market to resume.
When the price reached $250/oz and mines either closed or limited production to high gold content ores, the carry was no longer prudent and in due course the gold price had to be allowed to increase. The banks then commenced use of the Comex futures market to control the rate of ascent and to reap profits on the way higher. The steep rise in the price of gold into 2011 triggered real panic, as judged by the great pressure that was placed on gold and silver to reverse their trends and then sustained into a 5 year bear market that effectively only ended at the end of 2016.
However, since the turn of the century the banks built a short position in the metals that carries much risk should something happen to launch a major bull trend in either or both the metals. It might well be that the old reason for the suppression, to protect the US dollar, no longer is as important as when the ‘strong dollar’ policy was alive and well. Even so, the banks face a problem of possibly extreme financial risk should metal prices explode and force them to cover their short positions at much higher prices. It is well known that in a short squeeze financial sharks often rush in to spike prices much higher, to reach previously unforeseen lofty levels.
While initially the price of gold was the object of suppression, fundamentals have changed over the years so that now it is believed by many that silver has become the real threat since it is being consumed in industry at a high rate relative to what is produced by mines that mostly have silver as a by-product to their main activity. There are thus relatively little reserves above ground and it is no wonder JP Morgan is reported to have acquired a stockpile of hundreds of millions of ounces of silver. They are however other big banks and other large players who are short of silver. That means the pressure on the metals can be expected to extend until some event or development in one or both markets causes their prices to break free.
In general, markets appear to have gone into hibernation, with frequent twitches to show that whatever they dream they are not enjoying peaceful sleep. Most of the markets experience significant volatility, but remain trapped in a sideways band as if waiting for clarity on what the future might hold for them before they can decide on a definite direction.
Euro-Dollar
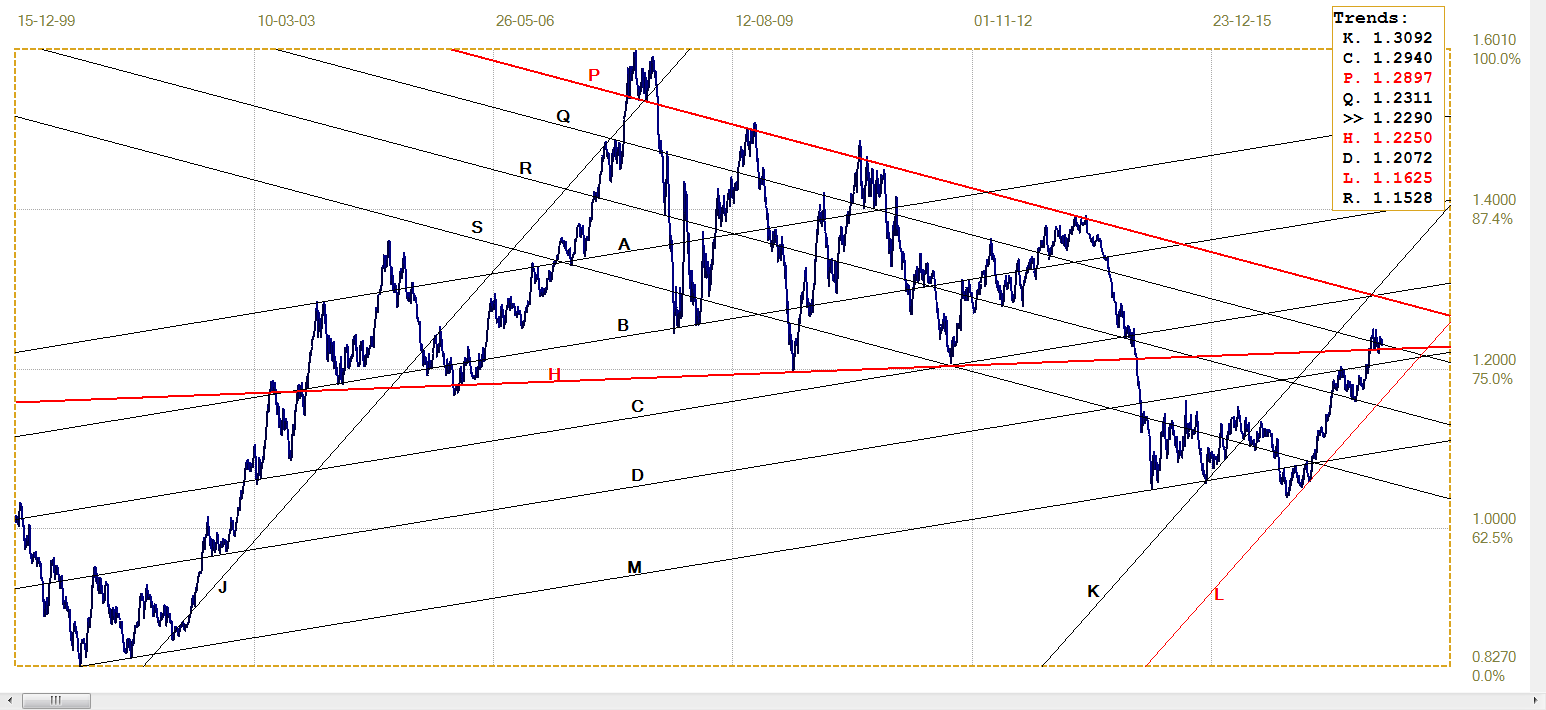
Euro-dollar, last = $1.2290 (www.investing.com)
This chart offers a good illustration of the tight range in which many markets have remained in during the past few weeks. Following the break above resistance along line H ($1.2250), with only a minor and brief break lower again, the euro has been stuck in the close vicinity of line Q ($1.2311). The euro continues to have a bullish outlook as long as the support of line H holds.
DJIA
The DJIA still experiences high intra-day volatility. There is no clear trend at all and this can continue until either a new rally takes off or there is a definite break below line L (24 675) to signal a bear trend.

DJIA, last = 24946.51 (money.cnn.com)
Gold PM fix - Dollars

Gold price – London PM fix, last = $1310,10 (www.kitco.com )
The monthly chart discussed in the introduction has a price of $1320 as key support for gold by month end. Friday’s London LM fix at $1310.10 is the lowest fix of last week, but is not far below that critical month end price. That fix has taken the price below the support of line L ($1318) by about the same margin of recovery needed for gold to hold the bull channel on the monthly chart. Time will tell.
Euro-gold PM fix
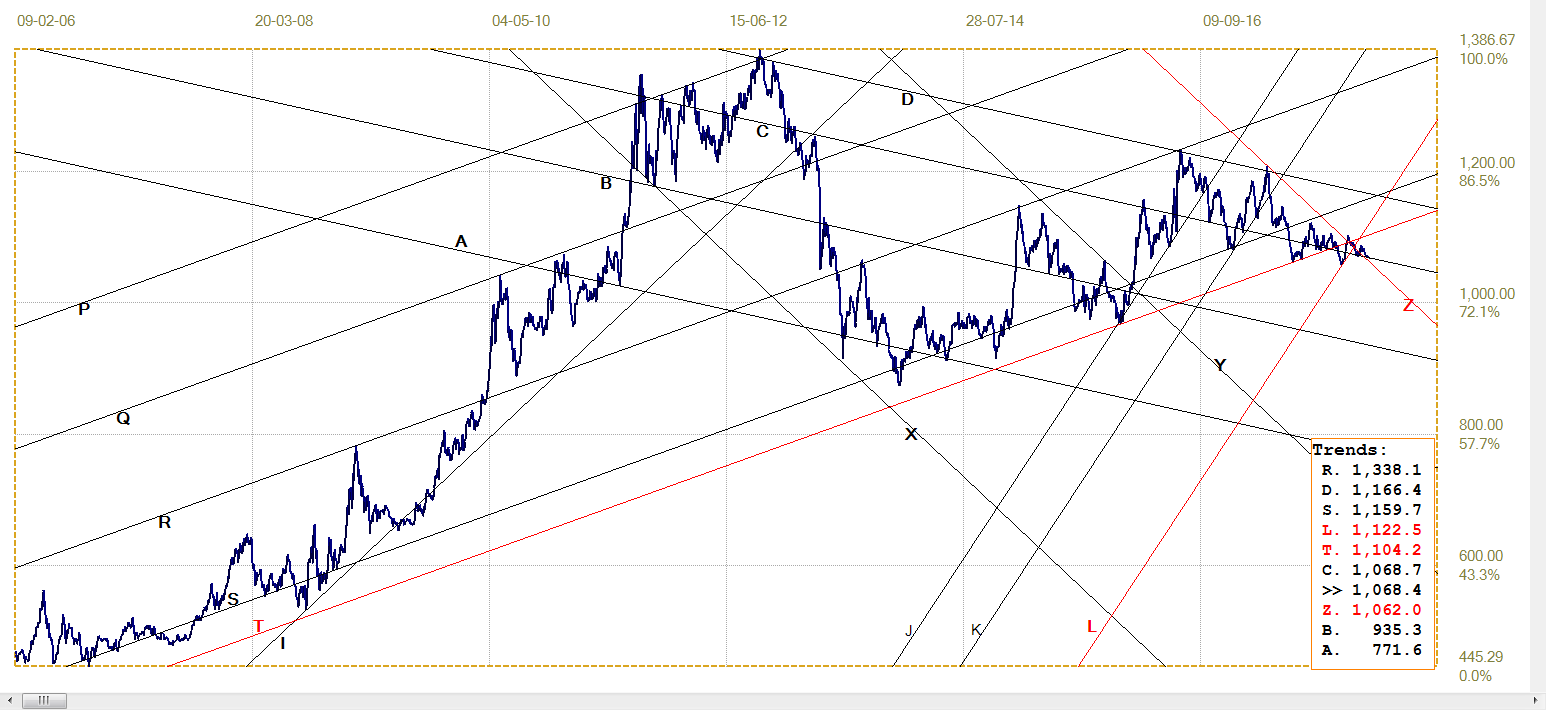
Euro gold price – PM fix in Euro, last = €1068.4 (www.kitco.com)
For some time now, after the break below bull channel KL (€1123), the euro price of gold has been more precarious even than the dollar price. The marginal break above bear channel YZ (€1062) held at support of line C (€1068); fresh weakness however has the price again testing the support at line C.
The technical outlook for the dollar index [not shown] has more general weakness for the currency as a possibility. Should the euro also benefit if the dollar resumes its weaker trend against global currencies, the stronger euro would cause the euro price of gold to break lower – unless the dollar price of gold finally can rally off the support it is testing on both the daily and monthly charts.
A recovery for the euro price of gold out of the tight sideways trend – if that should happen – has to return to bull channel ST (€1104) to confirm that the gold price in euro is again in a clear rising trend.
Silver Daily London Fix
Silver daily London fix, last = $16.475 (www.kitco.com)
Following the break below support along line L ($17.74) after trying hard to hold on, silver technically resumed the medium term bearish trend, but then turned in a steady sideways and tightly range bound direction. It is almost as if there now is a standoff between the bulls and the bears, with the rising open interest on Comex as a weather gauge that shows accumulation of long positions.
One can almost expect a significant amount of selling soon now that the OI is back above 200k and rising. At this rate it could test the all time high OI above 225k in the not too distant future – if the bulls continue to the exploit the opportunity of a steady price to add to their positions.
U.S. 10-year Treasury Note
The bear trend in the 10-year US Treasury ended with the recent steep rally in the bond market, which took the yield on the 10-year note below steep line L (3.053%) to end and reverse at line R (2.820%). After a bounce, the yield again moved lower and again failed to break below line R, with a slight reversal higher late last week as a possible sign that the rally might not extend.
Given the reported improving economic outlook that adds credibility to expectations for up to 4 more interest rate hikes starting this month, it would not surprise if the yield resumes its upwards trend. In that case, the nearest technical target would be line Q (3.036%), close to where line L is situated at the moment.
U.S. 10-year Treasury note, last = 2.845% (www.investing.com )
West Texas Intermediate crude. Daily close
WTI crude – Daily close, last = $62.34 (www.investing.com )
Similar to most of the charts in this week’s US markets, the price of crude is also trapped in a rather tight sideways consolidation. The price is still holding in the very broad bull channel KL ($59.38) and oscillating around line R ($62.32). There is no clear direction to anticipate, but a bullish bias is more likely while the support of line L holds.
¬2018 daan joubert, Rights Reserved chartsym (at) gmail(dot)com
********


