DJIA – Miracle Recovery Or Hoax?


On Friday, the DJIA closed at 18516.55 to set a brand new all-time high; this after plummeting by 611 points to 17400 points only ten trading days earlier, when the Brits unexpectedly voted to leave the EU – an outcome that before the referendum was predicted should it happen would devastate western economies. No devastation followed; instead stock markets took off like scalded cats to set new highs as if the promised land of growth and new wealth was upon us. Do we now look back on the new miracle recovery despite all the bad omens, or is this merely a hoax performed on investors by the all-wise, all-knowing central banks who cannot allow that they are shown to be fallible in their management of the economies? Herb Stein from the Reagan era said that when something cannot continue indefinitely, it will stop. This is so simple that it has to be true. The question then is whether the central banks – with the Fed in the lead – can support the stock markets indefinitely. Or not.
The answer to that question is the same as when it is asked whether any other of the major markets can be manipulated against their natural trends – indefinitely. Gold and silver come to mind as one example where during three decades of most active price suppression their efforts failed in 2001 and for good measure again in 2016 after their desperate new campaign that had started in 2011. As it happens, it is also since that time that Wall Street experienced the steep miraculous recoveries whenever there was a sell-off as we have seen again the past week after the Brexit induced weakness.
The 18000 level became a threshold that was difficult to breach and so far proved impossible to hold and extend higher. It was quite evident that any decline below that level – of which some were sudden and steep – was met with sustained, day after day effort to get the DJIA back above 18000; presumably to inform people on Main Street that all was well with the economy. Of course, sellers of equities soon realised this and unloaded their stocks whenever the DJIA broke above that level, with the results that so far the penetrations higher did not last long. It now remains to be seen if this break higher will be the exception that lasts.
Perhaps in due course someone will discover and reveal what it was that frightened the PTB in 2011 so much they felt compelled to embark on an intense campaign of widespread intervention in so many major financial markets – to prevent what? In April the dollar index took off from below 74 to reach 100 in due course. And in May the euro topped out at $1.4875 - and subsequently fell steeply. To be sure after a recovery from $1.206 to $1.39, a collapse later saw the euro below $1.05. Gold and silver also topped out in mid-2011 to decline over time by about -44% and -70% respectively, before the start of a new bull market in 2016. Five years of intense manipulation that today still has the US dollar not far from its highs. Moreover, we see a record low yield on the US 10-Year Treasury note and Wall Street at a new all-time high.
For the precious metals the tide has already turned. Moreover, the dollar is no longer as over-powering as it had been. And the yield on the 10-year is following a global example that has negative yields all over the place. It is only the DJIA as the prime indicator of US economic health that still responds to efforts to paint a positive picture. But for how long still?
Euro-Dollar
The new tentative support line for the euro was added to the analysis last week on the off chance that it would rebound higher off that support. More weakness last week just failed to break lower, holding right at that support at line L ($1.1036). If the euro does break lower this week, it will indicate further woes for Europe. There is the rumour about Deutsche Bank being on the skids, but many other things could cause the euro-currency to weaken further: i.e. more acts of terror, new troubles out of Turkey, anti-migrant feelings running higher in some countries and others. Europe, like many other regions, all have various powder kegs with lit fuses.
A rebound higher off line L and a recovery back above line V ($1.1242) would signal that the troubles in Europe are contained and of now immediate threat. However, this is a situation that could change overnight!
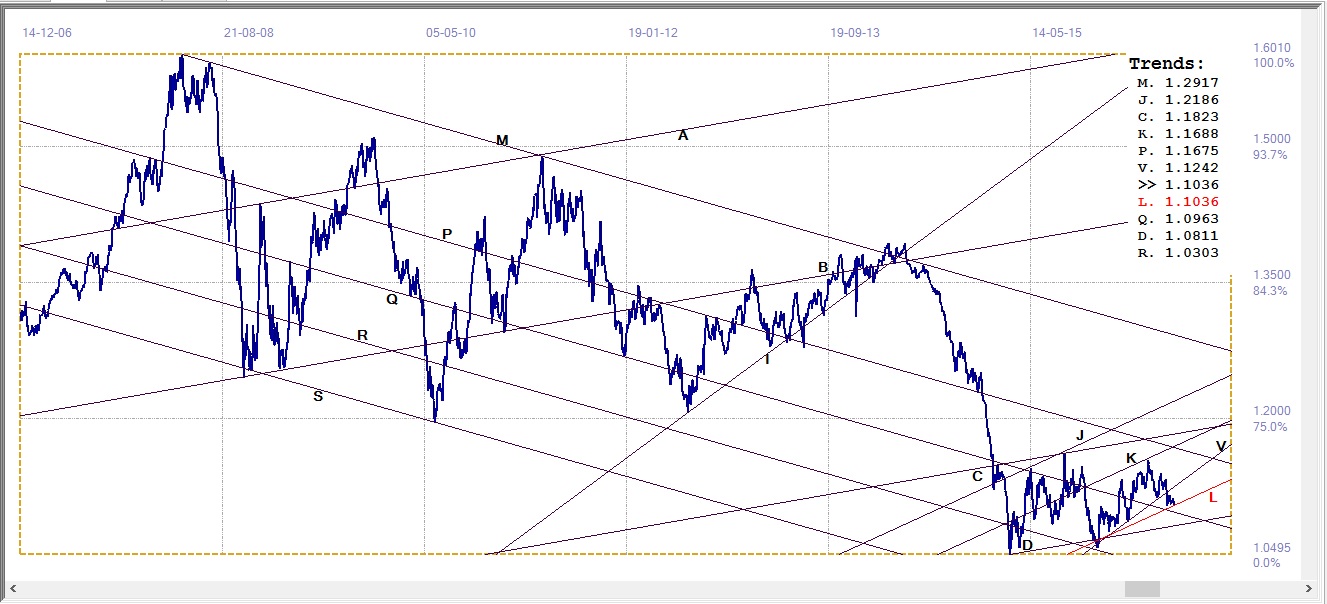
Euro-Dollar, last = $1.1036 (www.investing.com)
Dow Jones Industrial Average (DJIA)
18000!! Again, after the steep sell-off – and this time setting a new all time high!! Now it is a matter of waiting to see if the break higher can hold this time.
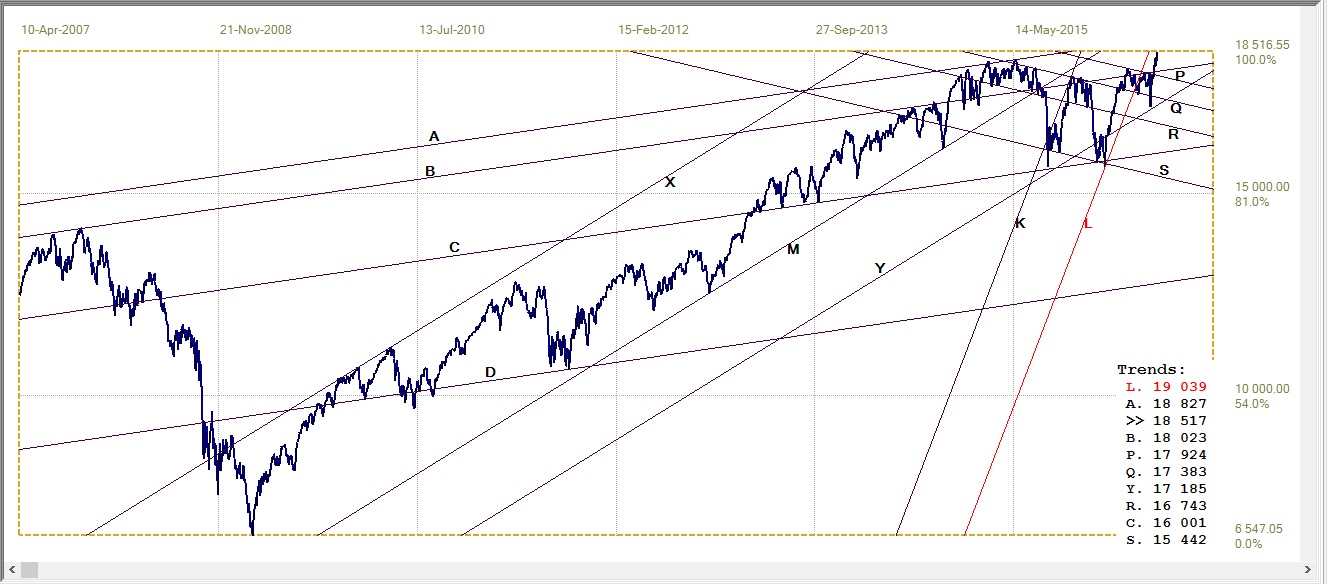
Dow Jones Industrial Index, last = 18537 (money.cnn.com)
Gold PM Fix - Dollars

Gold Price – London PM fix, last = $1327.0 (www.kitco.com)
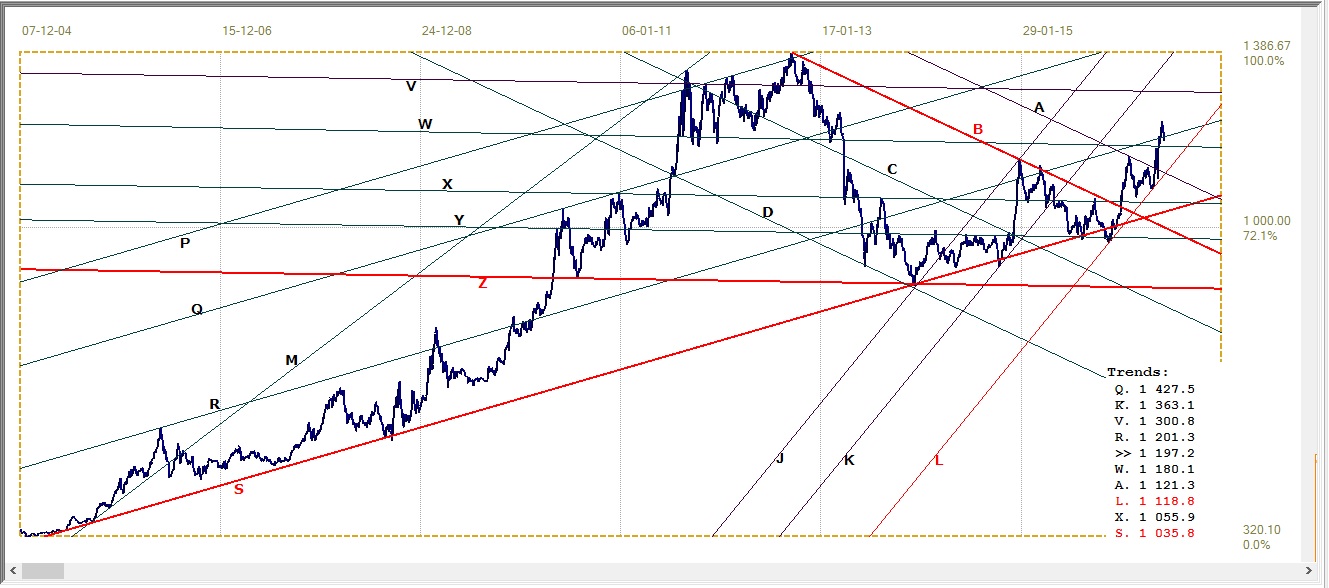
The new bull channel, KL ($1262) held firm when tested. The new rally off support at line L broke clear above lines C ($1283) and Q ($1288), reaching higher to test the resistance at line V ($1384), lower boundary of the old and steeper bull channel that recently failed to contain the new bull market. Failure to break back into that older channel is a disappointment, but rallies also do not continue indefinitely and have to stop at some time.
However, that does not mean the new bull market has ended; only that support at line L, if tested again, has to hold so that a new reversal higher can again challenge the resistance at line V.
Steep runs in any market typically results in a pull, back as soon as the price over-shoots what a majority of traders/investors consider to be a reasonable advance. It seems that the resistance at line V is now a signal that gold could settle for some time before the bull market in the new channel KL can resume. Should the price manage a recovery into the old and steeper bull channel, it has a $100 gap before the next key resistance at line B ($1461) is reached.
Gold PM fix – Euro-Gold
Euro Gold Price – PM Fix in Euro, last = €1197.2 (www.kitco.com)
Last week the euro price of gold failed to hold the break above resistance at line R (€1201) of the week before. While the euro closed last week at a low against the US dollar, it was the price of gold that declined even more than the euro to drag the euro price of gold back below the new support at line R.
However, bull channel KL (€1119) is not under any threat at the moment in it can be anticipated that the new bull market should continue higher in due course.
Silver Daily Fix Chart

Silver Daily Fix, last = $20.14 (www.kitco.com)
Silver has become a star performer since at first lagging gild during the 2016 bull trend in the precious metals. It rebounded steeply off the steep support at line V ($18.22) to break above resistance at line Q ($19.22) and then, when prices pulled back after the surprise of Brexit had abated, rested right on the new support line R without breaking lower.
The rebound higher then held steady above $20/oz. Silver’s persistence and its high open interest that so far refuses to succumb to the attack on the price, supports the long held contention that silver is a bigger threat than gold to the Banks that have expended so much effort over the years to keep the precious metals contained. The signs are there that their time is running out.
US 10-year Treasury Note
The yield on the US 10-year Treasury note has now rebounded higher off the recent record low it has reached – probably more a result of panic than part of a deliberate attempt to force US near term yields also into negative territory. If that is correct, it would imply that investors have come to (mostly?) believe the Brexit scare was just a damp squib and that central banks have again made the financial world safe for investment and trading.
That would also imply that all the anti-Brexit rhetoric and warnings before the 23rd of June was no more than that – chasing up ghosts and economic disasters simply to influence the voting. There was no real problem with Brexit and in fact the world now seems a better place for it.
The steep rebound ended a fraction above key support at line Q (1.547%); it has to continue higher to confirm that the panic is over. If the yield reverses lower off line Q again, it would be a warning that there is still a good deal of unease ‘out there’ in the world. It would be premature to sit back and wait for the good times to return.

US 10-year Treasury note, last = 1.558% (www.investing.com)
West Texas Intermediate Crude. Daily close
The psychologically important $50 level is moving further out of reach now that the price of crude has broken below the support at lines D ($46.70) and T ($46.63) and is holding there. The initial break below bull channel UV ($53.90) was bearish and it was confirmed by the breaks below lines D and T.
There is clearly over-supply of crude in the world, but it appears less certain that it is due to increased production and not diminishing demand as the global economy is slowing down. If the latter, it could still be some weeks before statistics from official quarters either confirm or deny that suspicion.

WTI crude – Daily close, last = $45.95
(Investing.com)
©2016 daan joubert, Rights Reserved
chartsym (at) gmail(dot)com


