The Dow Jones vs Gold, 1970 to 2025


I thought I’d start this week off a bit differently, so I’m beginning with my Dow Jones to Gold Ratio chart. This chart illustrates how since the dollar’s link to its $35 gold peg was broken in August 1971, the Dow Jones and gold, have for the most part been counter cyclical to each other.
This chart is simple enough;
- rising ratio = Dow Jones (stock market) is stronger than gold,
- declining ratio = gold is stronger than the Dow Jones.
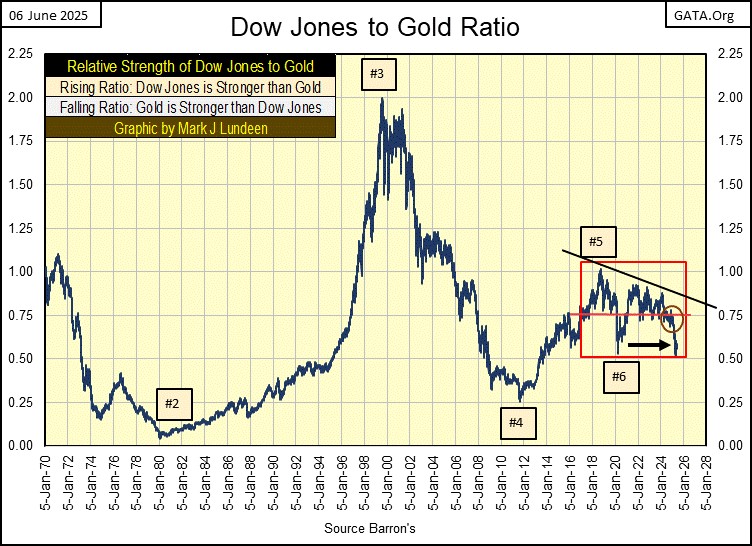
Here are the highlights in the chart above;
- Gold’s 1970-80 bull market is clearly seen (#1 to #2).
- The big-bull market on Wall Street, from 1982 to 2000, is also evident (#2 to #3).
- After 2000 (#3), the Dow Jones continued advancing, but the ratio was declining, as the Dow Jones wasn’t advancing as much as was the price of gold.
- Point #4, marks August 2011, where the first phase of gold’s bull market advance topped, marking the start of a 45% market decline in the price of gold for the next three years. So of course, the ratio began rising once again, as money invested in the stock market (Dow Jones) did better than did money invested in gold, during its 45% bear market decline.
- Point #5 marks September 2018, where for the next seven years, neither the Dow Jones or gold established a clear trend in market leadership, as the ratio became range bound within the red box.
Let’s look at this red box a little deeper. Since 2018, each time the Dow Jones attempted to advance the ratio, each attempt’s top was a bit weaker than the attempt before, as seen with the declining-trend line.
Gold attempted to break out of the red box in August 2020, but showed little effort to do so again for the next three years. But beginning in 2024, gold is making its second attempt to break out of this box, with a ratio of less than 0.50. Something that did happened in April of this year, with four daily closings below 0.50. Since then, the Dow Jones to Gold Ratio has backed back up into the fifties, and we are now waiting to see what is to come of this ratio in the weeks and months to come.
Below is a graphic containing the BEV charts for both the Dow Jones and gold, since October 2022 to today. Each chart entered into scoring position in November 2023. This is something odd for two markets that historically, are counter-cyclical to each other.
Since November 2023, the Dow Jones has seen fifty-five, daily BEV Zeros (0.00% = new all-time highs), the last on December 4th 2024, six months ago. While since November 2023, gold has seen sixty-five new BEV Zeros, the last on April 21st 2025, just a few weeks ago.
I placed a Black Rectangle covering the range of trading days the Dow Jones was making new all-time highs in its BEV chart below, and expanded this rectangle down into the BEV chart for gold, to compare the market advances between these two markets.
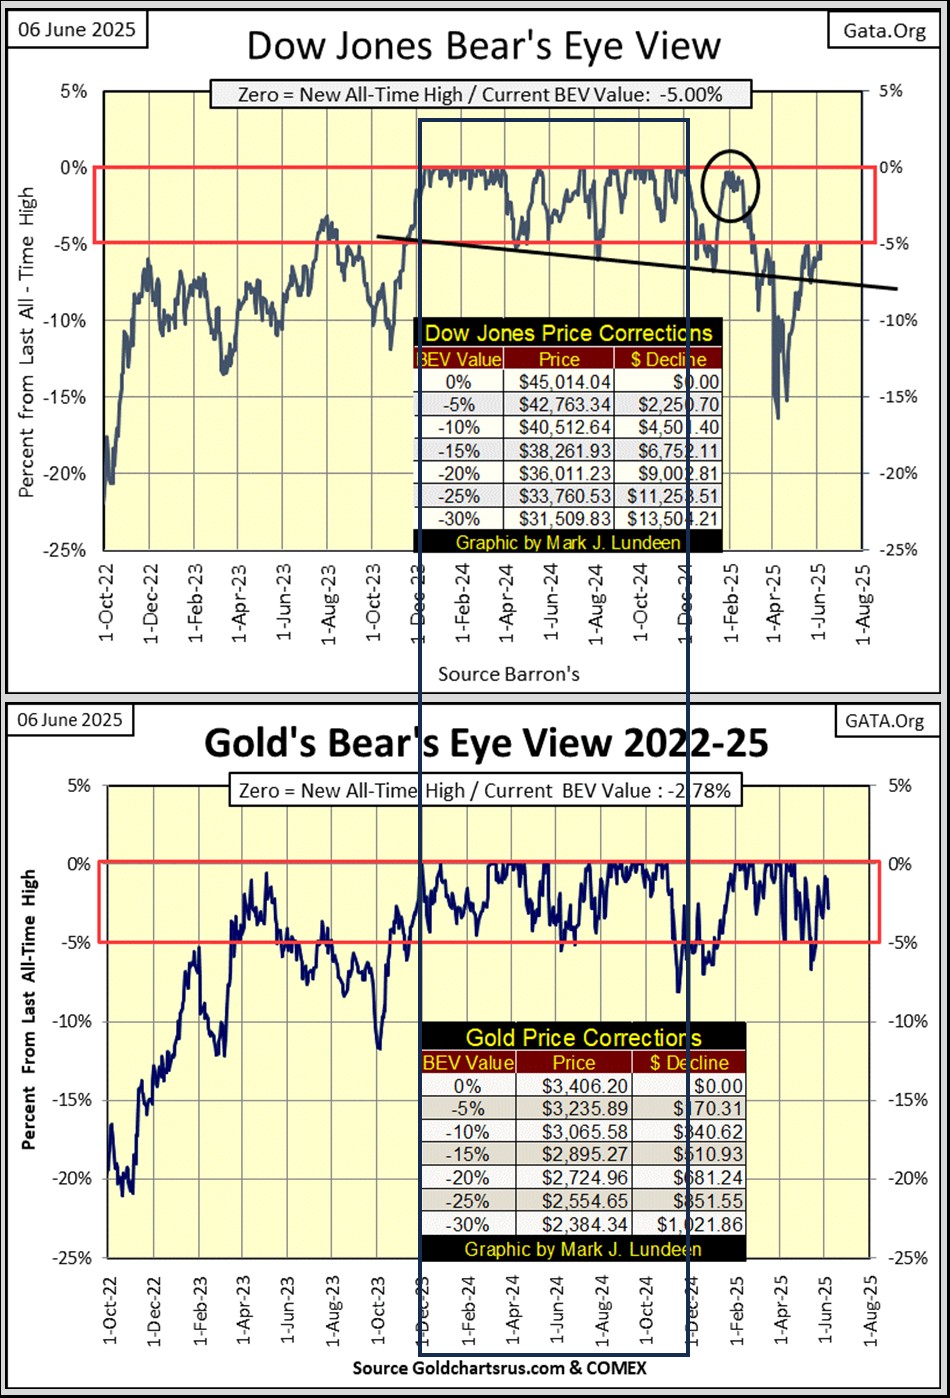
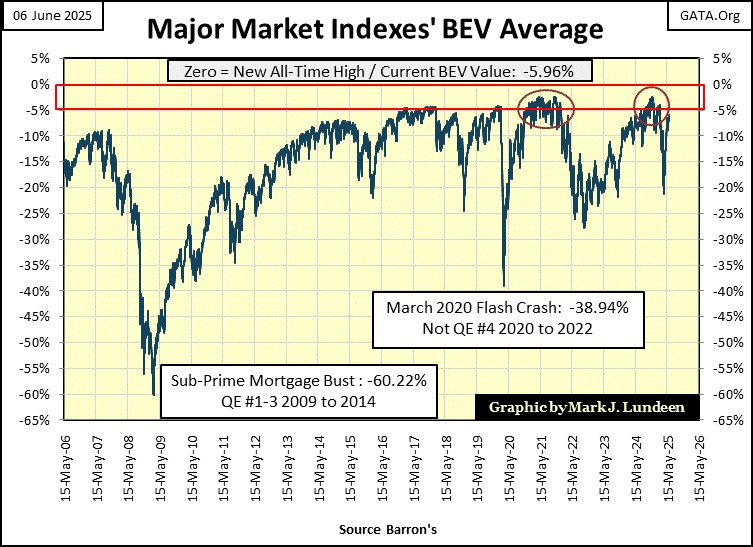
Since February, the Dow Jones has found remaining in scoring position increasingly difficult. At the close of this week, the Dow Jones closed with a BEV of -5.00%, which is NOT in scoring position, but damn close to being in it. Looking at the Dow Jones BEV chart above, in the past few months it’s been here before, and on each attempt, failed to break into scoring position. This is a bad habit, for a market attempting to advance to new all-time highs in the months to come.
Moving now to gold’s BEV chart above, it looks really good, and I’m expecting gold to make additional new all-time highs in the weeks and months to come.
This is something the Dow Jones could do too. At this week’s close, the Dow Jones was only 5.00% from its last all-time high. In a bull market, how hard is it for something to advance 5% to make a new all-time high? That is something that happens all of the time in a bull market. But in early June of 2025, I can’t say whether or not the Dow Jones is in a bull, or a bear market. So, I just watch and wait for what will happen in the coming weeks and months.
Returning to the first chart in this article, on the Dow Jones to Gold Ratio. Historically, the Dow Jones and gold have been counter-cyclical to each other; meaning when one is doing well, the other isn’t.
Since 2018, these two markets have failed to establish leadership of one over the other. Since 1970, these past seven years have been very odd, compared to their historical norms. Should gold break out of its box, with a Dow Jones to Gold ratio of below 0.50, and keep going down, that would be very good for gold, and possibly very bad for the Dow Jones, my proxy for the broad stock market.
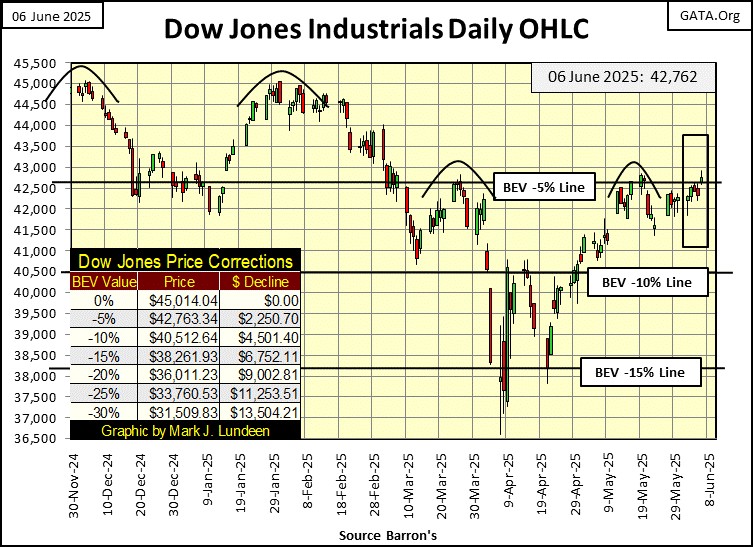
Here is my Dow Jones plotted in daily bars below. It doesn’t fit into the narrative of this article, but it’s a good chart to post weekly. This chart really makes clear the problem the Dow Jones has had, breaking above the line-of-resistance at 42,763, or its BEV -5% line. The Dow Jones at the close of this week, failed to do so by less than a dollar. Is this a joke?
Next are the BEV values for the major market indexes I follow in the table below. No new BEV Zeros to be seen, though twelve of these indexes closed the week within scoring position. It’s been like this for weeks now; many indexes in scoring position, that somehow never advance into new BEV Zeros. Except for the NYSE Financial Index, which has seen a few recent new all-time highs, but nothing else has. What’s with that?
Look at the plot for the average BEV for these indexes (#15 in the table), it closed the week with a BEV of -5.96%. As seen in the chart below, that is high. Logically, these indexes should be seeing multiple new all-time highs with an average BEV that high. But they aren’t. Very odd, and I don’t like very odd.
Personally, I think of this time as an excellent opportunity to exit the market, as it is offering very attractive prices for selling your position. It could also make sense to hold on to some of your position, should the stock-market bulls come out again. But I’d have strict stops on your positions, to keep any potential losses at an acceptable minimum. However, this is not a time to expose any new money to the massive risks this market offers. There is one exception to that.
Hey! Look at the XAU, which closed the week at #18, only 11.19% away from its last all-time high of April 2011. For over a decade, the XAU was Tail-End Charlie in this table, at #21. A stigma now applied to the NASDAQ Banking Index, whose last all-time high (BEV Zero / 0.00%) was in November 2023.
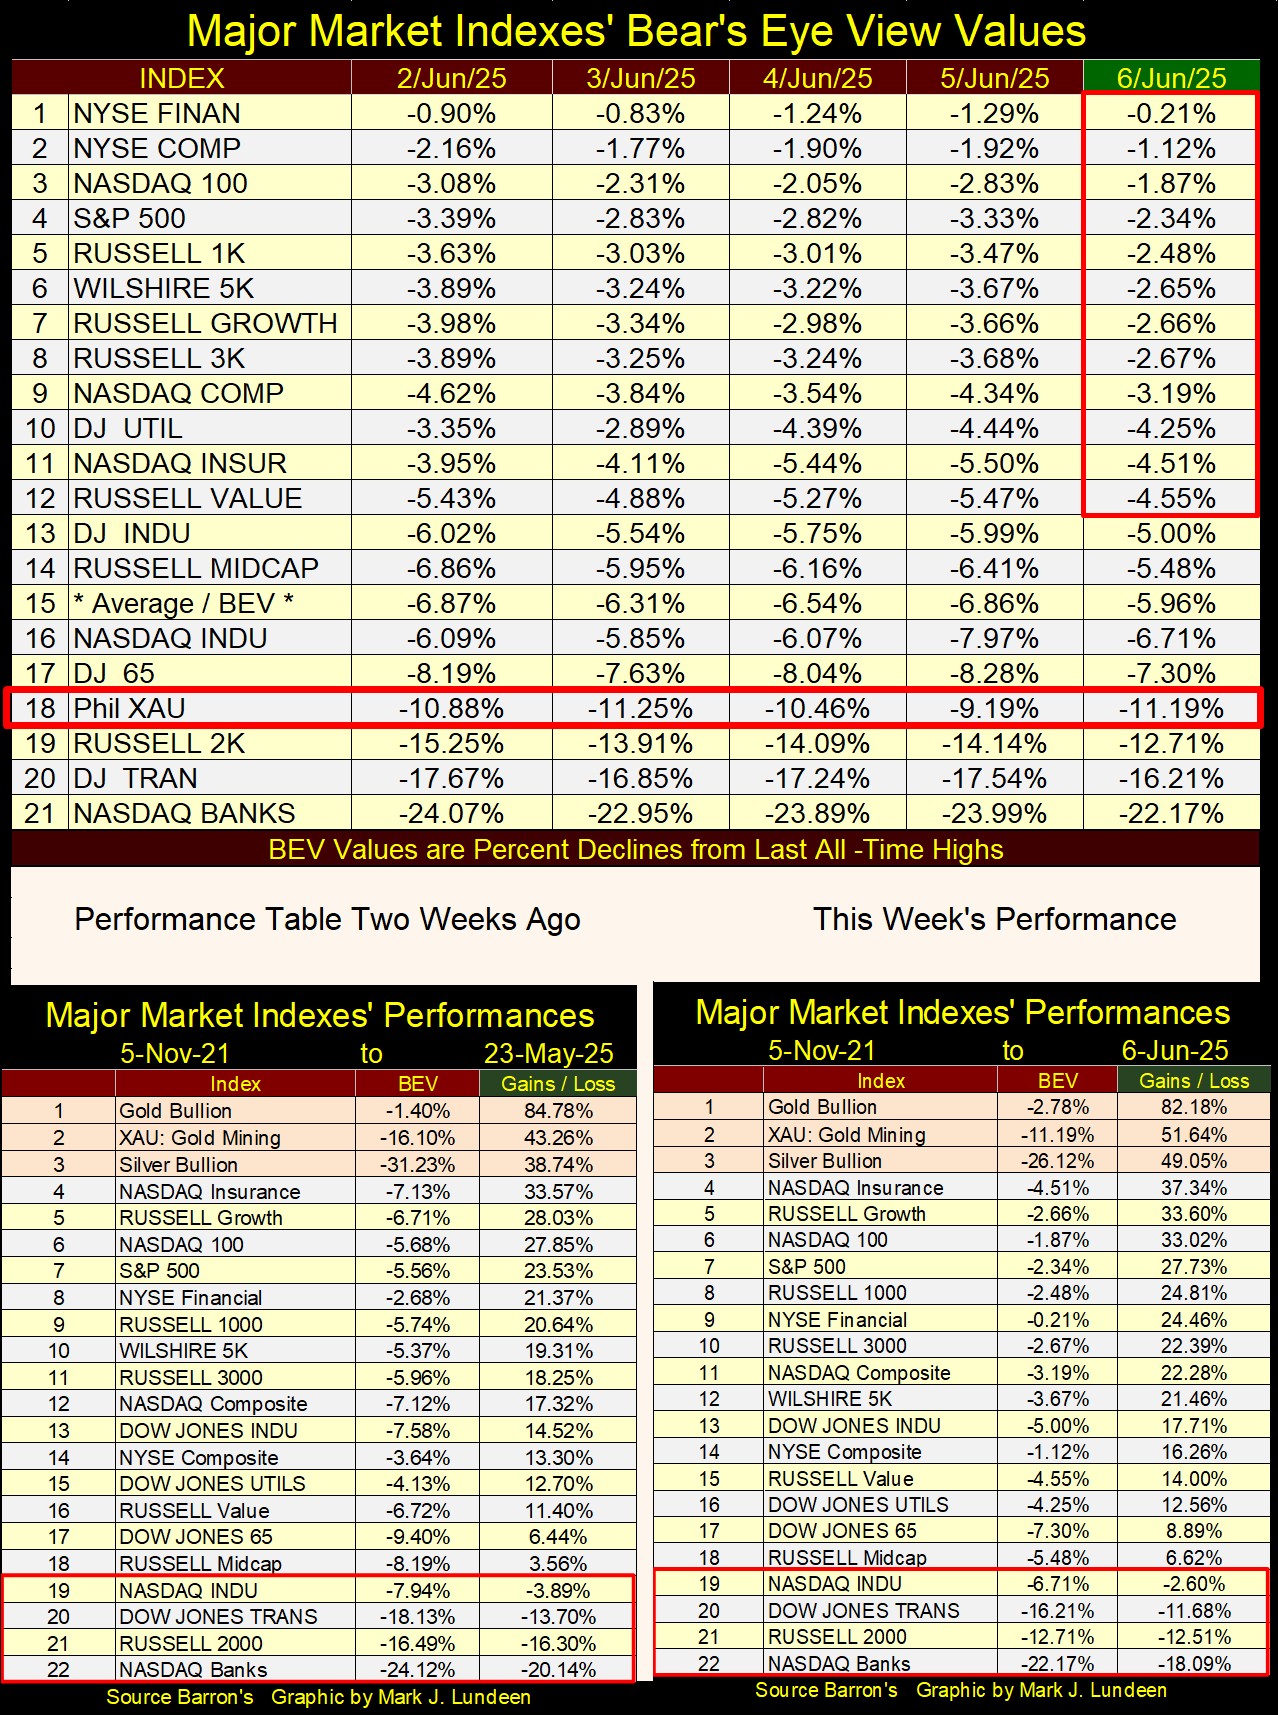
In this week’s performance table above, gold (#1) backed off a bit from where it was two weeks ago, but the XAU (#2) and silver (#3) have each advanced by about 10%.
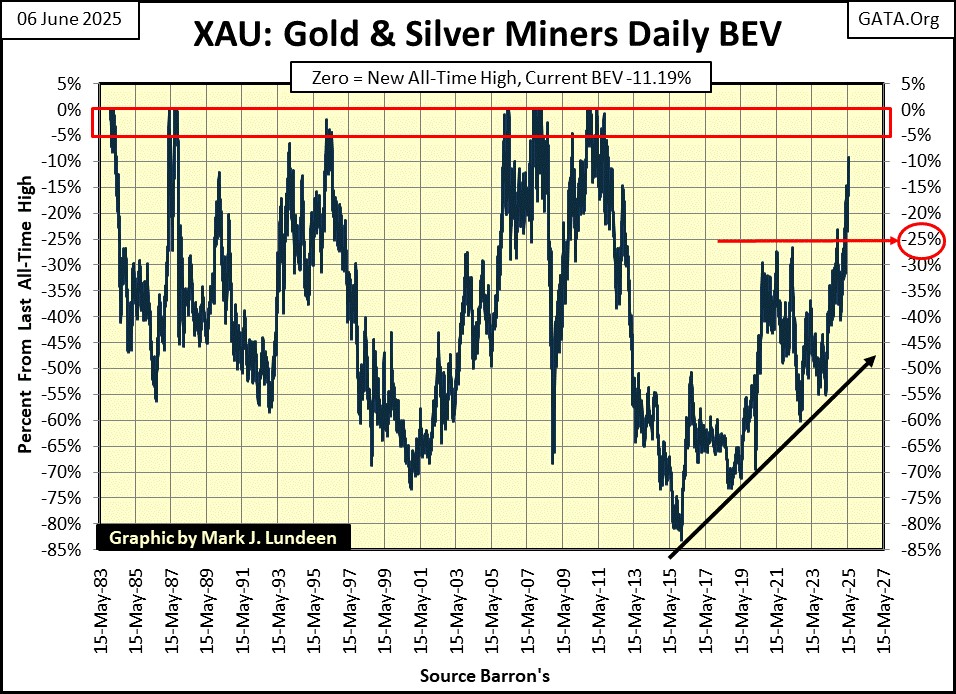
In my mind, I see more reasons to be concerned for the stock market, than reasons to be bullish for it. But for gold, silver, and their miners, they are boldly moving ahead, and not looking back. Take for example the XAU’s BEV chart below. It hasn’t seen a BEV value above -10% since late 2011. On Thursday this week (yesterday), it closed with a BEV of -9.19%.
It's been fourteen years since the XAU has made a new all-time high, not since April 2011. Seeing it now surging upwards in the BEV chart below, is telling us something, something we should be listening to; buy the gold and silver miners.
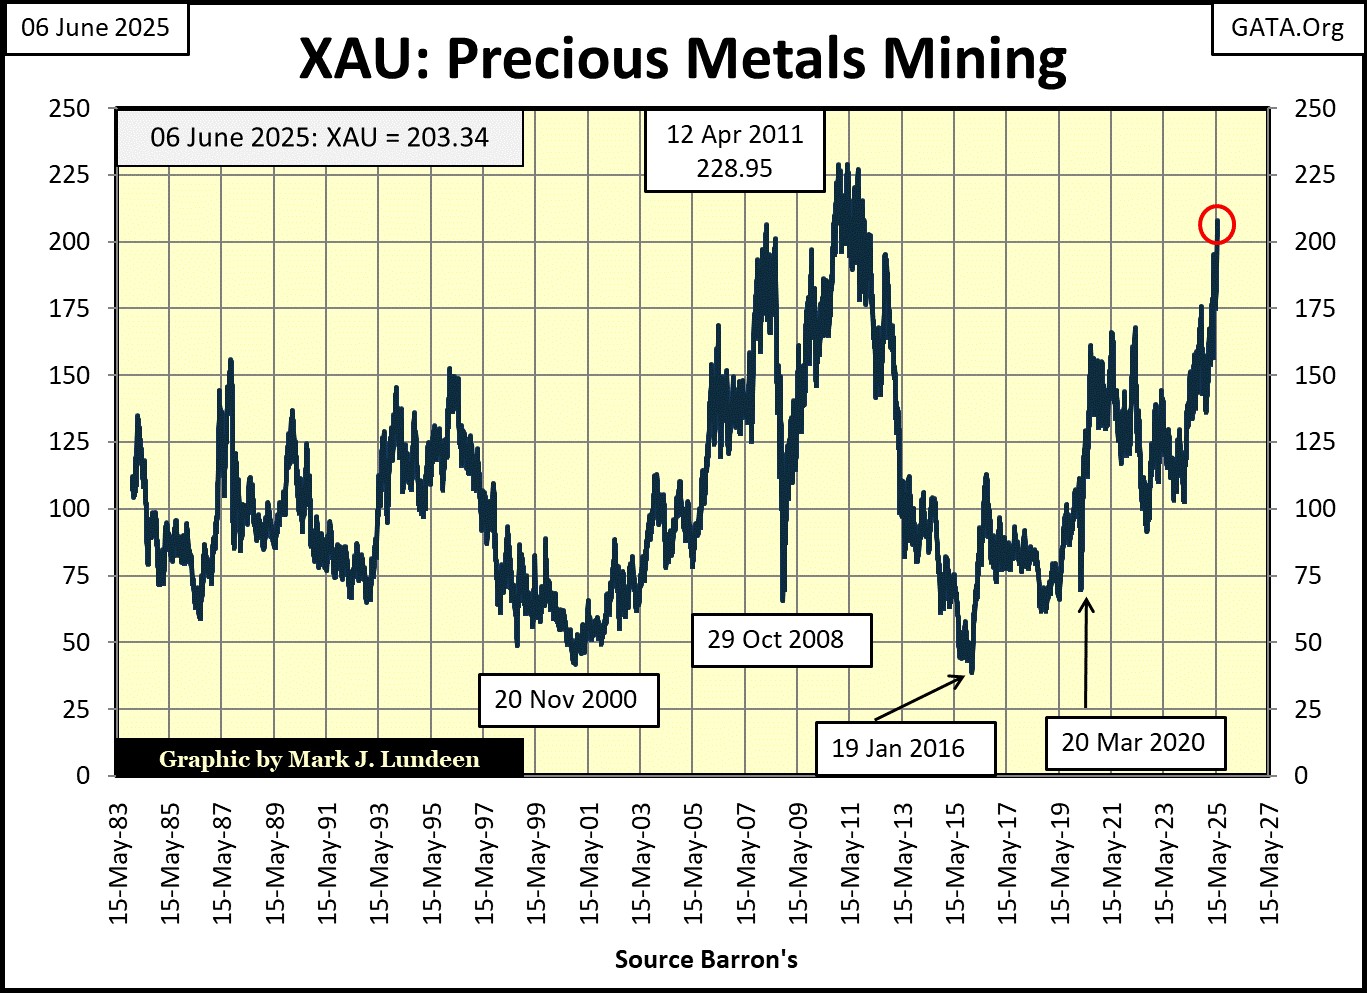
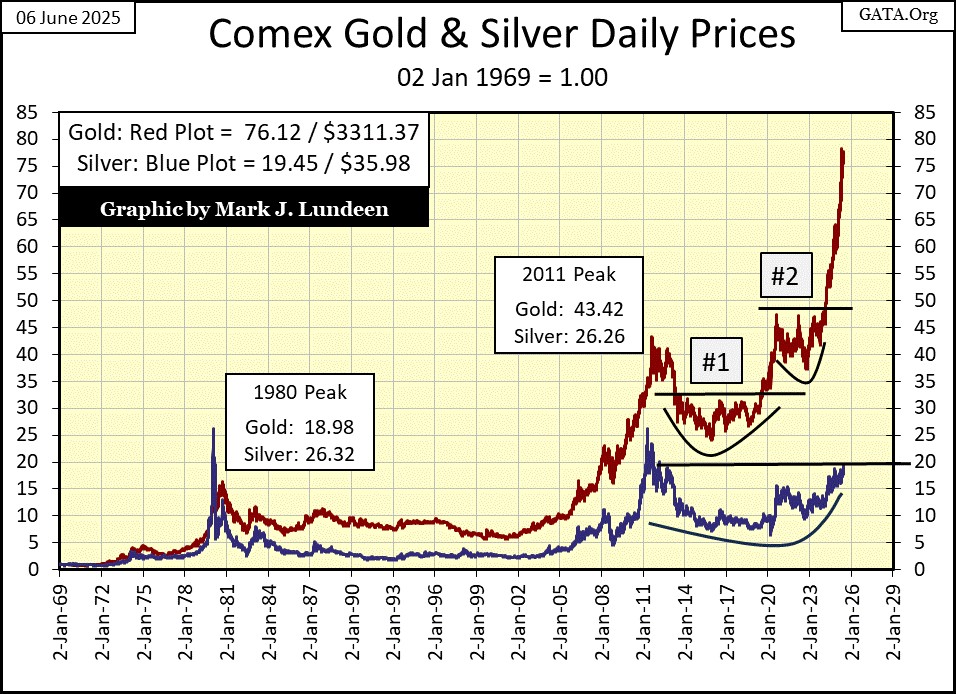
For those who prefer seeing the XAU plotted in the dollars it is published in, I’m posting the chart below, plotting every daily close for the XAU since it was first published in December 1983. At this week’s close, the XAU was only $26.62 from making its first all-time high, since April 2011.
At this week’s close, though silver is still a buy in my opinion, I can’t say it’s making the big move to a new all-time high, just yet. Silver, blue plot in the chart below, has yet to break decisively above its 20 indexed line, something it hasn’t been able to do since 2011.
BUT, I can feel the magma moving below the trading floor at the COMEX silver exchange, with the stench of rotten eggs, billowing clouds of sulfur dioxide rising from deep below. There is something lurking beneath the silver market, possibly another Krakatoa of a market event, a market event that could soon drive silver in the chart below, briskly up towards the gold plot. Say a move from silver’s current 20, to something above its 35 indexed line ($60 plus silver), before 2025 comes to its conclusion.
Seeing how gold, silver and their miners are doing in my performance tables above, taking the top three spots for months now, I’m thinking $60 silver by Christmas, while not a certainty, is very possible.
What such a move would do for gold, would be something to behold, but would not equal the gains seen in the silver market. But assuming gold and silver actually do something spectacular in the last half of 2025, the big money will most likely be made in the gold and silver miners, which are actually leveraged plays on the market’s moves in gold and silver bullion.
So, this sounds like a good time to report that Eskay Mining (ESKYF: NASDAQ) issued a new press release this week on their exploration program for 2025, which should begin in a few weeks.
https://eskaymining.com/news/news-releases/eskay-mining-2025-exploration-campaign-begins-late-10168/
Nothing comes easy in this world, and that goes double for mineral exploration. That said, over the past decade (plus) of exploring their massive claim in British Columbia’s Golden Triangle, there have been no shortages of findings of extremely rich samples of precious-metal ore. That there is something there, cannot be denied. The question is; exactly where is it, and how big is it? These are questions that hopefully, will be answered this summer.

So, Eskay’s problem has been in locating the sources of these samples of precious metal ore. Will 2025 be the year for a big discovery for Eskay Mining? Like me, and Eskay’s management, my readers will have to wait until next October, or so to find out. But I am very hopeful.
With rising gold and silver prices, at some point a major mining company is going to want to come on Eskay’s property, and have their geologists kick over a few rocks to see what is really there.
Actually, from the major mines now being worked, bordering Eskay Mining’s property, there are a couple of NYSE listed gold-mining companies that need to look to their west only a few kilometers, to see what Eskay Mining has to offer them. Well, it’s a bit more complicated than just that. But one day they, or someone else, will make the effort to see what Eskay Mining has to offer them.
That sound good, but keep in mind that Eskay Mining is not an investment for widows and orphans. It’s a speculation that offers potentially oversized gains, for those willing to risk a small position in it.
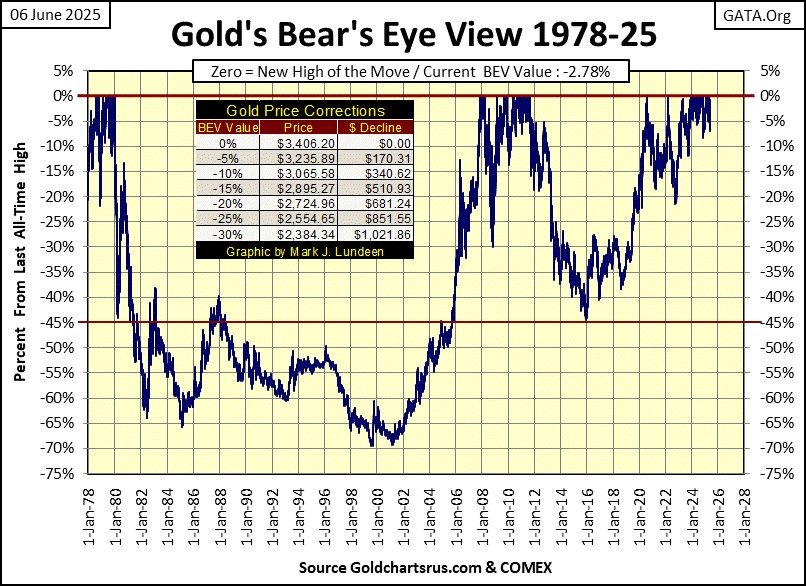
Next is the Bear’s Eye View chart for gold going back to 1978, to better see where we are today in June 2025. However, before that; in 2025 exactly where are we in terms of paper dollars circulating in the economy (CinC), and debt in terms of the US national debt? For that, I created the little table below listing CinC, the US national debt, and the price of gold and silver for January 1978 and now in June of 2025.
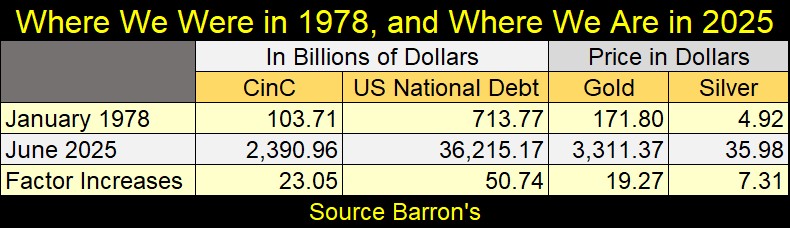
Monetary inflation, as measured by growth in CinC, is up by a factor of 23.05. That’s big, while the national debt is up by a whopping factor of 50.74 since 1978. How has gold and silver so far responded to these increases in CinC and the national debt? They are up, but lagging behind, especially silver with a factor increase of only 7.31 these past forty-seven years. Since January 1978, the cost of a can of beans at the grocery store is up more than an ounce of silver, and there is something so wrong about that.
In 2025, the growth in the national debt is a major factor in America’s economy, and why Elon Musk and President Trump were quarrelling this week. Elon wants to cut the rate of growth in the national debt, something I’m sure Trump also wants, but can’t because of the RINOS running amuck in Congress.
But it’s not just the RINOs who deserve some credit here. Thanks to the Idiots at the FOMC, debt has increased dramatically since 1978, for government, corporations, and individuals, and most of this debt is NOT going to be paid back. Not by the US Government, the zombi corporations in a debt spiral, or by the overextended consumers, whose debts only grow larger, as they grow older, and then they die.
We are talking about many trillions-of-dollars of debt, being defaulted on. That sounds great to the debtors, just walking away from their debts. But for their creditors, such as pension and trust funds, insurance companies, and banks, whose trillions-of-dollars these debtors are walking away from, that doesn’t sound so good.
This is how many wealthy people in 1929, became poor people during the depressing 1930s; people and businesses defaulted on their debts during the Great Depression. Don’t think it won’t happen again.
I don’t care to place a time and date for it to happen, but the day is coming when “default” is going to become another dirty 4-letter word in the world of finance. A very dirty word that will then be used all too frequently in the course of business, as well as on TV and the internet.
In such a world, gold and silver, financial assets with ZERO Default Risk, are going to do some amazing things for their owners. What that will look like in gold’s BEV chart below, will be an amazing cluster of BEV Zeros forming on this chart’s right side, along its Red-BEV Zero (0.0%) line.
In gold’s step sum table below, gold is looking darn good! See all those red down days for the gold market, yet gold refuses to decline below scoring position. That plus on Monday, and again on Wednesday this week, it advanced to within $35, less than 1% away from its last all-time high.
What is going to happen when once again, the gold market sees advancing days, outnumber declining days in the table below? Something that is likely to happen sometime this month. Maybe beginning next week.
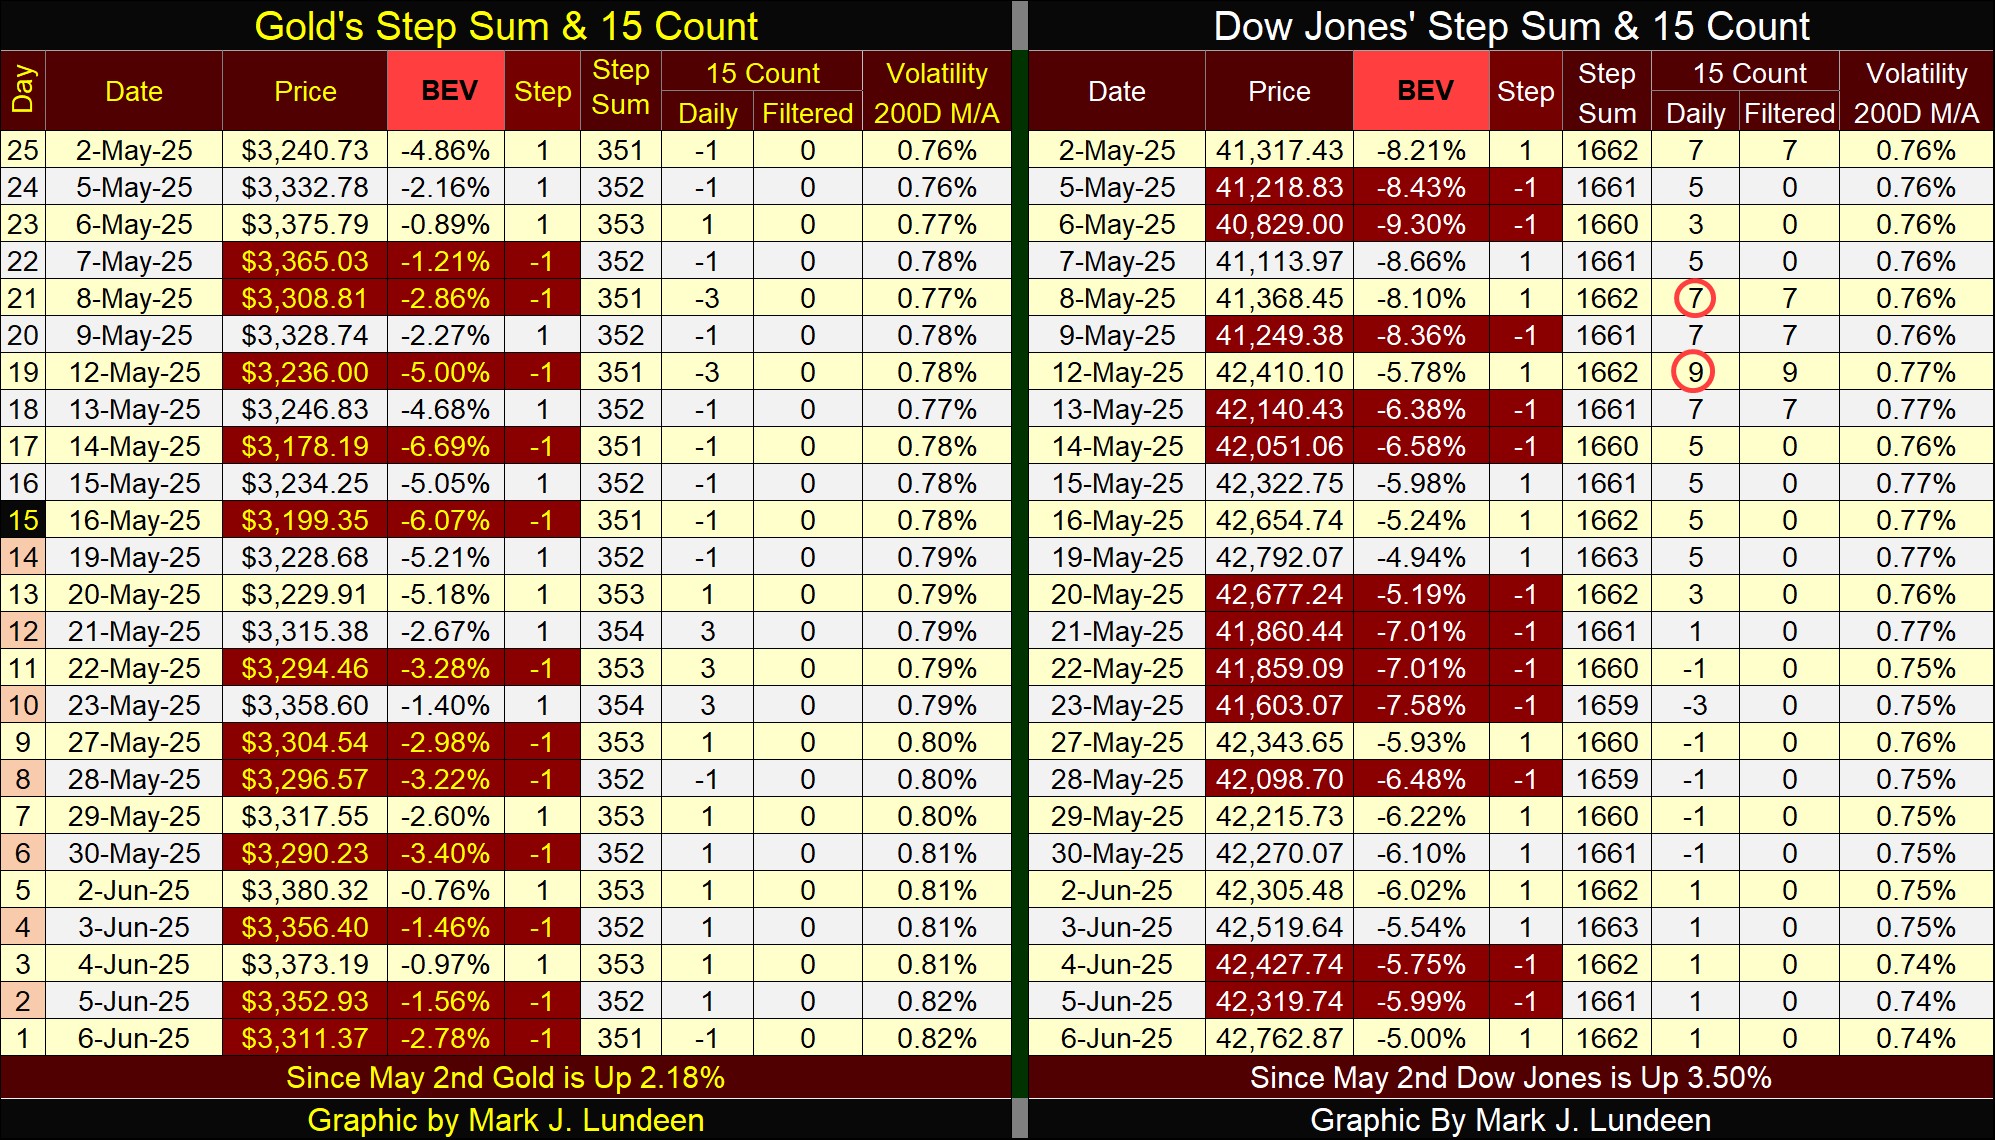
On the Dow Jones side of the above step sum table, unlike gold, it is seeing more advancing than declining days. Yet, it’s having difficulty reentering scoring position; getting its BEV values below a BEV of -5.00%.
What happens to the Dow Jones when once again, the market enters a period where declining days overwhelm daily advances? That may not bring about a crash in the market, but it won’t bring any new all-time highs for the Dow Jones either. As always, next week should be interesting.
Mark J. Lundeen
*******


