Gold Forecast: Gold Cycles Focus on June for Next Key Low


 With the action seen over the past month, Gold ran up to make its high for the swing back in late-April, here doing so with the tag of the 3509.90 figure (June, 2025 contract). From there, a sharp decline was seen, with the metal dropping down to a low of 3123.30.
In my prior article for Gold-Eagle back in April (i.e., 'Gold at Risk to Larger Decline'), the cycles were in topping range, with the accompanying technical action looking for a sharp correction to unfold. That has been seen in recent weeks, with the metal dropping over 380 points off the 3509.90 swing top, a decline of over nearly 11%.
Gold Cycles, Short-Term
For the very short-term, the current rally is coming from the 10-day wave, and also likely the slightly larger 34-day component. Below is the 10-day cycle in Gold:
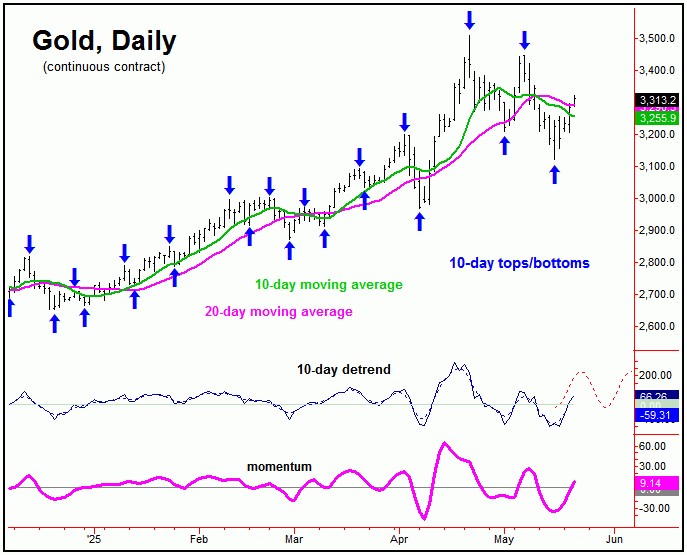
In terms of price, the recent reversal above the 3247.80 figure (June, 2025 contract) was the 'trigger' for the most recent upward phase of our 10-day cycle, which has given way to some additional strength through the same. In terms of time, the next peak for this 10-day wave is projected for the May 22nd timeframe, but with a plus or minus variance of a day or two in either direction.
In terms of patterns, the ideal path with our 10-day cycle favors a countertrend rally, one which remains below the 3448.20 prior swing top - and with key resistance around the 3354-3390 level (June, 2025 contract).
The 34-Day Cycle in Gold
Stepping back slightly, the downward phase of the larger 34-day cycle (chart, above) was recently in force, with that wave shown on our next chart:
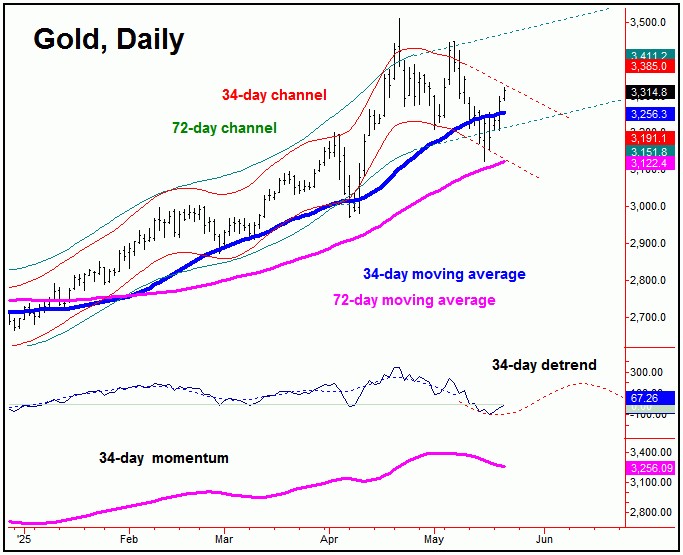
From my 4/20/25 article: "with the recent action, Gold has spiked above the extrapolated upper 34 and 72-day cycle channels, and with that warns of a more significant peak forming. In terms of price, once the next correction phase of our 34-day cycle is in force, the 34-day moving average should again act as the normal minimum magnet - which is nearly 200 points below current price levels."
As mentioned back in April, our 34-day cycle in Gold was topping out, with price spiking above the upper 34 and 72-day cycle channels - doing so on a technical contraction. In terms of price, the correction phase of this 34-day wave was expected to see a minimum drop back to the 34-day moving average - which has been satisfied at the most recent swing low.
In terms of time, our 34-day cycle was projected to bottom around the mid-May area. Thus, with the action seen in recent days, the probabilities tend to favor the upward phase of this cycle to be back in force, with the patterns looking for a countertrend rally.
The 72-Day Cycle
Stepping back further, a countertrend rally with our 34-day cycle - if seen - will be favored to drop back to the 72-day moving average into mid-June or later, where our next 72-day low is projected. Here is that larger 72-day wave:
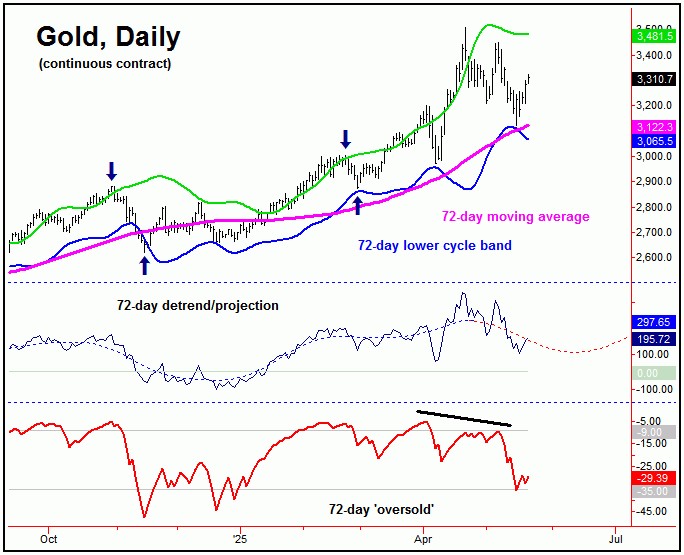
As mentioned, this 72-day cycle in Gold is next projected to trough around mid-June, plus or minus. With that, Gold will probably form a key low with the 72-day wave into June (plus or minus), followed by a sharp rally into Summer, with the average rallies with this cycle having been some 13% off the bottom.
Technical Considerations
From my 4/20/25 article: "our Gold Timing Index is showing a divergence against the new price high, seen as a larger technical negative. The divergence in our Gold Wave Trader is bearish, and supports the idea of at least a short-term correction playing out. However, this indicator also supports a larger peak forming, such with our 72-day wave."
As mentioned above, at the April peak our Gold Timing Index was seen as a key technical negative, and with that supported the idea of a sharp correction playing out in Gold prices. Here again is that Gold Timing Index:
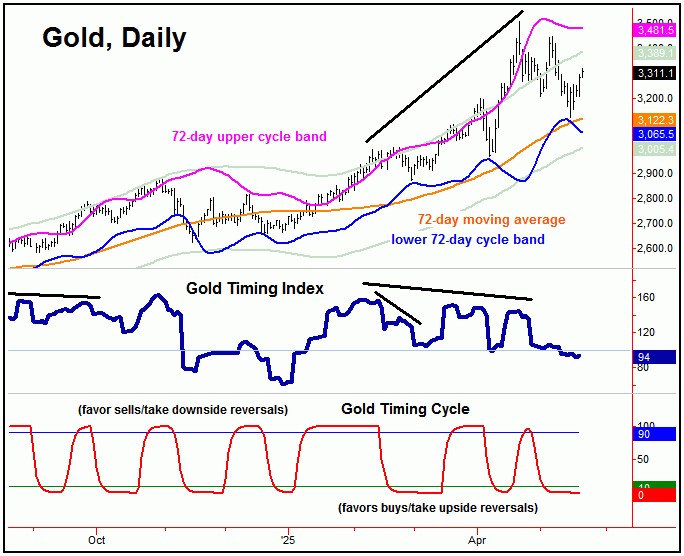
As mentioned above, it was the divergence between our Gold Timing Index and price that set Gold up for its recent decline. On the flip side, our Gold Timing/Cycle indicator (lowest pane, in red) recently moved back below its lower reference line - suggesting a short-term rally would play out, some of which has been seen, coming from the 10-day wave.
Stepping back, the best buy signal for June would be for (1) a bullish divergence to appear with our Gold Timing Index, and (2) a drop back to or below the lower gray band on the above chart. Should this be seen, it would be strong indication that the next rally phase of our 72-day cycle is readying to unfold. This is something we will be tracking with great interest in the coming weeks, always posted in our Gold Wave Trader report.
Jim Curry
The Gold Wave Trader
Market Turns Advisory
http://goldwavetrader.com/
http://cyclewave.homestead.com/
********


