Dow Searching For Secondary Top


The Dow continues its tremendous rally from recent lows. I have stated before that it is my opinion that this is a bear market rally. Has anything happened to change that opinion? Nope, but I’ve sure got a good case of the heebie-jeebies! Let’s revise the charts to see why.
DAILY CHART
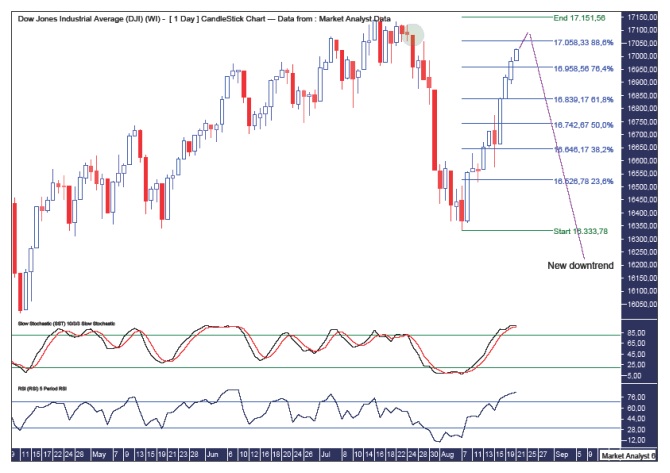
What a rally! One last hurrah for the bulls perhaps? I think so, but it’s cutting it close. I have added Fibonacci retracement levels of the move down from all time highs to the recent low. While I expected a deep retracement, I didn’t think it would get this high. I was targeting the 76.4% level at 16958 and I positioned myself accordingly. Then price just seemed to take that level in its stride. I’m generally not a day trader but I was left with no option here. A nice little sell low, buy high action. As Homer Simpson would say, “Doh!”.
So, as price has not acted as expected, it’s time for more revision. I have added a Stochastic indicator and a Relative Strength Indicator (RSI) and both are at extremely overbought levels. Also, the Stochastic is threatening a bearish crossover. Perhaps another couple of days before that happens.
Looking for more clues on the chart, I identified a small piece of evidence. This relates to the candles on the 24th and 25th July and can be seen in the green highlighted circle. Something I noted back then was just after trading closed on the 24th, the futures started heading south and trading the next day was never able to get back up to the closing level of the 24th. This level stands 17083. So perhaps that is the area the Dow is searching for to make a secondary top.
And that level is just above the 88.6% retracement level so it is certainly a deep retracement. As I’ve said before, the market does like to take things to the extreme and this time appears as no exception.
Let’s quickly take a look at the bigger picture with the monthly chart.
MONTHLY CHART

I have added a RSI which shows the bearish divergences that have formed since the May 2013 high. Surely, something has to give!
I have also added a Moving Average Convergence Divergence (MACD) which shows the red line above the blue line signifying that lower prices going forward are likely.
With this evidence at hand, I continue to believe that this is a bear market rally. Having said that, price is running out of price and time if the bearish scenario is set to occur. If it is, then the month of August should really close in negative territory, if only slightly. Therefore, I favour a marginal rally high around 17085 on Monday the 25th August before a sharp move down commences and it finishes the week and month at a level below 16561 which is where it opened the month.
And finally, while I don’t follow the S&P500 closely, I have noted it is making new all time highs. So perhaps the Dow makes a lower high while the S&P500 makes an all time high. A little bearish divergence.
And, as always, my opinion is at the market’s mercy…………….
********
Please register your interest in my website coming soon. Any questions or suggestions, please contact [email protected]
© 2014 Copyright Austin Galt - All Rights Reserved
Disclaimer: The above is a matter of opinion provided for general information purposes only and is not intended as investment advice. Information and analysis above are derived from sources and utilising methods believed to be reliable, but we cannot accept responsibility for any losses you may incur as a result of this analysis. Individuals should consult with their personal financial advisors.


