Gold Forecast: Key Message for Gold


 Here is the latest gold price forecast and prediction for 2026, based on multi-cycle technical analysis. With the action seen in past weeks, the last key low for Gold came from the bottoming of our 72-day cycle, with that low seen as the 2/2/26 low of 4423.20 (April, 2026 contract). This low came in the form of a 'mini-panic', which was preceded by a short-term 'blow-off' topping condition.
With the above said and noted, a quick look at the position of the various Gold cycles.
Gold's 10-Day Cycle
For the short-term picture, our smallest-tracked wave in Gold is the 10-day component, which is the 'trading cycle', and is shown on the chart below:
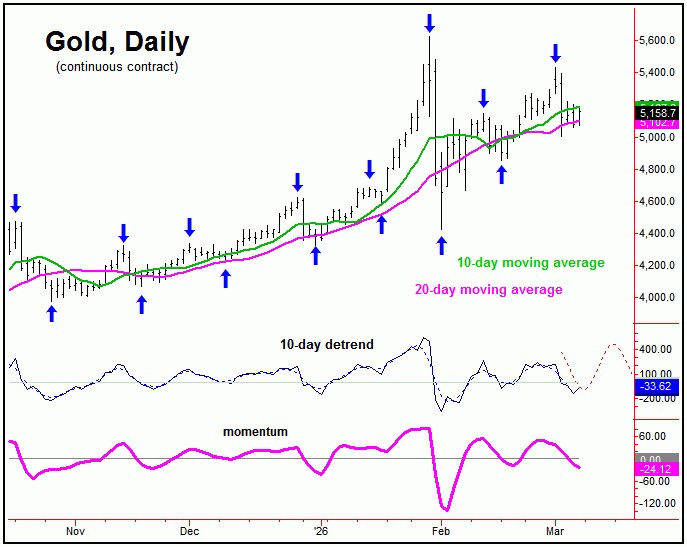
From my 2/8/26 article: "a push above the 4999.00 figure (April, 2026 contract) into Monday of this week - if seen - should favor another move back to or above last Wednesday's 5113 swing top in the very near-term, then to be on the lookout for the next 10-day peak to form."
As noted above, taking out the 4999.00 figure on 2/9/26 favored additional strength up to the 5113.00 figure or better, which was seen in the days that followed. From there, another correction phase was seen with this 10-day wave, with Gold dropping down to a low of 2/17/26 low of 4854.20 - before flipping back to make higher highs into early-March.
Going further, the last peak for our 10-day wave was the 5434.10 swing top, which was confirmed by the following action, and noted in our Gold Wave Trader report. From there, the metal fell all the way down to a recent low 5005.00 into early last week - before seeing an upside consolidation into later in the week.
With the above said and noted, the downward phase of this 10-day wave is currently seen as in force, with the next short-term upward phase expected to come from the same. Having said that, no upside price 'reversal point' has yet to develop for this cycle, though this could be seen in the next trading day or two - and always posted in our thrice-weekly Gold Wave Trader report.
Gold's 34-Day Cycle
Above the 10-day wave, there is the 34-day cycle. Here again is that 34-day cycle in the Gold market:

The upward phase of this 34-day cycle is currently deemed to be in force, having been confirmed by the action since my last article back in early-February. The position of this particular wave does favor the current short-term correction with the smaller 10-day cycle to end up as a countertrend affair.
Adding to the notes above, a countertrend correction with our 10-day wave should be followed by a push back to or above the most recent swing high of 5434.10 (April, 2026 contract), then to be on the lookout for the next 34-day top to form. From there, another correction low with this 34-day wave looks to be due around mid-April - a move which would also be favored to end up as countertrend.
Gold's 72-Day Cycle
Above the 34-day wave, there is the 72-day cycle for Gold - which is shown below:

From my 2/8/26 article: "our 72-day wave may have formed a low at the 4423 figure, though its next upward phase can't yet be confirmed. In terms of patterns, as long as the late-October low (3975) is not taken out on the current correction phase of this wave, Gold can could/should make a push back above the 5626.80 swing top into April - May. From there, we will need to be on the lookout for the next larger-degree peak to form."
As mentioned back in early-February, there was the potential for our 72-day cycle to have bottomed. In terms of price, the decline into the 4423 swing low basically met a normal correction with this wave, which called for a drop back to the 72-day moving average. Going further, the metal found support right at this same moving average.
Since my last article, the upward phase of this 72-day cycle was confirmed to be in force. In our report, we noted key resistance around the upper 72-day cycle band, which would be hard to get past - at least on the first attempt. With that, we have been in a short-term (i.e., 10-day cycle) downward phase, off this try at the upper 72-day cycle band.
In-between now and when this 72-day cycle tops out (around mid-May), of note is that we should expect to see an in-between correction with the smaller 34-day wave, ideally playing out into mid-April, plus or minus.
Stepping back, however, the path is looking for a test or push back to new all-time highs before the current upward phase of our 72-day cycle is complete. Going further, the upward phase of this particular wave does seem favored to top an even-larger four-year component - which is expected to give way to a sharp decline of some 25% or more, and playing into later this year. More on this larger-degree wave in a future article.
Jim Curry
The Gold Wave Trader
Market Turns Advisory
http://goldwavetrader.com/
http://cyclewave.homestead.com/
********


