Election Shenanigans And The Markets


Last week it was mentioned how a miraculously high Non-Farm number has again been announced (just like in 2012). Now that Trump’s statements on the poor state of the US economy have received much media attention and comments from many important personages, we also find Wall Street on a tear as ‘proof’ that investors are in complete disagreement with his views. It has been clear for even years that a strong force is supporting the DJIA whenever weakness sets in; more so recently in the sustained effort to break back above 18000. The more Trump spoke on the state of the economy, the higher the DJIA moved above that level. We even saw a break of the SP500 above major technical resistance at 2174. On Friday and quite unexpectedly given the degree of intervention on Wall Street, trading opened with the DJIA below Thursday’s close and sank lower. The usual late improvement this time failed to drag the DJIA into positive territory. Perhaps, just perhaps, reality is starting to overrule force on Wall Street.
Between surprisingly high employment numbers and the strange behaviour on Wall Street, it is clear that spin is playing a major role in this election. Equally surprising is that Trump so frequently comes with off the wall statements that in real life will be difficult to impossible to bring into effect should he succeed to the White House. Could it be that he is purposefully challenging the NRC to pass him by when they make the final nomination as the Republican candidate? As an independent he can rely on votes from disgruntled members from both parties, including Democrats that once supported Bernie Sanders. That would make for a new phase in US party politics and really put the fox in the hen house of Congress!
Gold and silver are still suffering from the effects of the attack that started after the announcement of the Non-farm payroll number. The timing and severity of the new attack is so effective and sustained that this raises suspicions that there could have been a degree of advance coordination, which in today’s world on (almost) anything goes would not surprise. Where the metals this year usually managed a recovery in good time, any sign of a new bull peeking out is now quickly suppressed. It all now points to increasing desperation among those who are trying to maintain the status quo – doing so even when they surely must know that history is against their long term success.
Demand for crude oil still cannot absorb the supply and this should be perceived – at least for now – that the malaise in the US economy is not limited to the US, but is manifest on a global scale. Those commentators that have been preaching about the threat posed by the mounting global debt, perhaps could see their thesis being vindicated in the not too distant future.
The US dollar and the yield on the US 10-year Treasury note are steady to firmer.
However, on the whole we surely are living in interesting times!
Euro-Dollar
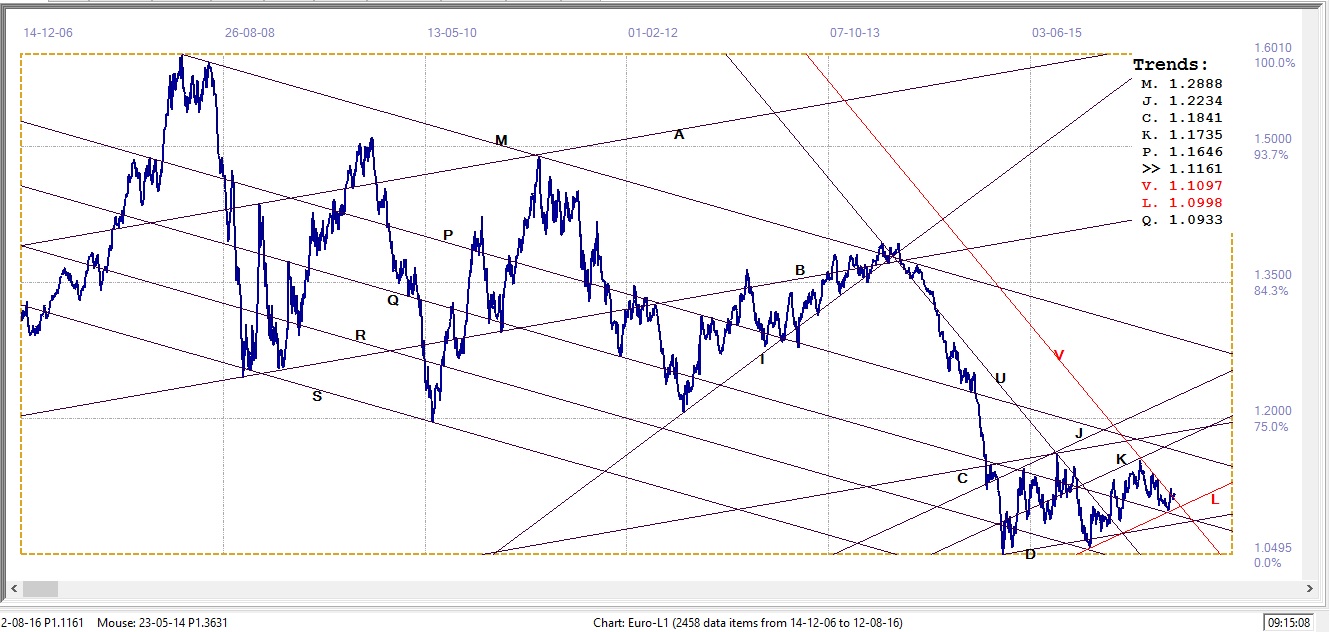
Euro-Dollar, last = $1.1161 (www.investing.com )
The rebound higher off support, at line L ($1.0998is breaking just marginally above bear channel UV ($1.1097) to give a potentially bullish signal. The break higher has to extend further to confirm the trend. The bullish trend can however be seen as intact as long as the euro can hold above the support of line L.
DJIA
As mentioned in the introduction, Wall Street has enjoyed super support for quite some time – from quarters that are not publicly known, but which are easy to guess in terms of their origins. The support was quite intense recently, pushing hard, first, to get the DJIA above the 18000 level and then, as Trump spoke more persistently about the poor state of the US economy, pushing the market even higher.
On Thursday the DJIA closed just above 18600 points to set another all time high in the recent series of new all time tops, but on Friday the market opened weaker – and despite the regular later afternoon rally! Failed to close in the green. It remains to be seen this week whether that is a sign of a new trend, or only a hiccup during the new bull trend.
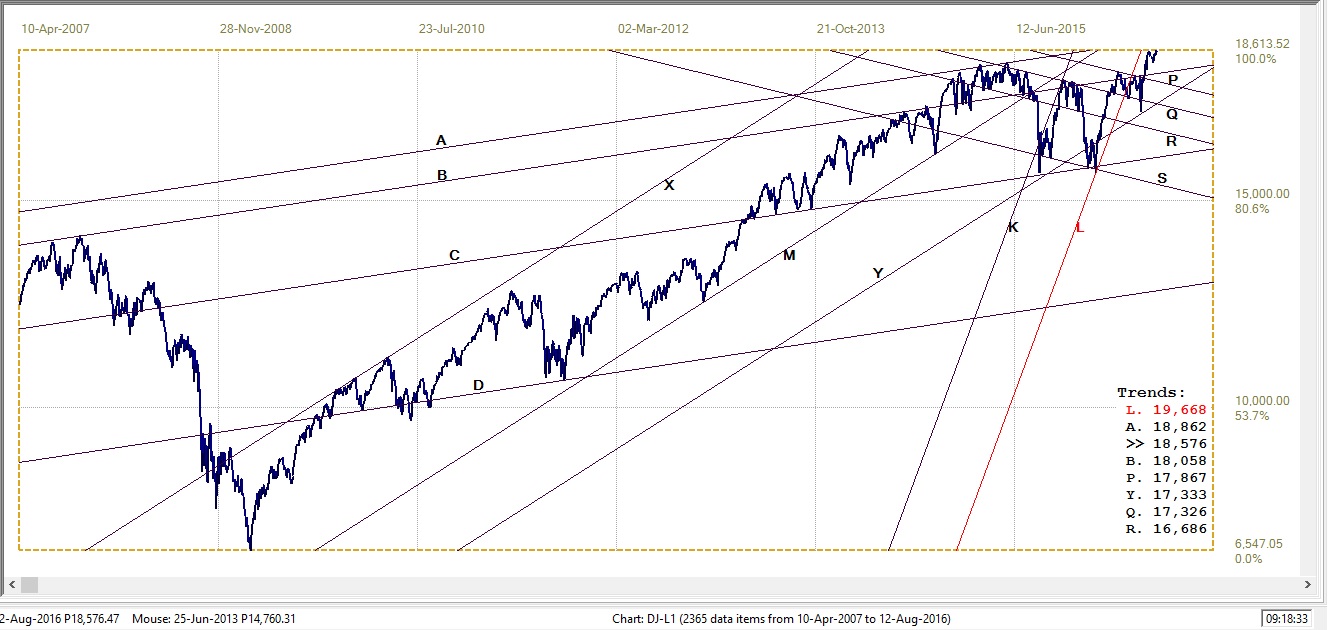
SP500 Index, last = 18576.47 (money.cnn.com)
Gold PM fix - Dollars

Gold price – London PM fix, last = $1352.20 (www.kitco.com )
Gold started a rally late in July, as if to build up a head of steam before the Non-farm payroll was announced. It reached a double top, but that was as far as it could go before the onslaught began. The decline was not as severe as has happened on previous occasions, but the PM fixes held had comfortably above the $1300 level as if gold had found some recent strength.
Since then, the earlier double top was not really challenged as the price was kept in a tight range, being pushed back whenever it approached the top of the range. At least this holds promise for a break higher as the next new move, but when that is likely to happen can not be anything but a guess.
Gold PM fix – Euro-Gold
Following the sharp if brief break above line R (€1204), the dollar price of gold and the value of the euro remained in good enough balance to keep the euro price of gold close to that support line. This hold promise that the euro price could resume its rising trend in the near future.
A break below line R has to confirm at line W (€1180), which has a history of good support.
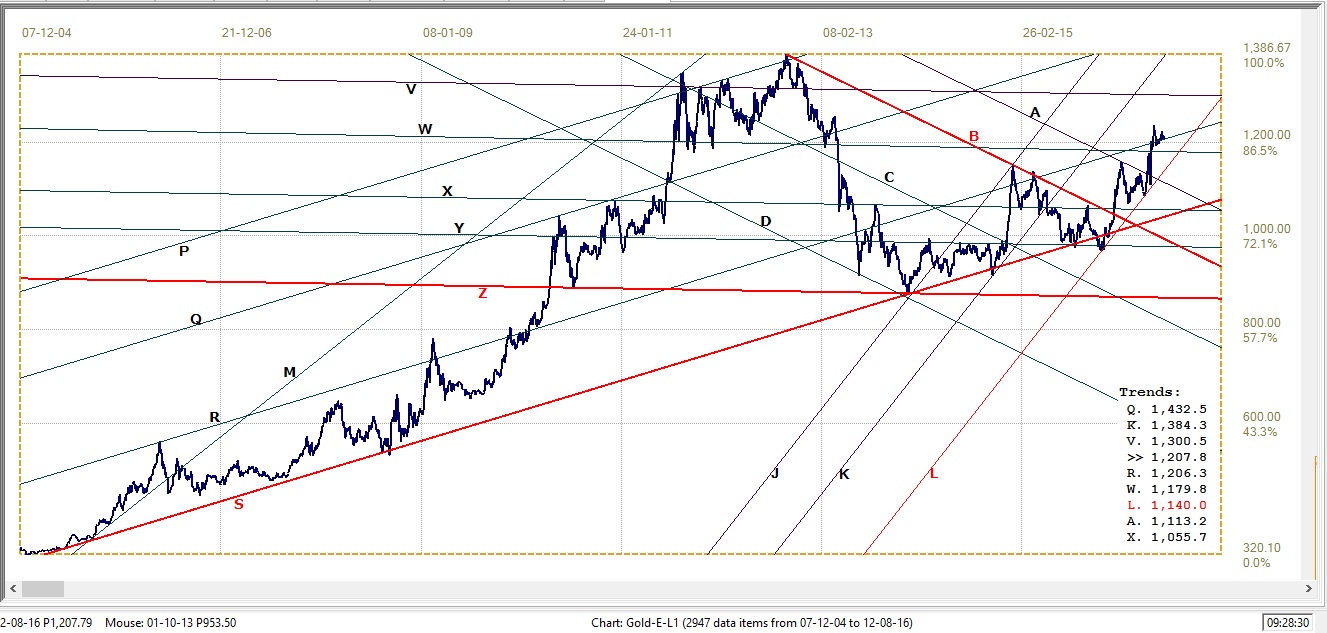
Euro gold price – PM fix in Euro, last = €1207.3 (www.kitco.com)
Silver Daily Fix Chart
The price of silver also made a near double top before the effects of the non-farm payroll made themselves felt. There is strong psychological support at the $20/oz price (in terms of the daily London fix) – which has kept the fix just clear of the significant support at line Q ($19.47). Perhaps of greater importance – a positive sign despite the occasional fix just below $20 – is that so far the selling pressure has not forced a break below the lower boundary of the old steep bull channel, as represented by line V ($19.64)
A break lower at line V will not mean that the bull trend has ended, but that would imply that the bull market is to settle at a lower gradient – and therefore take much longer to reach the very important resistance at line P ($22.74). Line P is the lower boundary of the large pennant, YP. The price of silver broke lower at the end of leg 4 of the pennant – which is against the normal development of this kind of chart formation; the price should have rebounded into the bullish leg 5, to break above its top at line Y.
The stability of the price of silver in the face of the increased selling pressure – that is being maintained in an effort to force specifically the silver price lower to trigger a panic closing of positions – is probably the surest sign that the bull market in the precious metals is still intact.
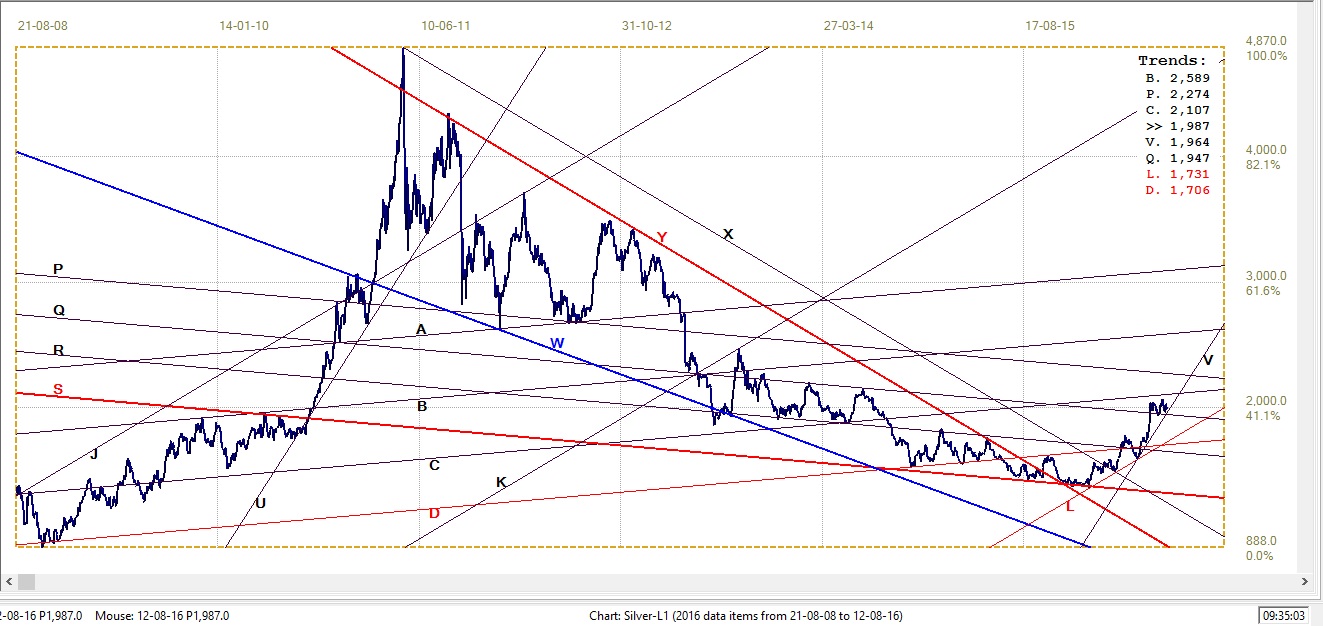
Silver daily fix, last = $19.87 (www.kitco.com )
U.S. 10-year Treasury Note
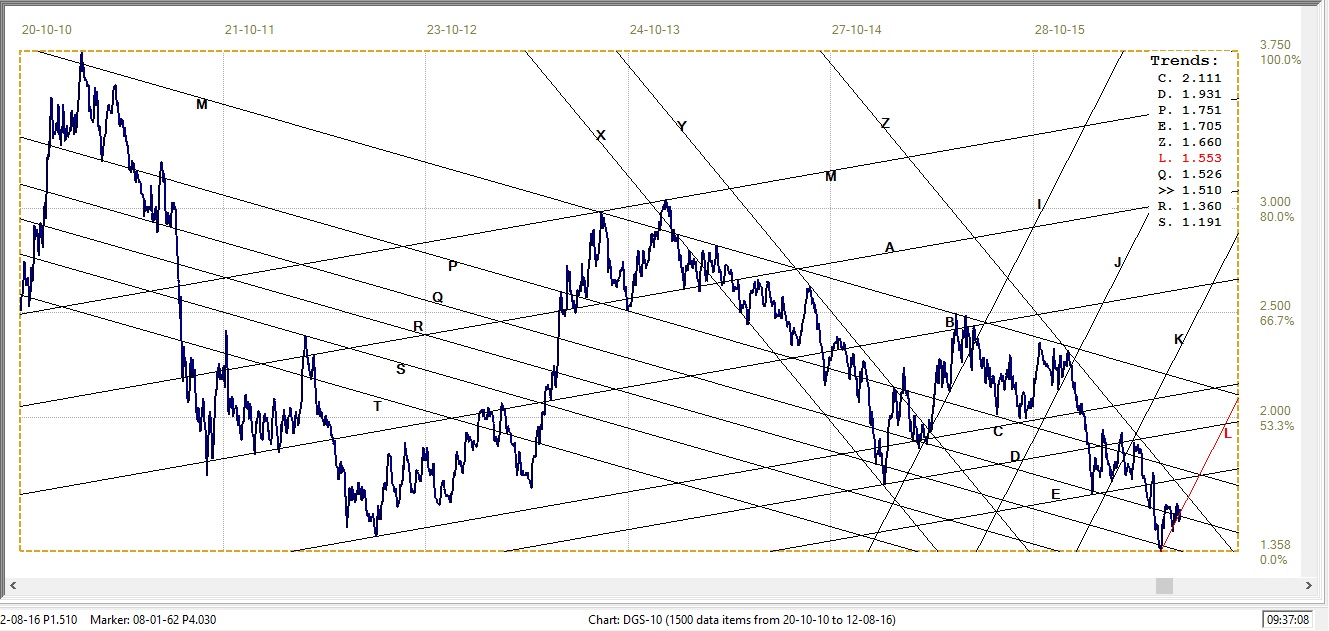
U.S. 10-year Treasury note, last = 1.510% (www.investing.com )
The yield on the US 10-year Treasury note is now in a consolidation phase. It has managed to break marginally below the lower boundary bottom of the steep bear channel KL (1.553%) and has also broken back below the market resistance at line Q (1.524%). For the time being, the broad consolidation is expected to continue – perhaps in a sideways move until the yield can respond bull channel XYZ (1.660%) which could assist the yield into a new rally.
West Texas Intermediate crude. Daily close
The comment of last week – that concern that the global economy is still cooling off, meant that demand for oil is still has less than supply seem to be the main driver of the price of crude. The price has improved a little last week, but not by a sufficient margin to break above the resistance at line L ($44.10) at the top of bear channel JKL.
The price therefore remains trapped in the narrowing space between resistance at line L and support at line G ($40.60). At the moment there is little indication in the chart as to which direction the break from this range can be expected. However, time for the sideways trend to continue without breaking from the range is running out and a break to show a likely new direction could happen any moment.
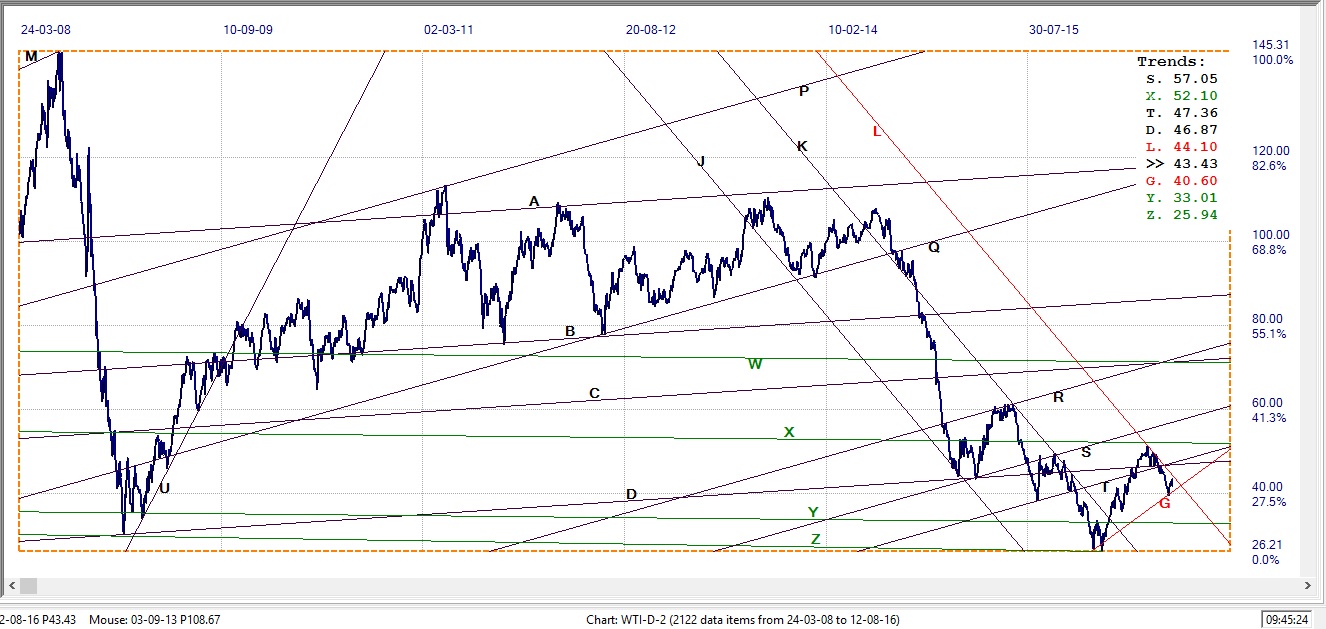
WTI crude – Daily close, last = $43.43 (www.investing.com )
©2016 daan joubert, Rights Reserved
chartsym (at) gmail(dot)com


