Ewave Analysis Of Major Markets


Gold

Gold was extremely quiet in the overnight session, and we did reach a high of 1167.10. Gold has still not given us the confirmation we need to say that wave ^iv^ or some other more bullish corrective wave has definitively ended at the 1158.90 low.
We also cannot rule out the possibility that a developing triangle is underway. We will patiently wait for this market to show its hand. If our analysis of the wave .iv. Triangle in the GDX is correct, then gold should be turning higher, sharply higher, pretty soon!
Our current count for all of wave .iii. is:
*i* = 1156.40;
*ii* = 1103.80;
*iii*:
^i^ = 1153.50;
^ii^ = 1136.00;
^iii^ = 1191.50;
^iv^ = 1158.90, if complete;
^v^ rally to go to complete all of wave *iii*.
Projections for the end of wave *iii* are:
*iii* = 1.618*i* = 1198.80;
*iii* = 2.618*i* = 1257.50. This is our preferred target.
When we are sure that wave ^iv^ is complete we will provide projections for the end of wave ^v^, with a minimum target of the wave ^iii^ high of 1191.50, but as you can see above we have higher projections.
We are long 20 positions, risking to 1135.00!
Crude
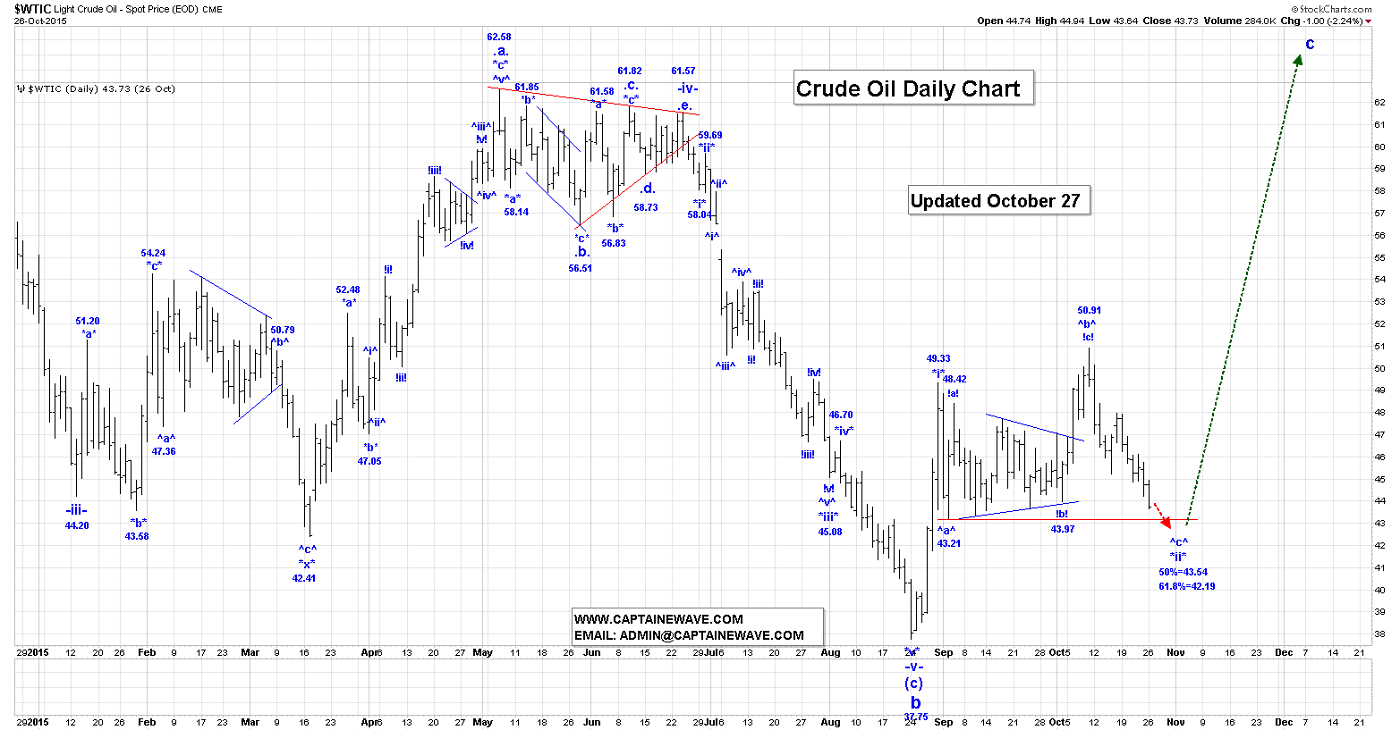
Well, the day of reckoning for crude is upon us, as we reached a low of 43.28(at the time that this Post was being written), in the overnight session, which was just 7 ticks away from our minimum target for the end of wave ^c^. That target was 43.21.
Since then, crude reached our minimum objective for the end of wave ^c^.
We are now long at $43.20 (10 positions) and looking for the beginnings of a reversal to mark the end of wave *ii* and the start of wave *iii* higher.
The wave *ii* correction is also within our 50 to 61.8% retracement zone.
Keep in mind that wave ^c^ is crude can go lower, than our minimum target of 43.21, without changing nay of our current analysis.
Once wave ^c^ and all of wave *ii* ends, then we should expect a very sharp rally in wave *iii*, to be the next big event.
Our current count for all of wave ^c^ of *ii* is:
!i! = 49.23;
!ii! = 49.92;
!iii! = 46.64;
!iv!:
$a$ = 48.43;
$b$ = 45.25;
$c$ = 47.91;
$d$ = 46.00;
$e$ = 49.92, to complete all of the wave !iv! triangle;
!v! drop is now underway with a target of at least the 43.21 low to complete all of wave ^c^ and *ii*.
Our current preferred count, since the low of 37.75 was made is:
*i* = 49.33;
*ii*;
^a^ = 43.21;
^b^:
!a! = 48.42
!b! triangle = 43.97;
!c! = 50.91, to complete all of wave ^b^;
^c^ drop is now(details above)
A projection for the end of wave ^c^ is: ^c^ = 1.618^a^ = 41.01.
We expect the end of wave ^c^ and all of wave *ii* to be within the following retracement levels:
50% = 43.54;
61.8% = 42.19.
We are long 10 positions at 43.20, with 42.00 puts as stops!
S&P500
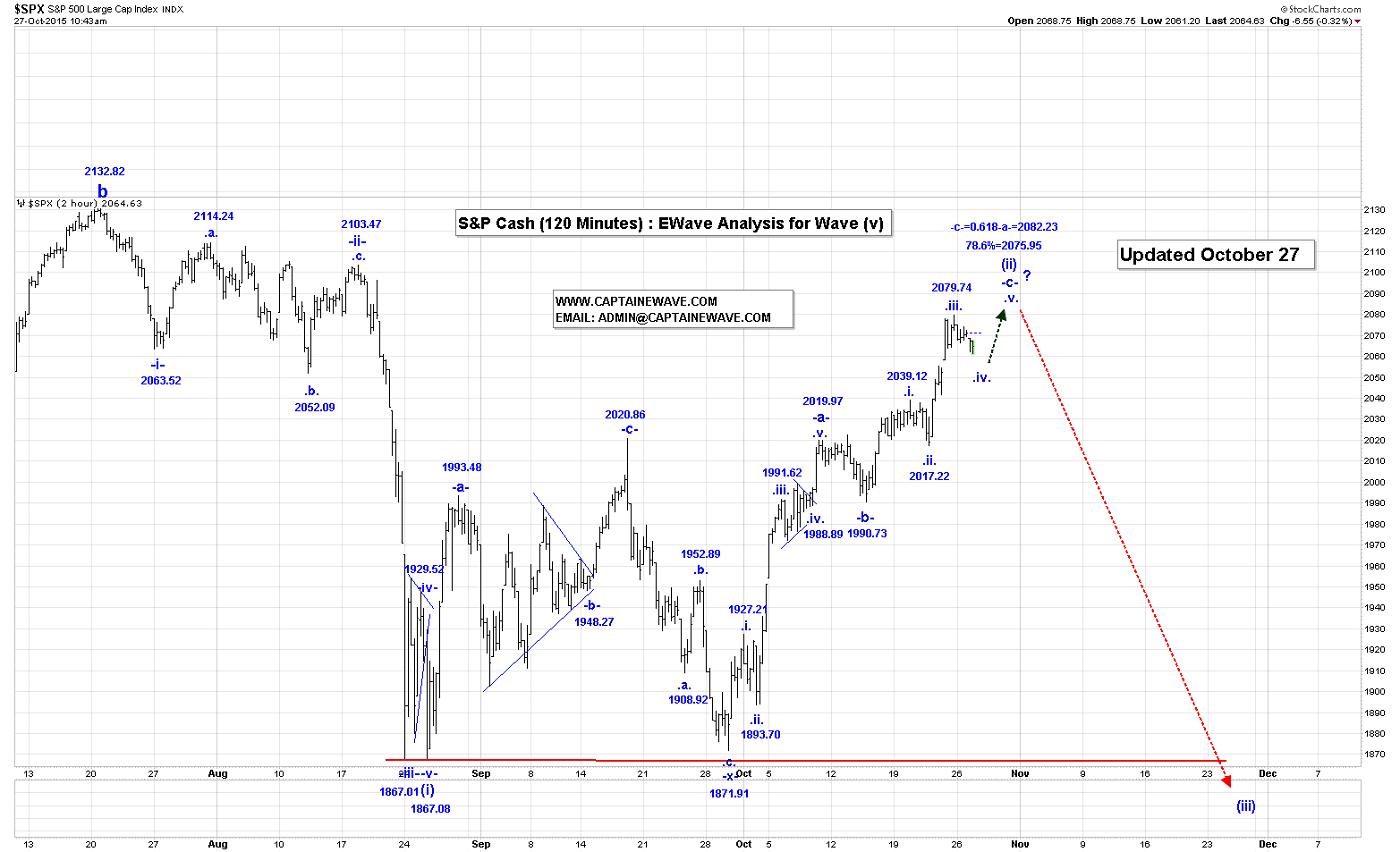
The S&P Futures are down about 2 points at the time that this Post was being written.
We should be in wave .iv. of our second wave -c- of (ii), and we doubt that it is complete.
If our analysis is correct, then we are expecting more weakness as wave .iv. continues to develop.
What is most important is that on the Intraday Chart, from the wave (i) low of 1867.08, is that we have lots of overlapping waves which suggests to us this rally, is a correction, so the SP500 is likely going to head back to the 1867.08 low again, when the correction ends!
Once we are sure that wave (ii) is complete will provide our first target for the end of wave (iii).
We are short 15 positions with 1975 calls!
USDX
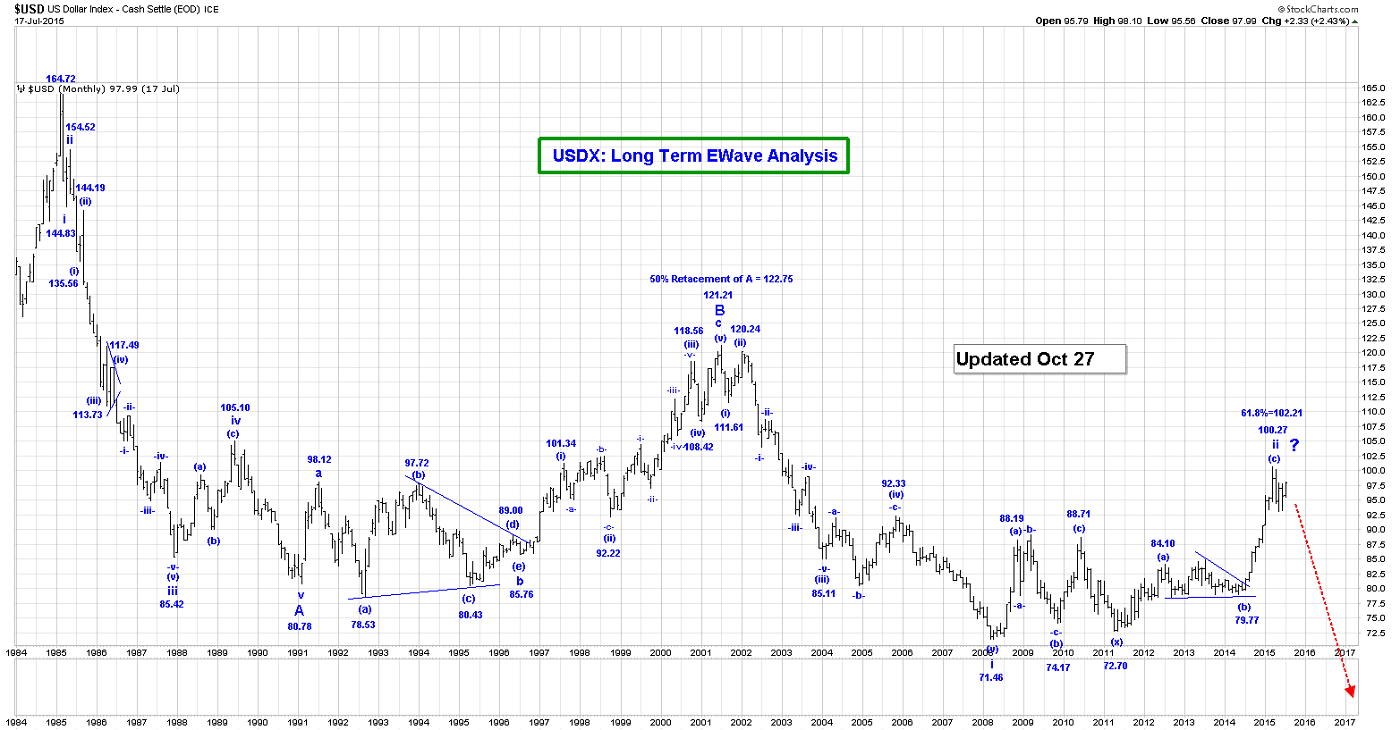
The USDX held steady in the overnight session, reaching a low of 96.74 at the time that this Post was being written. If wave *c* of our wave .b. triangle is complete at 97.30, then we should see the drop in wave *d* start to accelerate lower, otherwise one more run back to the 97.30 high is possible, to then complete all of wave *c*.
Wave *d* cannot fall below the wave *b* low of 92.54, for this triangle option to remain valid. Should wave *c* continue higher, it cannot rally above the wave *a* high of 98.41 for this triangle option to remain valid, either.
Our wave -iv- counts is very complex and looks like:
.a.:
*a* = 94.88;
*b* = 100.26;
*c* = 93.17, to complete all of wave .a..
.b. triangle:
*a* = 98.41
*b* = 92.54;
*c*:
!a! = 96.88;
!b! = 93.83;
!c! = 97.30, if complete, to complete all of wave *c*.;
*d* drop is next, followed by a wave *e* rally to complete all of our wave .b. triangle.”
We are flat the USDX (no positions)!
NatGas
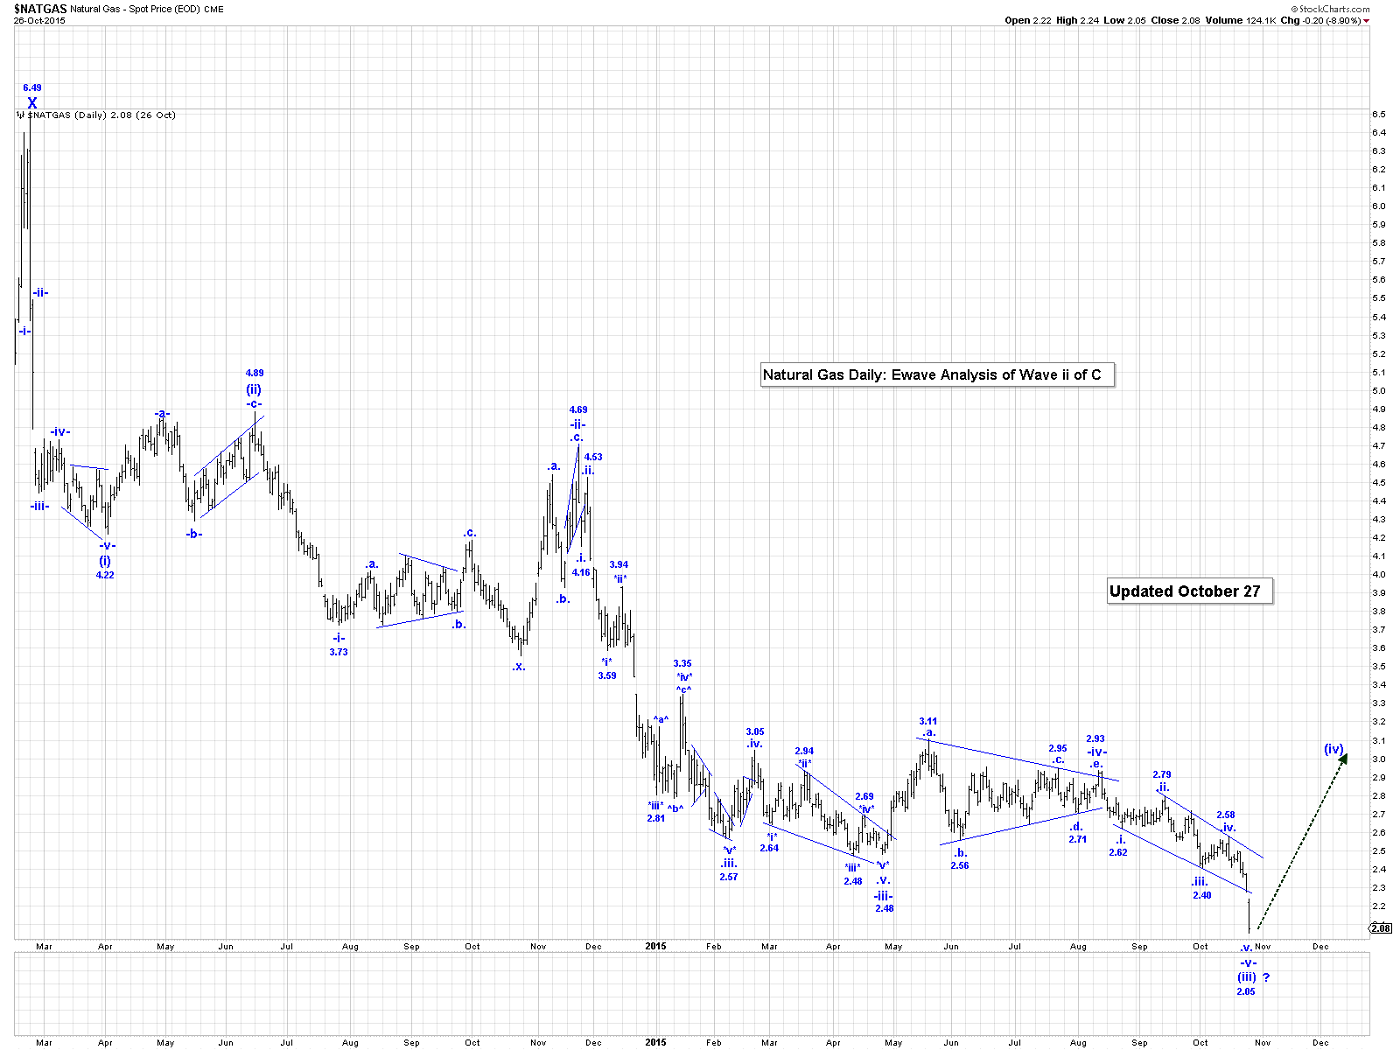
As you can see on the attached Daily NG Chart, the daily continuous futures contract hit a low yesterday of 2.05, while the nearest active contract fell, but did not make a new low below 2.276.
We are trading the nearest active contract, so we are in the game.
In terms of that analysis it remains valid as you can sometimes get a throw over in the last leg of bearish and bullish diagonal triangles. In this case wave (iii) ended at 2.05 and we are now rallying in wave (iv).
Based on the spike low, we are now raising our stop to 2.27. In the overnight session NG reached a low of 2.326.
Only a break of the downtrend line connecting 2.79 and 2.58 would confirm that wave (iii) is complete at the 2.276 low.
We are long 5 positions at 2.32, risking to just 2.27!
HUI/GDX

It looks like our wave -iv- triangle extending, as we suggested it might. Based on the rate this triangle formation is developing we should expect to see a sharp thrust higher in wave -v-, sometimes later this week.
Our current count is :
-i- = 14.71;
-ii- = 13.19;
-iii-:
.i. = 14.71;
.ii. = 13.19;
.iii. = 15.77
.iv. triangle = 15.73;
.v. = 17.04, to complete all of wave -iii-;
-iv- triangle continues to unfold;
-v- rally is next to at least the 17.04 high to complete all of wave (i).
It is also possible that we are still working on a large wave .iv. of -iii- triangle, which would be a very bullish development. The attached 120 Min GDX shows this count, which currently is our alternate.
In fact, our possible alternate count that includes the wave .iv. triangle may have ended at 15.79. If that is the case, then we should now expect a wave .v. thrust, which has a minimum target of 17.04.
We are long GDX, ABX, KGC, NEM, CRJ, and TSX:XGD with no stops!
CLAUDE RESOURCES
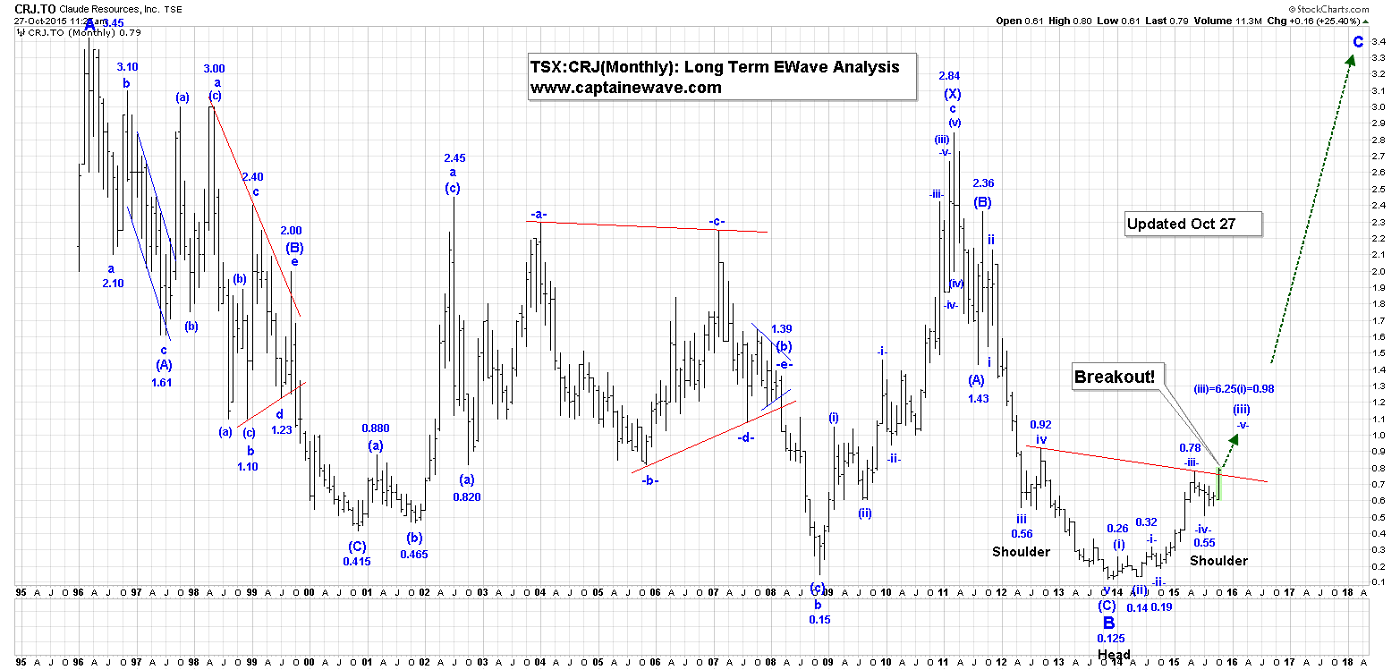
Breakout! Claude is our bell weather gold stock, and the key upside breakout in play now is likely a signal that the giant “C wave to the sky” for the entire gold stocks sector is very near at hand.

That’s a closer look at Claude’s price action, via the daily chart. Our next target is 98 cents, and we’ve been urging subscribers to buy this since the lows a year ago, in the 15 cent area. Claude is poised to turn into a C wave gravy train, for anyone invested in it!
********
Captain Ewave & Crew!
Email: [email protected]
Website: www.captainewave.com
Risk: CAPTAINEWAVE.COM IS AN IMPERSONAL ADVISORY SERVICE. AND THEREFORE, NO CONSIDERATION CAN OR IS MADE TOWARD YOUR FINANCIAL CIRCUMSTANCES. ALL MATERIAL PRESENTED WITHIN CAPTAINEWAVE.COM IS NOT TO BE REGARDED AS INVESTMENT ADVICE, BUT FOR GENERAL INFORMATIONAL PURPOSES ONLY. TRADING STOCKS DOES INVOLVE RISK, SO CAUTION MUST ALWAYS BE UTILIZED. WE CANNOT GUARANTEE PROFITS OR FREEDOM FROM LOSS. YOU ASSUME THE ENTIRE COST AND RISK OF ANY TRADING YOU CHOOSE TO UNDERTAKE. YOU ALSO AGREE TO BEAR COMPLETE RESPONSIBILITY FOR YOUR INVESTMENT RESEARCH AND DECISIONS AND ACKNOWLEDGE THAT CAPTAINEWAVE.COM HAS NOT AND WILL NOT MAKE ANY SPECIFIC RECOMMENDATIONS OR GIVE ADVICE TO YOU OR ANY OF ITS CLIENTS UPON WHICH THEY SHOULD RELY. CAPTAINEWAVE.COM SUGGESTS THAT THE CLIENT/MEMBER TEST ALL INFORMATION AND TRADING METHODOLOGIES PROVIDED AT OUR SITE THROUGH PAPER TRADING OR SOME OTHER FORM OF TESTING. CAPTAINEWAVE.COM, ITS OWNERS, OR ITS REPRESENTATIVES ARE NOT REGISTERED AS SECURITIES BROKER-DEALERS OR INVESTMENT ADVISORS EITHER WITH THE U.S. SECURITIES AND EXCHANGE COMMISSION OR WITH ANY STATE SECURITIES REGULATORY AUTHORITY. WE RECOMMEND CONSULTING WITH A REGISTERED INVESTMENT ADVISOR, BROKER-DEALER, AND/OR FINANCIAL ADVISOR. IF YOU CHOOSE TO INVEST WITH OR WITHOUT SEEKING ADVICE FROM SUCH AN ADVISOR OR ENTITY, THEN ANY CONSEQUENCES RESULTING FROM YOUR INVESTMENTS ARE YOUR SOLE RESPONSIBILITY.
ALL INFORMATION POSTED IS BELIEVED TO COME FROM RELIABLE SOURCES. CAPTAINEWAVE.COM DOES NOT WARRANT THE ACCURACY, CORRECTNESS, OR COMPLETENESS OF INFORMATION AVAILABLE FROM ITS SERVICE AND THEREFORE WILL NOT BE LIABLE FOR ANY LOSS INCURRED. DUE TO THE ELECTRONIC NATURE OF THE INTERNET, THE CAPTAINEWAVE.COM WEBSITE, ITS E-MAIL & DISTRIBUTION SERVICES AND ANY OTHER SUCH "ALERTS" COULD FAIL AT ANY GIVEN TIME. CAPTAINEWAVE.COM WILL NOT BE RESPONSIBLE FOR UNAVAILABILITY OF USE OF ITS WEBSITE, NOR UNDELIVERED E-MAILS, OR "ALERTS" DUE TO INTERNET BANDWIDTH PROBLEMS, EQUIPMENT FAILURE, OR ACTS OF GOD. CAPTAINEWAVE.COM DOES NOT WARRANT THAT THE TRANSMISSION OF E-MAILS, OR ANY "ALERT" WILL BE UNINTERRUPTED OR ERROR-FREE. CAPTAINEWAVE.COM WILL NOT BE LIABLE FOR THE ACTS OR OMISSIONS OF ANY THIRD PARTY WITH REGARDS TO CAPTAINEWAVE.COM DELAY OR NON-DELIVERY OF THE CAPTAINEWAVE.COM NIGHTLY EMAILS OR "ALERTS". FURTHER, WE DO NOT RECEIVE ANY FORM OF PAYMENT OR OTHER COMPENSATION FOR PUBLISHING INFORMATION, NEWS, RESEARCH OR ANY OTHER MATERIAL CONCERNING ANY SECURITIES ON OUR SITE OR PUBLISH ANY INFORMATION ON OUR SITE THAT IS INTENDED TO AFFECT OR INFLUENCE THE VALUE OF SECURITIES.
THERE IS NO GUARANTEE PAST PERFORMANCE WILL BE INDICATIVE OF FUTURE RESULTS. NO ASSURANCE CAN BE GIVEN THAT THE RECOMMENDATIONS OF CAPTAINEWAVE.COM WILL BE PROFITABLE OR WILL NOT BE SUBJECT TO LOSSES. ALL CLIENTS SHOULD UNDERSTAND THAT THE RESULTS OF A PARTICULAR PERIOD WILL NOT NECESSARILY BE INDICATIVE OF RESULTS IN FUTURE PERIODS. THE RESULTS LISTED AT THIS WEBSITE ARE BASED ON HYPOTHETICAL TRADES. PLAINLY SPEAKING, THESE TRADES WERE NOT ACTUALLY EXECUTED. HYPOTHETICAL OR SIMULATED PERFORMANCE RESULTS HAVE CERTAIN INHERENT LIMITATIONS. UNLIKE AN ACTUAL PERFORMANCE RECORD, SIMULATED TRADES DO NOT REPRESENT ACTUAL TRADING. ALSO, SINCE THE TRADES HAVE NOT ACTUALLY BEEN EXECUTED, THE RESULTS MAY HAVE OVER OR UNDER COMPENSATED FOR THE IMPACT, IF ANY, OF CERTAIN MARKET FACTORS SUCH AS LACK OF LIQUIDITY. YOU MAY HAVE DONE BETTER OR WORSE THAN THE RESULTS PORTRAYED. NO REPRESENTATION IS BEING MADE THAT ANY ACCOUNT WILL OR IS LIKELY TO ACHIEVE PROFITS OR LOSSES SIMILAR TO THOSE SHOWN. NO INDEPENDENT PARTY HAS AUDITED THE HYPOTHETICAL PERFORMANCE CONTAINED AT THIS WEBSITE, NOR HAS ANY INDEPENDENT PARTY UNDERTAKEN TO CONFIRM THAT THEY REFLECT THE TRADING METHOD UNDER THE ASSUMPTIONS OR CONDITIONS SPECIFIED HEREAFTER. WHILE THE RESULTS PRESENTED AT THIS WEBSITE ARE BASED UPON CERTAIN ASSUMPTIONS BELIEVED TO REFLECT ACTUAL TRADING CONDITIONS, THESE ASSUMPTIONS MAY NOT INCLUDE ALL VARIABLES THAT WILL AFFECT, OR HAVE IN THE PAST AFFECTED, THE EXECUTION OF TRADES INDICATED BY CAPTAINEWAVE.COM. THE HYPOTHETICAL RESULTS ON THIS WEBSITE ARE BASED ON THE ASSUMPTION THAT THE CLIENT BUY AND SELLS THE POSITIONS AT THE OPEN PRICE OF THE STOCK. THE SIMULATION ASSUMES PURCHASE AND SALE PRICES BELIEVED TO BE ATTAINABLE. IN ACTUAL TRADING, PRICES RECEIVED MAY OR MAY NOT BE THE SAME AS THE ASSUMED ORDER PRICES.


